UTILIZATION OF LANDFILL GAS IN
EMISSION TRADING FROM
THE FINNISH VIEWPOINT
Antti Niskanen
Sami Lappalainen
Mika Horttanainen
Lappeenranta University a/Technology, Finland
ABSTRACT
In this study the landfill gas utilization project case in the Volkhonka landfill in Russia is presented. The carbon dioxide emissions into the atmosphere from landfills with and without landfill gas collection systems are estimated and also emissions of certain fuels are calculated. According to the results of the study, the utilization project might be very profitable if the circumstances are suitable.
KEYWORDS
Landfill; Landfill Gas; Methane; Greenhouse Gas; Emission Trading; Climate Change
1. INTRODUCTION
Climate change is one of the most serious environmental threats. Therefore, many governments have ratified the Kyoto Protocol, the purpose of which is to reduce greenhouse gas (GHG) emissions and prevent the greenhouse effect. Finland has committed to reducing GHG emissions to the level of 1990. In 2003, the emissions were about 15 million tonnes greater than in 1990 [I]. According to forecasts of authorities, the amount ofGHG emissions will continue to grow in Finland. Finnish industry has already taken many financially reasonable measures to save energy and to improve energy efficiency. It appears that it is not a matter of course to reach the emission reduction target in the future in Finland. One way is purchasing Assigned Amount Units (AAU) which are the CO2 equivalent units owned by states which participate in the emission trade mechanism of the Kyoto protocol.
One very potent GHG is landfill gas (LFG), because it contains a great deal of methane (CH4), which is 23 times stronger than carbon dioxide (CO2) [2]. Landfills without a collection system have a major influence on the greenhouse effect. The Clean Development Mechanism (CDM) and Joint Implementation (JI) mentioned in the Kyoto Protocol are project based emission reduction systems and operate under the United Nations Framework Convention on Climate Change (UNFCCC). These mechanisms make it possible to launch LFG utilization projects for example in ANNEX I countries and purchase Emission Reduction Units (ERU) which are the CO2 equivalent units.
The Second Baltic Symposium on Environmental Chemistry KALMAR, SWEDEN, November 28 - 30, 2005
This paper presents a study of the utilization of LFG in emission trading, The study compares the CO2 emissions and the Global Wanning Potential (GWP) of landfills without any collection system, torch burning and energy utilization which replace fossil fuels,
Torch burning decreases CH4 emissions by about 95 %, and emissions can be reduced even more with energy utilization, The comparison is carried out using the GaBi Life Cycle Assessment program, The study also examines the financial preconditions of LFG utilization projects with different CO2 emission costs,
2. EMISSION TRADING
In 1992 the United Nations Framework Convention on Climate Change (UNFCCC) was accepted, It defined the frames for international climate policy and 188 countries have ratified it The Framework came into force in 1994, The main goal of the Framework is to tackle the challenges posed by climate change, On 11 December 1997, a number of governments adopted the Kyoto Protocol, which sets legally binding limits to GHG emissions in industrial countries, These countries are required to reduce GHG emissions on average 5,2 % below the 1990 levels, Finland has committed to reducing greenhouse gas emissions to the level of 1990, GHG emissions were 70,4 Mtco2-ckv in Finland in 1990 [I],
EU has drawn up a scheme for GHG emission allowance trading, Allowance means an aJJowance to emit one tonne of carbon dioxide or an equivalent during a specified period [3], Every EU member state has its own emission level target and the competent authorities of the member states grant the allowances for companies, In Finland the competent authority is the Ministry of Trade and Industry, EU emission trading is extended beyond the EU with The Clean Development Mechanism and Joint Implementation,
2.1. Price of Allowance in EU Market
Any company is able to buy more allowances if they need more GHG emission permits than they already have, The price of emission allowances is predicated on supply and demand, Before GHG emission permits had been granted, forecasts for allowance prices changed typically between 5 and 15 € / tco2, In the early 2005 the allowance price was 7,5 € / tc02 [4], After that the price started to rise and in July 2005 it had risen up to 28 € / tc02 [4], In October 2005 the price was 23 € / tco2 [5], The very high price surprised operators, because for many Finnish companies it meant additional expenses, It is very difficult to predict the allowance price, because there are many unforeseeable factors which have an effect on it Financial analysts have generally forecasted that the prices of EU Allowances could be between S and 50 € / t c02 [6],
3. LANDFILL GAS GENERATION
3.1. Quality and Quantity of LFGThe quality of solid waste and the age oflandfill have a major influence on landfill gas quality and quantity, Many other factors have an effect on the consistence of LFG, The quality of LFG usually differs notably in different landfills, Typical chemical contents for landfill gas can be found from literature and one typical consistence is shown in Table I,
Table 1. Typical constituents found in LFG [7].
Component Percent (dry volume basis)
Methane 45-60
Carbon dioxide 40-60
Nitrogen 2-5
Oxygen 0.1 - LO
Sulfides, disulfides, mercaptans, etc. 0-1.0
Ammonia 0.1- LO
Hydrogen 0 - 0.2
Carbon monoxide 0 - 0.2
Trace constituents 0.01 - 0.6
Every landfill generates a certain type of LFG. The only way to define the exact content is measuring the LFG. The measuring should be carried out from sufficiently many locations at the landfill so that the average proportions of the landfill gas can be determined reliably. The measurements are usually carried out by sucking gas from drilled holes to the analyzer. 3.2. Generation of CH4
Amount of CH4 can be calculated. The Intergovernmental Panel on Climate Change (IPCC) has commonly used two calculation methods for the estimation of CH4 emission from landfills. The volume of CH4 can be calculated with the Default Method [8], which does not give an exact emission profile over time. The results of the Default Method are not exact, but sometimes there is no available data about the landfill and waste which generates CH4 ("see Equation 1 ").
(I)
where:
CH4emission Methane emissions [kgrnJa]
MSWr Total MSW generated [kg/a]
MSWF Fraction of MSW disposed at SWDS
R Recovered C� [kg/a]
ox
Oxidation factor (fraction)Lo Methane generation potential [kgctt4lkgwas1e]
The methane generation potential Lo can be calculated with the Equation 2 below:
16
L =MCF-DOC·DOC ·-·F 0 (2)
F 12 where:
MCF Methane correction factor (fraction)
DOC Degradable organic carbon fraction [kgc/kgMsw] DOCF Fraction DOC dissimilated
--- ----Kalmar ECO-TECH '05 and
The Second Baltic Symposium on Environmental Chemistry KALMAR, SWEDEN, November 28 -30, 2005
The First Order Decay (FOD) [8] method is considerably more exact, but it needs more data than the Default Method. In many cases certain data of waste is not available and methane generation has to be calculated with the Default Method.
4. INFLUENCE OF LANDFILL GAS AND CERTAIN FUELS ON
CLIMATE CHANGE
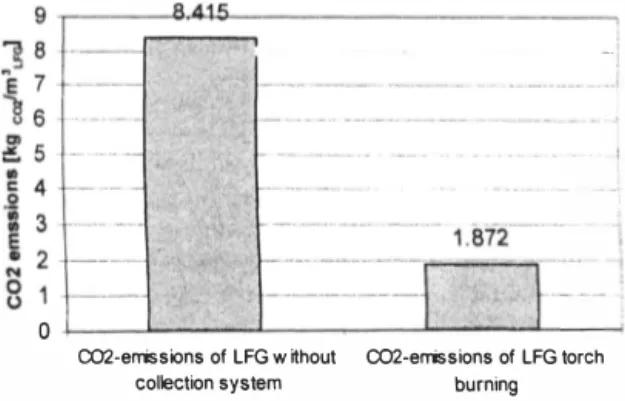
Degradation of organic matter of municipal solid waste (MSW) generates LFG in anaerobic circumstances in landfills. Bogs, peat bogs and landfills are major sources of methane. The biggest methane source, resulting from human life, are landfills. Without a collection system landfills have a major influence on the greenhouse effect. From Figure I we can see that without any collection systems the GHG emissions of LFG are extensive and torch burning of LFG degrades CO2 emissions significantly ("see Figure 1 "). In accordance with IPCC, CH4 is a 23 times stronger greenhouse gas as CO2 [2]. But it is very important to notice that the official conversion factor is 21 (xcH4 = 2 I kgc02-ekvlkgcH4) when CH4 emissions are converted to CO2 emissions [9].
One common calculation method for the greenhouse effect is the Global Warming Potential (GWP), the unit of which is CO2-ekv• The results produced by the GWP100 method cover the
next one hundred year [2]. In the Figure 2 the GWP100 is calculated with the GaBi 4.0 Life Cycle Engineering software for general fuels such us oil, coal and natural gas when I kWh electric power is produced by these fuels ("see Figure 2").
I---'
0
002-errissions of LFG w �hout 002-errissions of LFG torch collection system burning
Figure I. CO2 emission per one LFG cubic meter to air when LFG contains 50 Volume-% methane and 45 Volume-% carbon dioxide.
� ---1.2 �--- --- - ·---rwro- ··-.., 1 I T----4.-909-1--- - --- t--- -0.8056
a
o.
a�-""' ';; I � 0.6 t-· :;J 0.4J.
-S
0.2 _j____ 0Fuel Oil Hard Coal Natural Gas
Fuel of Power Plant
Figure 2. GWP100 C02.,1.v emission comparison between oil, coal and natural gas based on a database of the GaBi 4.0 Life Cycle Engineering software [JO}.
LFG utilization decreases the need for fossil fuels in energy production. LFG contains a great deal of CO2 and C� ("see Table 1 "). Both compounds contribute to the greenhouse effect, but on the other hand, a high concentration of CH4 in LFG gives good properties for power generation. Numerous landfills worldwide are without any LFG collection system. A great amount of LFG could be collected for energy utilization. Substituting fossil fuels for LFG utilization reduces GHG emissions and in many cases other emissions, such as sulfur dioxide, can be avoided. CO2 emissions for different fuels can be assessed when the consistence of oil and coal fuels, the heating values, reaction equations (C + 02 -> CO2) and (CH4 + 202 -> CO2 + 2H20) and molar masses of carbon, methane and carbon dioxide and the energy efficiencies for the power plants are known.
Table 2. Calculate values for electricity production by oil, coal and methane [J 1, 12, 13].
Fuel Content of Carbon Heating value Efficiency of
mass-% [kWh/kg] electric power
Oil 88.45 11.44 0,40
Coal 72 6.89 0,43
Methane (Cl-Li) 13,9 0,55
0.891 0.900 + --- ---·---- --- · · -0.800
I
0.100t
0.600 § 0.500 � 0.400 � N 0.300 0 u 0.200 0. 1 00 0. 000 -'---'--'--..;.-'---'--'---'----_._---''----< The Second Baltic Symposium on Environmental ChemistryKALMAR, SWEDEN, November 28 - 30, 2005
1 .000
Electricity production Electricity production Electricity production
by oil by coal by methane
Figure 3. CO2 emission to air when oil, coal and methane fuels are burned and 1 kWh electric power is generated
Obviously, methane fuel causes notably lower CO2 emissions than oil or coal fuels ("see Figure 3 "). Energy utilization of methane is very profitable from an environmental point of view. In many cases, especially in developing _countries, big landfills have no LFG collection systems and carbon dioxide and methane are released into the atmosphere. Both gases have a significant effect on the climate change, which is a serious global environmental problem. Collection of LFG and torch burning considerably reduce GHG emissions ("see Figure J "), The best results in LFG energy utilization could be reached if fossils fuels were replaced by LFG entirely.
5. CASE - FEASIBILITY OF GHG EMISSION REDUCTION IN
VOLKHONKA LANDFILL IN RUSSIA
From the Finnish viewpoint, one very interesting Annex I country is Russia. Many Russian landfills are without any LFG collection system and greenhouse gas emissions could be reduced significantly. This study evaluated the feasibility of LFG collection and pilot burner systems in the Volkhonka landfill. Volkhonka is one of the largest landfills in the Leningrad region. This municipal solid waste landfill has been operating since 1978 and the volume of waste deposited in the landfill has exceeded the designed maximal waste capacity. The most important numerical data on the landfill is displayed in Table 3 below.
Table J Numerical information on Volkhonka landfill [/4},
Vo/khonka (SWL-1)
Waste type Municipal solid waste
Opened 1 978 Total volume 29,3 Mm3 Design capacity 20,99 Mm3 Area 34,5 ha Average depth 29 m Waste acceptance in 2000 1 ,768 Mm3
According to theoretical modeling ("see Equations 1, 2 "), the methane formation of the landfill is between 11 200 - 13 700 tcH4 per year [8, 14], This is equal to 0.24 - 0.35 million tonnes of CO2. The result reveals that methane formation is very significant not only because of emissions but also regarding energy, The methane flow is equal to 18 - 22 MW of fuel power.
5.1. Feasibility of LFG collection system in Volkhonka landfill:
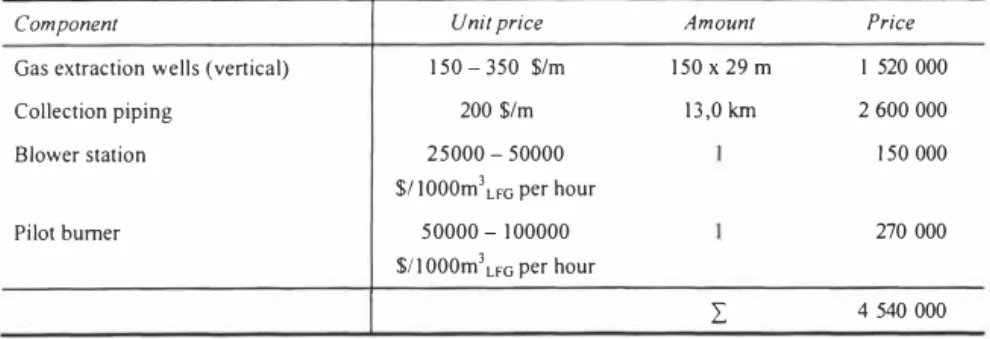
The capital costs of an LFG collection system and the profit from emission allowances can be roughly estimated for the landfill described in Table 3 when the typical unit prices are known and the yearly methane formation is assumed to be about 12 000 tcH4, The costs of a collection, suction and utilization system are roughly calculated in following Table ("see Table 4").
In this case the yearly profit comes from emission allowances which are achieved by burning methane. As described earlier, I tonne of methane can be covered by 21 emission allowances, which have a certain price, when it is converted to CO2, The following Figure shows the cumulative profit of an LFG collection system in the Volkhonka landfill assuming that the methane formation is the same 12 000 t/a which equals 0.25 million carbon dioxide tonnes per year in the 5 year period ("see Figure 4 ''),
Table 4. Capital costs of components used in landfill gas collection systems [14, 15
I
Component Unit price Amount Price
Gas extraction wells ( vertical) 1 50 - 350 $Im 1 50 X 29 m I 520 000
Collection piping 200 $Im 1 3 ,0 km 2 600 000
Blower station 25000 - 50000 1 50 000
$11O00m\FG per hour
Pilot burner 5 0000 - 1 00000 270 000
Kalmar ECO-TECH
·os
andThe Second Baltic Symposium on Environmental Chemistry KALMAR, SWEDEN, November 28 - 30, 2005 8 6 4
w
2�
�
a.. -2 -4 -6 - 4 €/t_C02 - 6 . 5 €/!_CO2 1 - 9 €/t CO2 L___�_....::_ _ -Time [Years]Figure 4. The profit from the emission allowances when the LFG collection system project is realized in the Volkhonka landfill.
Each line in the Figure 4 represents a different price of an emission reduction unit (ERU) in the case of Joint Implementation project. The price of ERU has recently varied approximately between 3,5 and 6 €/tc02 according to World Bank. The price of AAU has varied between 1 5 and 28 €/tc02 during the latest 6 months. The difference in prices o f ERU and AAU i s caused by the risks related to ERU trade compared to AAU trade. There are for example such risks that the amounts of emission reduction will be lower than expected or the price of AAU will decrease during the period of emission reduction realization. The share of the risk between the seller and buyer of the ERUs influences on the price
6. DISCUSSION AND CONCLUSIONS
Many governments are concerned about climate change because it is obviously a serious environmental threat. Emission trading is one method for reducing GHG emissions and fighting the greenhouse effect. Finland has committed to reducing greenhouse gas emissions to the level of 1 990. GHG emission limits may produce additional expenses for many Finnish companies. If in future the allowance prices rise very high, a JI project could be profitable. Labor costs and other expenses have a great influence on the total cost of the project and these elements have to be taken into consideration in the planning phase of the LFG utilization project. In the case of JI project there is also a possibility that the purchaser of the emission reduction units can resell them. So there is possibility for profitable business because the selling price of the realized emission reduction units can be remarkably higher than the price of ERUs at the moment of JI contract.
Nevertheless, in the Volkhonka landfill case it seems that a JI project in Russia is realistic from an economical point of view, and it also has environmental advantages. Reduction of greenhouse gas emissions is not the only environmental advantage. Collection of landfill gases decreases also substantially the risk of landfill fires which cause lots of toxic emissions to the atmosphere. Also the odors of the landfill can be reduced. However, in the case of Russia the landfills can be filled so that part of the organic material decomposes aerobically during the use of the landfill. Because of this the generation of the landfill gas
has to be measured and estimated carefully before the investment decisions and design of the gas collection systems.
REFERENCES
[I] Statistics Finland. 2005. Greenhouse gas em1ss10ns m Finland I 990-2003, National Inventory Report to the UNFCCC, 1 5th April 2005. Available from: http:/ /www.stat.fi/tup/khkinv/khkaasut_ nir _ 2005 _ eu. pdf
[2] IPPCa. Climate Change 2001n. IPPC Third Assesnsment Report. The Scientific Basis, Technical Summary. Chapter: C.6 Global Warming Potentials. Available from: http:/ /www.grida.no/climate/ipcc _ tar/wg 1/020.htm#c6
[3] Directive 2003/87/EC. Establishing a scheme for greenhouse gas emission allowance trading within the Community and amending Council Directive 95/6 1 /EC.
[4] GreenStream Network. 2005. Emission Trading Review 12. 1 0.2005. Available from: httpn://www.ngreenstrearn.net/default.asp ?doc! d= 1 2977
[5] Tynjala Tommi. 2005. Executive Vice President & Partner of GreenStream Network. GreenStrearn Network. Telephone conversation on 6 October 2005.
[6] Klein Alex. 2005. Waste and emission trading: Operations for easing the EU 's greenhouse gas burden. Waste Management World January - February 2005, 57 - 64. ISSNn: 1 476-1 394.
[7] Tchobanoglous, G., Theisen, H., Vigil, S.A. 1 993. Integrated Solid Waste Management: Engineering Principles and Management Issues. McGraw-Hill International Editions. 2nd edition. 992 p. ISBN: 0-07-063237-5.
[8] IPPCb. Good Practice Guidance and Uncertainty Management in National Greenhouse Gas Inventories. 200 1 . IPPC. Chapter: 5. Waste. Available from: http://www.ipcc nggip.iges.or.jp/public/gp/english/5_ Waste.pd[
[9] IPCCc. Climate Change 1 995, The Science of Climate Change: Summary for Policymakers and Technical Summary of the Working Group I Report, p. 26.
[I OJ GaBi 4.0. Life Cycle Engineering software 2004. Data from Database of Gabi 4.0. [1 1 ] Flyktman Martti and Helynen Satu. 2004. Hyotysuhteiden mlilirittaminen plilistiikaupan
alkujakoa varten. Valtion teknillinen tutkimuskeskus, 2004. 25 pages. VTT
tutkimusseloste.
(12] Riikonen Arto. 1 997. Maakaasun ja nestekaasun palarninen. Gasum. Julkaisu M6. Second edition. 55 pages.
( 1 3] Alakangas Eija. 2000. Suomessa kiiytettavien polttoaineiden ominaisuuksia. Espoo, Valtion teknillinen tutkimuskeskus, 2000. 1 72 p. VTT tiedotteita 2045. ISBN: 95 1 -38-5699-2.
(14] Lappalainen Sarni, Kouvo Petri. 2004. Evaluation of greenhouse gas emission from landfills in the St. Petersburg area - Utilization of methane in energy production, Metgas. Northern Dimension Research Centre; publication 1 0. 40 p. ISBN: 95 1 -764-992-4.
( 1 5] Conestoga-Rovers & Associates 2004. Handbook for the Preparation of Landfill Gas to Energy Projects in Latin America and Caribbean. Ref. No. 0 1 9399 (6), Ontario, World Bank, 2004. 1 87 p.
![Table 1. Typical constituents found in LFG [7].](https://thumb-eu.123doks.com/thumbv2/5dokorg/3690401.45995/3.709.59.544.121.303/table-typical-constituents-lfg.webp)
![Table 2. Calculate values for electricity production by oil, coal and methane [J 1, 12, 13]](https://thumb-eu.123doks.com/thumbv2/5dokorg/3690401.45995/5.722.62.557.587.691/table-calculate-values-electricity-production-oil-coal-methane.webp)