117
START UP AND STABILIZATION OF
ANAMMOX PROCESS IN AN ANAEROBIC
MEMBRANE BIOREACTOR (A
N
MBR)
S.Suneethi
Kurian Joseph
Centre for Environmental Studies, Anna University
Chennai, India
ABSTRACT
Release of nitrate and ammonia rich wastewaters into the natural waters promotes eutrophication, aquatic toxicity and deterioration in water quality. Anaerobic Ammonium Oxidation (ANAMMOX) process is an advanced biological nitrogen removal alternative to traditional nitrification – denitrification, which removes ammonia using nitrite as the electron acceptor without oxygen. The feasibility to enrich ANAMMOX bacteria from anaerobic seed culture to start up an Anaerobic Membrane Bioreactor (An MBR) for N – removal is reported in this paper. The seed culture used was anaerobic digester sludge collected from a Sewage Treatment Plant (STP) in Chennai. Stabilization performance of An MBR is reported for a period of 250 days, for the presence of ANAMMOX bacteria and its sustained activity in terms of Nitrogen transformations to Ammonia, Nitrite and Nitrate along with Hydrazine and Hydroxylamine.
KEY WORDS
ANAMMOX; Anaerobic membrane bioreactor; start up; nitrogen removal
1 INTRODUCTION
Discharge of nitrate and ammonia rich wastewaters into surface water bodies results in increased algal biomass (eutrophication), emissions of nitrous oxide to atmosphere during oxidation of ammonia, and toxicity to aquatic life [1]. Nitrite nitrogen let out into water bodies without treatment may cause methaemoglobinemia and gastric cancer among human populations [1, 2]. The traditional biological nitrogen removal process involving autotrophic nitrification and heterotrophic denitrification was carried out by aerobic nitrifiers and anaerobic denitrifiers respectively [3]. It required separate oxic and anoxic units for treatment and depended on external addition of carbon dosage (methanol – 3kg/ kg N) and resulted in high production of sludge (1 kgVSS/ kg N) with substantial requirement of resources in terms of energy (2.8 kWh/ kg N) and space [4]. Recently, much attention has been given to new and emerging technologies to deal with high nitrogen content in wastewater in an economical, environmental friendly and sustainable way. Processes such as partial nitrification, ANAMMOX (ANaerobic AMMonium OXidation), SHARON (Single reactor system for High activity Ammonia Removal Over Nitrite), CANON (Complete Autotrophic Nitrogen removal Over Nitrite) and OLAND (Oxygen Limited Autotrophic Nitrification and
Denitrification) overcame the shortcomings of conventional treatments and presented attractive advantages [4]. These processes operate in a single reactor unit, with reduced aeration (1 kWh/ kg N) and organic load requirements, with 90% savings in operational costs [5].
ANAMMOX (ANaerobic AMMonium OXidation) is an innovative technological advancement in removal of ammonia nitrogen from wastewater, carried out by microbial oxidation of ammonia with nitrite occurring under anoxic conditions [5 – 7]. ANAMMOX process combined ammonia and nitrite directly to dinitrogen gas [7]. Start up of ANAMMOX process is considered difficult owing to the slow growth rate (doubling time – 11 days) of ANAMMOX bacteria [8]. The ANAMMOX reaction is carried out by autotrophic Planctomycetes, such as ‘Candidatus Brocadia anammoxidans’ and ‘Candidatus Kuenenia
Stuttgartiensis’, which makes use of ammonium as the electron donor (energy source) and
nitrite as the electron acceptor as indicated in equation (1).
NH4+ + 1.32 NO2− + 0.066 HCO3- + 0.13 H+ Æ 1.02 N2 + 0.26 NO3− + 0.066 CH2O0.5N0.15 + 2.03 H2O ----(1)
In the ANAMMOX process N2 gas is the primary reaction product along with a small amount of nitrate. Dissolved carbon dioxide or bicarbonate is utilized for the cell biosynthesis resulting in hydrazine and hydroxylamine as intermediary metabolites [9]. ANAMMOX process is generally favorable in environments with long sludge retention time (30 – 50 d), stable operation, presence of nitrite (< 70 mg/L), and the absence of electron donors (such as ammonium ion) that would cause nitrite reduction via denitrification [9]. Optimum temperature of 32 – 350C and neutral pH works well for ANAMMOX activity. The prerequisite of ANAMMOX process is the preceding partial nitrification step, which converts ammonium to nitrite. To obtain high removal efficiency, ammonium and nitrite need to be fed to the reactor in the ratio of 1:1.3 [10]. The desired ammonium / nitrite mixture is obtained because after 50% of the ammonium is oxidized, the decrease in pH to 6.7 prevents the oxidation of the remnant ammonium. Sludge retention is important owing to the slow growth rates of the bacteria (0.072 /d at 320C) and low biomass yield (0.13g dry weight / g Amm – N oxidized) [8, 10 – 11].
Development of ANAMMOX bacteria is needed to achieve better acclimatization favoring high nitrogen removal performance, especially in the face of toxic ammonia shock loads, when trying to scale up in larger and complicated reactor configurations like Anaerobic Membrane Bioreactor (An MBR) [5]. Shortening the ANAMMOX process start up period by decreasing the wash-out potential on ANAMMOX biomass becomes an essential strategy for full-scale application. Different types of reactor design to have used minimal wash-out of ANAMMOX biomass were continuous stirred-tank reactor, anaerobic biological filtrated reactor, sequence batch reactor (SBR), up flow reactor (UASB) and gas lift reactor [8, 12 – 14]. Development of An MBR for start up of ANAMMOX process could be considered as a better alternative for a quicker and stable system when compared to the other biological systems. It is because successful cultivation of slow growing bacteria with complete biomass retention, high reactor loading, low sludge production, production of ANAMMOX bacterial suspension as free cells or aggregates with high growth rate could be achieved using An MBR [10, 15 – 16].
Enrichment of ANAMMOX bacteria had been carried out by monitoring chemical nitrogen transformations [17] and/or by studying the microbial eco-physiology through molecular
Stabilization performance of An MBR is reported for a period of 250 days, for prolonged ANAMMOX activity in terms of Nitrogen transformations to Amm – N, Nitrite and Nitrate along with Hydrazine and Hydroxylamine.
2 MATERIALS AND METHODS 2.1 Enrichment medium
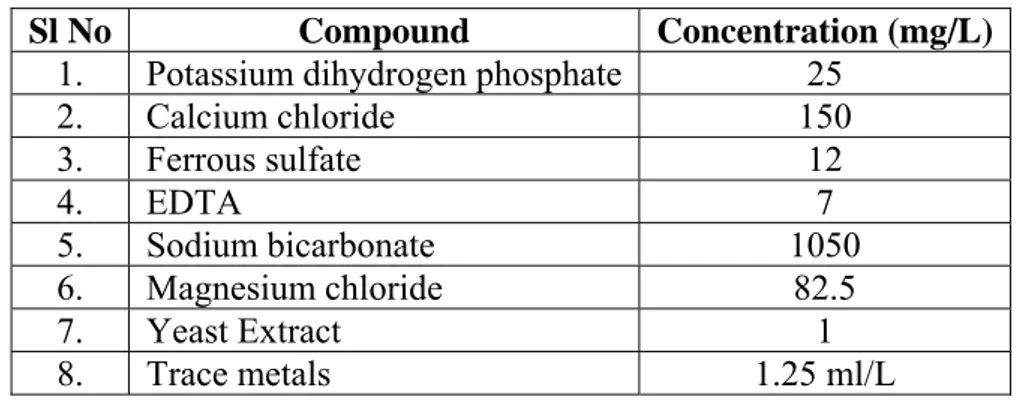
Ammonium and nitrite were supplemented to mineral medium as required in the form of NH4Cl and NaNO2 respectively in 3 separate lines. The composition of the enrichment medium used (modified van de Graaf et al., 1996 [19]), containing major nutrients along with presence of essential trace elements (about 1.25 ml/L), is presented in detail in Table 1 and
Table 2 respectively. pH of the biological system was maintained in the range 6 – 8 without
any adjustment by adding acid or alkali.
Table 1– Composition of ANAMMOX enrichment medium
Sl No Compound Concentration (mg/L)
1. Potassium dihydrogen phosphate 25
2. Calcium chloride 150 3. Ferrous sulfate 12 4. EDTA 7 5. Sodium bicarbonate 1050 6. Magnesium chloride 82.5 7. Yeast Extract 1 8. Trace metals 1.25 ml/L
Table 2 – Composition of Trace metals added with Enrichment medium
Sl No Compound Concentration (mg/L) 1. EDTA 15000 2. Zinc sulfate 430 3. Cobalt chloride 240 4. Manganese sulfate 990 5. Copper sulphate 250 6. Nickel chloride 190 7. Sodium selenite 320 8. Boric acid 14
Source: Modified van de Graaf et al 1996 [19] 2.2 Reactor design and operation
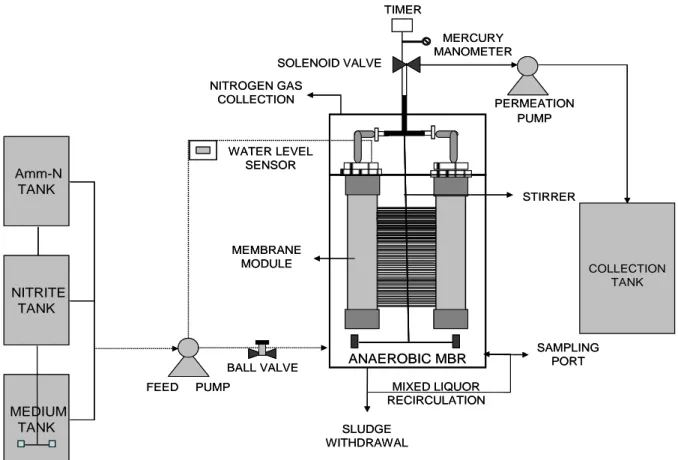
The feed tank containing enrichment medium was continuously stirred by an overhead stirrer at 100 rpm to promote homogeneity of the influent. The An MBR composed of hollow fiber membrane module immersed in the reactor of size 480 mm X 200 mm X 260 mm made of transparent acrylic, with a working volume of 15 L was used. The An MBR was filled with 60% seed, and 40% enrichment medium as food, along with NH4Cl / NaNO2 as supplement, to promote the growth of ANAMMOX bacteria, after excluding the 40% of headspace in total volume. The characteristics of the membrane module are presented in Table 3. The configuration of the experimental setup is depicted in Figure 1. The effluent was continuously
filtered by the membrane module driven by a permeation peristaltic pump (Watson Marlow 313) through the solenoid valve. This operation was controlled by cyclic timer, operating with a filtration cycle of 10 min and 2 min cut off. The water level sensor controls the feed pump to maintain the liquid level in the bioreactor during the experimental period.
Figure 1 – Schematic of the experimental setup of the Anaerobic MBR (An MBR)
2.3. Strategy of operation
The reactor and the membrane were acclimatized for about 30 days with continuous recirculation of the filtrate, prior to monitoring. The Trans membrane pressure (TMP) was regulated in a range of 0.13 to 0.53 kPa. Anaerobic seed sludge of MLSS 50680 mg/L was used to enrich ANAMMOX bacteria. During the start up period NaNO3 (10 mg/L) was added along with the medium to favor the elimination of degradable biomass by denitrifiers and to prevent the generation of H2S by sulfur reducing bacteria [5]. Periodical replenishment of the medium was performed to avoid issues related to accumulation or lack of nutrients. Anoxic condition was maintained by suffocation method over a period of time (i.e. cutting the supply of oxygen). The reactor was covered with black cover to prevent the development of phototrophic algal growth.
SLUDGE WITHDRAWAL FEED PUMP PERMEATION PUMP MEMBRANE MODULE NITROGEN GAS COLLECTION COLLECTION TANK TIMER MERCURY MANOMETER BALL VALVE SOLENOID VALVE STIRRER WATER LEVEL SENSOR MIXED LIQUOR RECIRCULATION Amm-N TANK NITRITE TANK MEDIUM TANK
ANAEROBIC MBR SAMPLING PORT
SLUDGE WITHDRAWAL FEED PUMP PERMEATION PUMP MEMBRANE MODULE NITROGEN GAS COLLECTION COLLECTION TANK TIMER MERCURY MANOMETER BALL VALVE SOLENOID VALVE STIRRER WATER LEVEL SENSOR MIXED LIQUOR RECIRCULATION Amm-N TANK NITRITE TANK MEDIUM TANK Amm-N TANK NITRITE TANK MEDIUM TANK
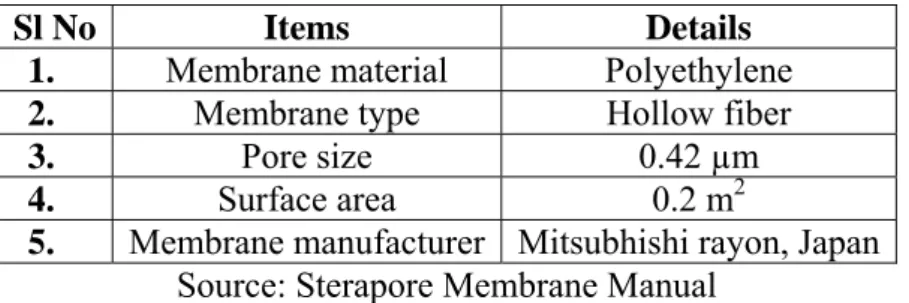
Table 3 – Characteristics of membrane module
Sl No Items Details
1. Membrane material Polyethylene
2. Membrane type Hollow fiber
3. Pore size 0.42 µm
4. Surface area 0.2 m2
5. Membrane manufacturer Mitsubhishi rayon, Japan
Source: Sterapore Membrane Manual
The start up of ANAMMOX process was performed with recirculation of effluent, followed by semi continuous process, then with a continuous mode of operation in the An MBR. The reactor was operated in a semi – continuous mode from day 35 to 112 with nitrogen loading of Amm – N and Nitrite (50 mg/L each) and nutrient feeding every 3 – 4 days, with continuous filtration at 2 d HRT. From day 113, the reactor was continuously fed with the synthetic enrichment medium along with of Amm – N and Nitrite (50 mg/L each). The An MBR was operated at a flow rate of 7.5 L/ d (5 mL/ min) with 2 d HRT. The system was totally operated for 250 days with continuous stirring at 30 rpm. The Nitrogen loading rate (NLR) was increased gradually when the removal efficiency was greater than 95% and/or when effluent ammonium levels was less than 10 mg/L to achieve the discharge limits. Care was taken not to exceed nitrite levels beyond 150 mg/L, as it has been reported to be toxic to ANAMMOX process by earlier batch studies (data not included).
2.4 Membrane cleaning
During times when the transmembrane pressure (TMP) of the membrane increased above 25 kPa, the membrane was cleaned as per the Sterapore membrane manual. First physical cleaning was performed by carefully removing the thick sludge cake layer deposited on the membrane by spraying pressurized water using spray cans. If the membrane resistance was not reclaimed then the membrane was immersed in chemical cleaning tank containing mixed solution of sodium hypochlorite (effective chlorine concentration of 3000 mg/L) and sodium hydroxide (4%) for 24 h. After chemical cleaning, the membrane was thoroughly rinsed with tap water to remove traces of chlorine and checked for 80% recovery of resistance. If the membrane resistance has still not recovered, then acid cleaning was performed with 2% hydrochloric acid (HCl) solution for 2 – 15 h. Finally the membrane was rinsed with clean water and resistance was measured again before use.
2.5 Analytical techniques
The primary characterization of the anaerobic seed culture was carried out by double filtration using muslin cloth, followed by centrifugation at 5000 rpm for 15 minutes. A 100 mL sample was collected every 10 days, from the sampling port and was prepared by filtering through 0.45µ filter paper (Whatman). Nitrogen transformations were studied from the analyses of NO2-, NO3- and Amm – N performed by spectrophotometric method, as per standard methods [20]. ANAMMOX biomass development was determined from the metabolites, hydrazine and hydroxylamine [21 – 22] and indirectly by the MLVSS and MLSS estimations, which was carried out as per standard methods [20]. pH and ORP was measured via a calibrated Ecoscan pH/mV/0C meter (Eutech Instrumentts, Singapore). Transmembrane pressure (TMP) was monitored using mercury manometer. The flow rate was controlled using peristaltic pump. COD and Alkalinity determinations were performed as per Standard methods [20]. Free
ammonia (FA) and free nitric acid (FNA) concentrations were calculated by equilibrium equations (2) and (3) as follows [17, 23 – 24]:
NH3 (mg/L) = 17/14 x Total Ammonia as N (mg/L) x 10 pH/ [exp (6344/ (273+T) +10 pH --- (2)
HNO2 (mg/L) = 46/14 x NO2-(mg/L)/ [exp (6344/ (273+T) +10 pH --- (3) 3 RESULTS AND DISCUSSION
3.1 Start up and stabilization performance of the ANAMMOX process in An MBR 3.1.1 Nitrogen transformations
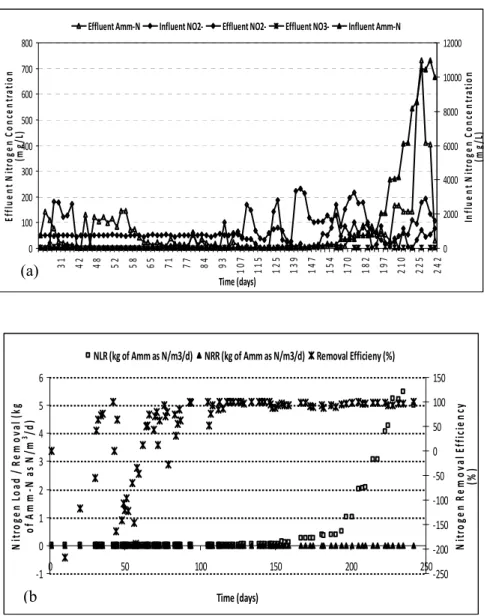
The Nitrogen loading rate (NLR) fed into the reactor depended on nitrogen removal efficiency. NLR was increased to maintain enough substrate for ANAMMOX bacteria and vice versa, when nitrite was being completely consumed. During the initial period, NLR was gradually increased stepwise from 50 to finally a load of 2000 mg/L with 2 d HRT. The performance of the reactor on the nitrogen compounds (nitrite, nitrate and ammonium) during the experimental period is depicted in Figure 2 (a).
The pH of the biological system was in the range of 5.88 – 8.53, with an ORP range of 50 to – 107 mV. It is expected to achieve – 250 mV, to attain complete anoxic condition, as reported by Sabumon et al 2009 [25]. Also the DO level in the An MBR was in the range of 0.2 to 0.5 mg/L. The mean nitrate production was 1.64 mg/L during the 250 days study period. The stoichiometric expected ratio indicating the ANAMMOX process was (NH4+ removed: NO2 -converted: NO3- produced) 1: 1.24: 0.21 [26], and the obtained ratio was 1: 0.84: 0.02. The low degree but significant occurrence of ANAMMOX process, of 1: 1.15 for nitrite consumption to ammonia consumption, had also been reported by Wang et al 2008 [5].
A maximum of ≥ 99 % ammonium removal efficiency between 113 to 146 days of operation was achieved, with a mean Amm - N removal efficiency of only 49.94 %. Varying and unsteady levels of Amm - N till 115 days (as earlier proven by our batch studies) was observed, that indicates seeded sludge took time to stabilize depending upon the source of seed and operation strategy. Steady accumulation and conversion of NO2- till day 113, which was followed by the accumulation of NO2- after day 113 during the start of the continuous operation (150 mg/L). Since above 250 mg/L of NO2- is reported to be toxic to ANAMMOX process [26], no NO2- supplement was given till levels reached < 10 mg/L. As depicted in
Figure 2 (b), the mean nitrogen removal efficiency of 49.38 % was achieved during the study
period. Once into the continuous mode of operation, the highest removal efficacy of 98% was achieved between days 118 to 146, when the nitrogen loading was 0.0225 to 0.05 kg Amm – N as N/ m3/ d. By the end of operation NLR of 5 kg Amm – N as N/ m3/ d was attained with continuous Amm - N removal. The levels of hydrazine and hydroxylamine during the study period in An MBR were around 0.01 to 0.002 mg/L and 0.08 to 4.64 mg/L respectively, confirming the ANAMMOX activity in the system.
Figure 2 - Performance of the An MBR during the experimental period (a) Influent and effluent nitrogen compound concentrations (b) Nitrogen load (influent ammonium), removal rate and nitrogen removal efficiency (ammonium introduced – ammonium remaining)
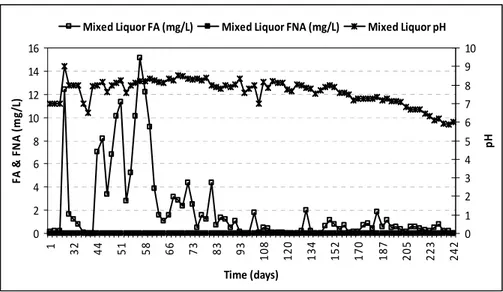
The time courses of free ammonia and free nitric acid during the study period, calculated from equations (1) and (2), is indicated in Figure 3. Occurrence of unionized free ammonia (FA) and free nitrous acid (FNA), dependent on the pH and temperature, in the biological system lead to inhibition of nitrite conversion [17]. In this study, the mean levels of FA and FNA were 2.03 mg/L and 7.94 x 10⁻⁸ mg/L. Interestingly, the FA concentration was above the inhibitory level of 0.1 to 1.0 mg/L and FNA concentration was way below the inhibitory level of 0.2 mg/L, which served to inhibit biological oxidation of nitrite to nitrate. Presence of NOB (Nitrite Oxidizing Bacteria) inhibition is evident when free ammonia concentration is above 0.1 mg/L. Likewise all nitrifying bacteria showed inhibition above 0.2 mg/L of free nitrous acid concentration as reported by Anthonisen et al (1976) [23].
0 100 200 300 400 500 600 700 800 1 31 42 48 52 58 65 71 77 84 93 107 115 125 139 147 154 170 182 197 210 225 242 Time (days) Ef fl ue nt Ni tr o ge n Co n ce n tr at io n (m g/ L) 0 2000 4000 6000 8000 10000 12000 In fl ue nt Ni tr o ge n Co n ce n tr at io n (m g/ L)
Effluent Amm‐N Influent NO2‐ Effluent NO2‐ Effluent NO3‐ Influent Amm‐N
(a) ‐1 0 1 2 3 4 5 6 0 50 100 150 200 250 Time (days) Ni tr o ge n Lo ad / Re m o va l (k g of Am m ‐N as N /m 3 /d ) ‐250 ‐200 ‐150 ‐100 ‐50 0 50 100 150 Ni tr o ge n Re m o va l Eff ic ie n cy (% )
NLR (kg of Amm as N/m3/d) NRR (kg of Amm as N/m3/d) Removal Efficieny (%)
Figure 3 - Time courses of nitrogen concentrations in the form of Free Ammonia (FA) and Free Nitrous Acid (FNA)
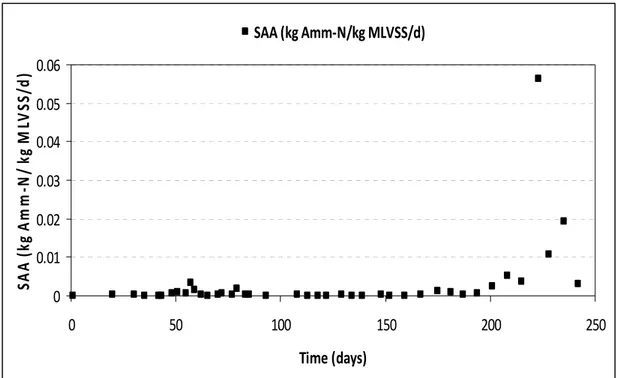
The Specific ANAMMOX Activity (SAA) reported for ANAMMOX systems were 0.072 kg Amm/ kg MLVSS/ d [24], 0.35 mg Amm/ kg MLVSS/ d [5], while the obtained mean SAA was 0.0028 (≈ 0.002777 kg Amm/ kg MLVSS/ d). The highest SAA of 0.0562 kg Amm/ kg MLVSS/ d was noticed on day 223, followed by 0.0192 kg Amm/ kg MLVSS/ d on day 235, as illustrated from Figure 4.
3.1.2 Organic load Vs alkalinity
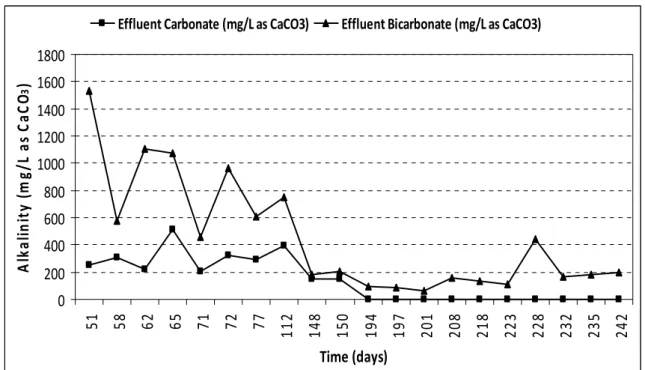
The main source of Carbon for ANAMMOX bacteria is from dissolved carbon dioxide or bicarbonate present in the system [9]. The highest organic removal in the form of COD during the study period was 87.27 % on day 67, as shown in Figure 5. In An MBR presence of Alkalinity in terms of carbonate and bicarbonate, with absence of hydroxide, could be observed from Figure 6. Complete absence of hydroxide, with progressive reduction of carbonate and significant consumption of bicarbonate alkalinity was observed from 181st day. This indicates the growth and development of ANAMMOX populations, with consistent reduction of organic load along with bicarbonate added as part of enrichment medium in the An MBR [9]. 0 2 4 6 8 10 12 14 16 1 32 44 51 58 66 73 83 93 108 120 134 152 170 187 205 223 242 Time (days) FA & FN A (m g/ L) 0 1 2 3 4 5 6 7 8 9 10 pH
Figure 4 – Specific ANAMMOX activity during the experimental period
Figure 5– Organic load levels during ANAMMOX process in An MBR
0 0.01 0.02 0.03 0.04 0.05 0.06 0 50 100 150 200 250 Time (days) SA A (k g Am m ‐N/ kg ML V SS /d ) SAA (kg Amm‐N/kg MLVSS/d) 0 10 20 30 40 50 60 70 0 50 100 150 200 250 Time (days) In fl u e n t CO D (m g/ L) 0 500 1000 1500 2000 2500 3000 3500 Ef fl ue nt CO D (m g/ L) Influent COD (mg/L) Effluent COD (mg/L)
Figure 6 – Alkalinity levels in terms of Carbonate and Bicarbonate as (CaCO3) during
ANAMMOX process in An MBR
3.1.3 ANAMMOX Biomass development
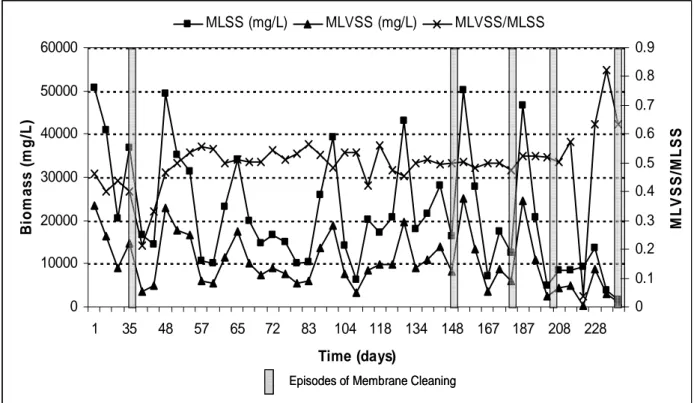
Development of biomass is usually accompanied by clogging of membrane, which is also the limitation of the system causing problems in membrane filtration, reducing membrane permeability and the treated waster output flow and lessens the life of membrane [27]. Fouling was managed by physical and / or chemical membrane cleaning (as guided by Sterapore Membrane Manual) and regular backwashing (with permeate). During the experimental period, physical cleaning with water had to be performed to recover the flux. Sodium hypochorite (1000 ppm effective chlorine concentration) was used to clean the membrane on day 34. As the permeability of the membrane was not recovered to nearly 95% of the original, the chlorine cleaning protocol is followed by acid cleaning. The membrane was thoroughly cleansed of chlorine presence, then subsequently washed and soaked with 1M HCl on day 35. The fouling was attributed to biomass surface conditioning, with pores getting blocked due to residues left by biomass sloughing [28]. The periods of membrane and its effect on reduced biomass is depicted in the Figure 7.
The ANAMMOX activity measured from day 1 – 35, (i.e.) the acclimation period, showed a decrease in MLSS & MLVSS by 27 % and 37 % respectively. Likewise from day 52 to 56 reductions in MLSS & MLVSS by 67 %, then it was followed by a surge of 56% biomass growth from day 59 to 62. The mean MLVSS/MLSS ratio was 1: 0.49. Significant decrease of biomass levels at times of membrane cleaning is evident from the Figure 9. After the cleaning on Day 34, the MLSS levels declined to 14440 mg/L from 36940 mg/L. Likewise on days 147
0 200 400 600 800 1000 1200 1400 1600 1800 51 58 62 65 71 72 77 112 148 150 194 719 201 208 218 322 228 232 235 242 Time (days) A lk a lin it y (m g/ L as Ca CO 3 ) Effluent Carbonate (mg/L as CaCO3) Effluent Bicarbonate (mg/L as CaCO3)
Amm – N as N/m3/d. The overall range of MLSS was around 1.7 to 50 g/L and MLVSS was 1.1 to 25.2 g/L.
Figure 7 – ANAMMOX Biomass development Vs Frequency of membrane cleaning
4 CONCLUSIONS
The start up and stabilization of ANAMMOX process, was initiated with recirculation of effluent, followed by semi continuous process and then with continuous mode of operation in the An MBR. Stabilization performance of ANAMMOX process in An MBR was achieved in a period of 250 days, from anaerobic seed culture. The simultaneous decrease of Amm – N and Nitrite, with consistent production of Nitrate, confirmed with presence of hydrazine and hydroxylamine, along with notable reduction of organic load and consumption of bicarbonate, proves that ANAMMOX process could be initiated and sustained in An MBR successfully. The An MBR stabilization studies should be extended by including gas composition analysis, molecular ecological studies for ANAMMOX activity confirmation.
5 ACKNOWLEDGEMENTS
The Authors thank the support given by the University Grants Commission Research Fellowship for meritorious scholars in Sciences to carry out this study.
6 REFERENCES
[1] Philips, S., Laanbroek, H. J., Verstraete, W., 2002. Origin, causes and effects of increased nitrite concentrations in aquatic environments. Rev. Environ. Sci. Biotechnol. 1, 115 – 141. 0 10000 20000 30000 40000 50000 60000 1 35 48 57 65 72 83 104 118 134 148 167 187 208 228 Time (days) B iom a s s ( m g/L) 0 0.1 0.2 0.3 0.4 0.5 0.6 0.7 0.8 0.9 ML V SS/ ML S S MLSS (mg/L) MLVSS (mg/L) MLVSS/MLSS
Episodes of Membrane Cleaning
0 10000 20000 30000 40000 50000 60000 1 35 48 57 65 72 83 104 118 134 148 167 187 208 228 Time (days) B iom a s s ( m g/L) 0 0.1 0.2 0.3 0.4 0.5 0.6 0.7 0.8 0.9 ML V SS/ ML S S MLSS (mg/L) MLVSS (mg/L) MLVSS/MLSS
Episodes of Membrane Cleaning Episodes of Membrane Cleaning
[2] Guo, Z. H., Qi, Z. S., 2006. Treating leachate mixture with anaerobic ammonium oxidation technology. J Central South Univ Technol. 6, 663 – 667.
[3] Jin, R., Hu, B. L., Zheng, P., Qaisar, M., Hu, A. H., Islam, E., 2008. Quantitative comparison of stability of ANAMMOX process in different reactor configurations. Bior. Technol. 99, 1603 – 1609.
[4] Ganigue, R., Lopez, H., Ruscalleda, M., Balaguer, M. D., Colprim, J., 2008. Operational strategy for a partial nitratation – sequence batch reactor treating urban landfill leachate to achieve a stable influent for an ANAMMOX reactor. J. Chem. Technol.
Biotechnol. 83, 365 – 371.
[5] Wang, T., Zhang, H., Yang, F., Liu, S., Fu, Z., Chen, H., 2009. Start up of the ANAMMOX process from the conventional activated sludge in a membrane bioreactor. Bior.
Technol. 100, 2501 – 2506.
[6] Schmidt, I., Sliekers, O., Schmid, M., Bock, E., Fuerst, J., Kuenen, J. G., Jetten, M. S. M., Strous, M., 2003. New concepts of microbial treatment processes for the nitrogen removal in wastewater. FEMS Microbiol. Rev. 27, 481 – 492.
[7] Shivaraman, N., Shivaraman, G., 2003. ANAMMOX– A novel microbial process for ammonium removal. Curr. Sci. 84(12), 1507 – 1508.
[8] Chamchoi, N., Nitisoravut, S., 2007. ANAMMOX enrichment from different conventional sludges. Chemosphere 66, 2225 – 2232.
[9] Berge, N. D., Reinhart, D. R., Townsend, T. G., 2005. The Fate of Nitrogen in Bioreactor Landfills. Crit. Rev. Environ Sci Technol. 35, 365 – 399.
[10] Trigo, C., Campos, J. L., Garridio, J. M., Mendez, R., 2006. Start-up of the ANAMMOX process in a membrane bioreactor. J. Biotechnol. 126, 475 – 487.
[11] Third, K. A., Paxman, J., Schmid, M., Strous, M., Jetten, M. S. M., Cord-Ruwisch, R., 2005. Enrichment of ANAMMOX from Activated Sludge and its Application in the CANON process. Microbial Ecol. 459, 236 – 244.
[12] Dapena-Mora, A., Campos, J. L., Mosquerra-Corral, A., Jetten, M. S. M., Mendez, R., 2004. Stability of the ANAMMOX process in a gas – lift reactor and a SBR. J.
Biotechnol. 110, 159 – 170.
[13] Liu, S., Yang, F., Gong, Z., Chen, H., Xue, Y., Wang, T., 2008. The enrichment of ANAMMOX bacteria in non – woven rotating biological contactor reactor, IEEE, 3315 – 3318.
[14] Tran, H. T., Park, Y. J., Chow, M. K., Kim, D. J., Han, D. H., 2006. Anaerobic Ammonium Oxidation Process in an Up flow Anaerobic Sludge Reactor with Granular Sludge selected from an anaerobic digester. Biotechnol. Bioprocess Eng. 11, 199 – 204. [15] Van der star, R. L., W, Miclea, A. I., van Dongen, U. G. J. M., Muyzer, G., Picioreanu, C., Loosdrecht, M. C. M. V., 2008. The Membrane Bioreactor: A Novel tool to grow ANAMMOX Bacteria as free cells, Biotechnol. Bioeng. 101 (2), 286 – 294.
[16] Yuan, L. M., Zhang, C.H., Zhang, Y. Q., Ding, Y., Xi, D. L., 2008. Biological nutrient removal using an alternating of anoxic and anaerobic membrane bioreactor (AAAM) process, Desalination 221, 566 –575.
[17] Yamamoto, T., Takaki, K., Koyama, T., Furukawa, K., 2008. Long-term Stability of partial nitritation of swine wastewater digester liquor and its subsequent treatment by ANAMMOX. Bior. Technol. 99, 6419 – 6425.
[18] Cho, S., Takahashi, Y., Fujii, N., Yamada, Y., Satoh, H., Okabe, S., 2010. Nitrogen removal performance and microbial community analysis of an anaerobic up-flow
[19] Van de Graaf, A. A., Bruijn, P. D., Robertson, L. A., Jetten, M. S. M., Kuenen, J. G., 1996. Autotrophic growth of anaerobic ammonium oxidizing microorganisms in a fluidized bed reactor. Microbiol. 142, 2187 – 2196.
[20] APHA, 1998. Standard Methods for the Examination of Water and Wastewater, 20th ed. United Book Press, USA.
[21] Watt, G. W., Chrisp, J. D., 1952. A Spectrophotometric Method for the Determination of Hydrazine. Anal. Chem. 24(12), 2006 – 2008.
[22] Frear, D. S., Burrell, R. C., 1955. Spectrophotometric Method for Determining Hydroxylamine Reductase Activity in Higher Plants. Anal. Chem. 27(10), 1664 – 1665. [23] Anthonisen, A. C., Loehr, R. C., Prakasam, T. B. S., Srinath, E.G., 1976. Inhibition of nitrification by ammonia and nitrous acid. J. Water pollution control Fed. 48, 835 – 852.
[24] Furukawa, K., Inatomi, Y., Qiao, S., Quan, L., Yamamoto, T., Isaka, K., Sumino, T., 2009. Innovative treatment system for digester liquor using ANAMMOX process. Bior Technol. 100, 5437 – 5443.
[25] Sabumon, P. C., 2009. Effect of potential electron acceptors on anoxic ammonia oxidation in the presence of organic carbon, J. Hazardous materials 172, 280 – 288.
[26] Strous, M., Heijnen, J. J., Kuenen, J. G., Jetten, M. S. M., 1998. The sequencing batch reactor as a powerful tool for the study of slowly growing anaerobic ammonium-oxidizing microorganisms, 1998, Appl Microbiol Biotechnol. 50, 598 – 596.
[27] Visvanathan, C., Aim, R. B., Parameshwaran, K., 2000. Membrane separation bioreactors for wastewater treatment, Crit. Rev. Environ. Sci. Technol. 30(1), 1 – 48.
[28] Le-Clech, P., Chen, V., Fane, T. A. G., 2006. Review — Fouling in membrane bioreactors in wastewater treatment, J. Membr. Sci. 284, 17–53.