Kalmar ECO-TECH '05 and
The Second Baltic Symposium on Environmental Chemistry KALMAR, SWEDEN, November 28-30, 2005
THE BALANCED MODEL OF
THE SUSTAINABLE WATER CONSUMPTION
IN A PUBLIC SECTOR IN UKRAINE
Yuliya Vystavna
Kharkiv National Academy of Municipal Economy, Ukraine
ABSTRACTSWater quantity and quality are important aspects of water management concerning to the pollution control as economic and environmental safety of any countries, Due to intensive exploitation and inadequate pollution control Ukraine faces with degradation of natural water resources. The Kharkiv region is an industrially developed region of Ukraine with high population density and water resources scarcity, The disproportion in economical and water resource potentials of the region and significant anthropogenic loadings on the water sources lead to depletion and pollution of ones, and, as a consequence, to the water deficiency, Dwelling sector and office buildings are one of the most powerful water consumers on urbanized territories, Every day the big Ukrainian city, like Kharkiv, consumes no less than 200 million of cub,m water per year and 80 % of that for households water supplying, The powerful water consumption leads to the degradation of water resource, especially, in the big cities with water scarcity,
The aim of the work is to find a new optimal level of water resource consumption for households and office buildings on urbanized territory to base on environmental, economic and social aspects of water use, An environmental engineering modelling, risk assessment and economic methods of analysis have been used for the research work,
The balanced model of quality of water environment and public water demand were developed by real data, The regression parameters were determined for such indicators of water quality as suspended solids, mineralization, ammonium, nitrites, chlorides,
Using the model it is possible to analyze environmental impacts of municipal water consumption and find the optimal level of public water supply,
Also the environmental, economic and social criteria of water saving were developed, KEYWORDS
Balanced model; Public sector; Sustainable water consumption; Wastewater; Surface water quality
Kalmar ECO-TECH ·05 and
The Second Baltic Symposium on Environmental Chemistry KALMAR, SWEDEN, November 28-30, 2005 I INTRODUCTION
I.I. Premise
Agenda 21, the declaration adopted by many countries, sets out many of policies and commitments necessary to ensure sustainability. Determination of influence of wastewater quantity and quality on surface water resources has significant importance on the environmental pollution control and water supply management. The municipal water industry plays the key role in maintaining environmental quality as meeting environmental, economic and social objectives. Thus, water service providers and wastewater treatment plants have a responsibility to work towards sustainable development to achieve a better quality of life for everyone, now and for generations to come. Sustainable development is a contested concept. The efficient practical implementation of sustainable development concept bases on the environment monitonng and resource planning, as economic and social aspects takes in account.
1.2. Situation and Problem
Ukraine is one of the largest countries in Europe with population of about 48 million. But compare to Europe's countries, Ukraine is one of with shortage of water resources. The average year availability of water resources is 1700 m3 per person, for example, such indicator for France is 4570 m3 per person, for Sweden is 24000 m3 per person [I ,2]. At that time, the daily water consumption on urban territory more than 350 litters per person and water leakage during the water transportation are more than 2 krn3 per year. Also, more than I 0500 krn3 per year of wastewaters polluted surface water resources in Ukraine.
Kharkiv is the second largest city in Ukraine with urban population of about 1,5 million. Urban water supply is mostly (on 85%) derived from surface water. The Kharkiv region is not reach in water resources. There are about 200 rivers in the region but most of them are small. The main river - the Seversky Donets - stretches along 220 miles (370 km.) on the territory of the region. The river is fed by underground waters and atmospheric condensation. The rivers that flow into it are the Oskol (the biggest of its tributaries), the Udy, the Lopan, the Kharkiv River and the Mzha [3].
Today, households are the major consumers of water, accounting for, about 75% of water resources supply by municipal water company and corresponds to 375 liters per capita per day. Such high level of water consumption in the city with water scarcity leads to such environmental problems as:
• lowering the volume of natural water resources due to high volume of water consumption;
• wastewater pollution of surface water ;
• water treatment sludge production and accumulation in environment and etc.
Modelling of water pollution by wastewaters in surface water is necessary for planning and management of urban waters. It provides the way to estimate the influence of water consumption on water ecosystem and develop of long-planning water resources management. The balance approach should be applied to find the links between environmental pollution and level of water consumption. Many investigators have tried to use the balance approach in order to model the water quality in urban waters [4-6]. But most of them to orient there study on the industrial water consumption and its influence on surface waters.
Kalmar ECO-TECH '05 and
The Second Baltic Symposium on Environmental Chemistry KALMAR, SWEDEN, November 28-30, 2005 1.3. Objectives
The initiative focused municipal levels and had two main objectives, The first was to develop the balanced model of water consumption based on environmental aspects and the second was to identify the economic and social indicators of sustainable water consumption in public sector.
2. DAT A USED FOR THE STUDY AND METHODS
2.1. Study area
The Lopan River is one of the rivers to catch wastewaters from municipal water treatment m3
company at Kharkiv, Every year about 500 thousand come in the Lopan River from Dykanevka municipal water treatment plant At present time water quality in the Lopan River is not corresponding with Ukrainian Water Quality Standards by such indicators as ammonium, oil products, phenol, nitrates, nitrites, copper, total-iron, zinc, mineralization, 2.2. Data and methods
Study period for model was 1998-2002 with use of monthly data of water quality and quantity. The main data sources were Ukrainian national surface water monitoring data, provided by National Hydro-meteorological Office at Kharkiv, point sources emission database provided by K.harkiv municipal water treatment plant "Dykanevka" as well as Ukrainian yearbooks of national statistics,
Such average monthly data were collected as: indicators of water quality in the Lopan river in the I control point (CPI ) to situated above the Kharkiv city on I km and in the 2 control point (CP2) to set below an entry of municipal wastewaters in the river (0, I km above of the river outfall), The interpolation process was applied for missing data,
3. THE MODEL DEVELOPMENT
The aim of the model development is to establish mathematical agreement between water quality in surface water flow and quality and volume of wastewaters from municipal water treatment plant
A proposed statistic model is based on the balance approach, Its takes into account an entry of wastewaters from municipal water treatment plant and from other non-point and point pollution sources, as well as surface water flow quality,
Thus, we have such extracts as (x,;yJ, where xis the mean of man-caused pollution by ith
pollutant; y is a reaction of water system on the influence,
The linear regress model was proposed as estimated analytic model:
(I ) where Ccp2, is mean the concentration of i pollutant in the CP2 to form by influence of x1_,
(water quality in water flow), x2,, (wastewaters quality) factors, mg/I; bo, b1, b2 is regression
parameters to characterize the entry of pollutants from other non-point and point sources, from municipal water treatment plant "Dykanevka" and also the influence of the Lopan water flow
� __ _ __ _ _ _ Kalmar ECO-TECI I 'OS and
The Second Baltic Symposium on Environmental Chemistry KALMAR, SWEDEN, November 28-30, 2005
on the water quality in the CP2 was took into account accordingly; £ is mean the chance influences,
The x1_, (water quality in water flow), x2_, (wastewaters quality) factors follow dependences:
Qf, ,Jilf,
Xo= (2)
- QI+ Q.
where Cw, is mean the concentration of i pollutant in municipal wastewaters to come in
surface waters, mg/I; Qw is the average monthly charge of municipal wastewaters to come in
surface waters, m3 ; C
fl is the concentration of i'h pollutant in water flow (in the CPI), mg/I; Qi,
is the average monthly water flow rate (in the CP2), m3 .
Thus, the model is following:
(3) A method of least-squares has been used for a regression analysis to provide by standard statistics function of such software programmes as Mathcad 200 I i Professional ( c) MathSoft, Microsoft ExceL
A significance level a to be defined by risk of the type first error, that is mean the hypothesis is true if a is equal� 0,2 (20%),
Results of regression analysis show the presence of regression dependence for such indicators of water quality as suspended solids, mineralization, chlorides, nitrites, nitrates, ammonium, oil products and phenols,
For determining the correspondence of the model with real conditions, the discrepancies between estimated and laboratory data were find, Distributions of discrepancies were graphed for each pollutant The example of distribution of discrepancies is presented below (Figure I,) for suspended solids,
20 _17.429_ _ _ __ _ 0 0 10 l---o�---i 0 0 0 oo o o 0 0 0 0 0 0 0 O 0 co 0 o 0 lo o _ oO 0 0 0
.,
0 0 0 0 0 0 r, -10 r>--·---·-··---_______=
,___________ _ ---...0.----,- !7.429.-2Q I I I I I 0 10 20 30 40 50 0 X,X.l 55-4,5 -1, 7 2 0,5 3 4 3,8 b,
Kalmar ECO-TECH ·05 and
The Second Baltic Symposium on Environmental Chemistry KALMAR, SWEDEN, November 28-30, 2005
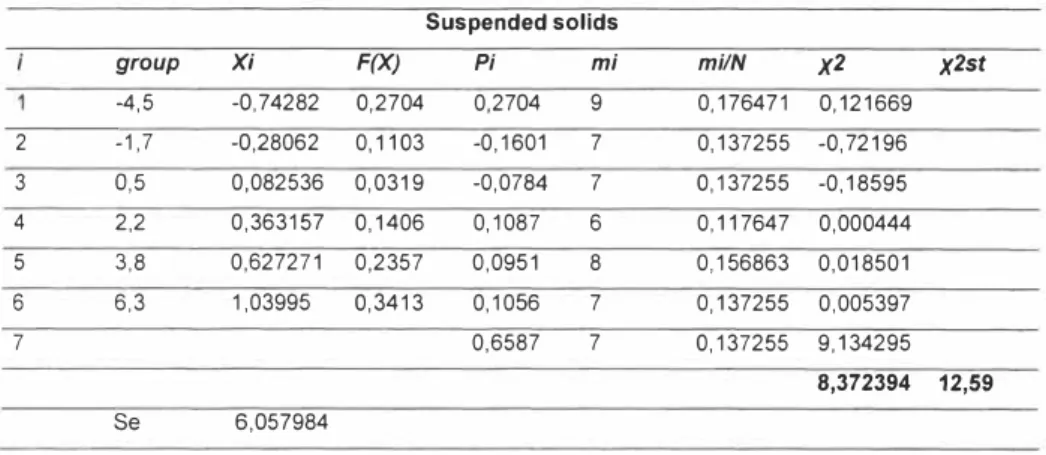
Table I. Normal distribution verification by Pearson criteria. Suspended solids Xi F(X) Pi mi mi!N x2 x2st -0,74282 0,2704 0,2704 9 0, 176471 0, 121669 -0,28062 0, 1103 -0,1601 7 0, 137255 -0,72196 0,082536 0,0319 -0,0784 7 0, 137255 -0, 18595 group 2,2 0,363157 0,1406 0, 1087 6 0, 117647 0,000444 6,3 5 6 0,627271 0,2357 0,0951 8 0, 156863 0,018501 1,03995 0,3413 0, 1056 7 0,137255 0,005397 7 0,6587 7 0, 137255 9, 134295 8,372394 12,59 Se 6,057984
Discrepancies were analyzed by the condition of a chance variation. For indicators to follow the condition the hypothesis of normal distribution were verified by Pearson criteria (x2):
X2 =
f
!1_(m, -
P,J2
=
I
(lll,_-npI (4),.1 P, n ,.1 np,
Where n is mean quantity of remains after statistics analysis to divide by groups with /h data
(i is mean the 5- IO interval). For each group a Xi - indicator was calculated as a correlation of parameter point to standard deviation (Se). A square under the Gaussian curve Fi(Xi) was found by standard statistic tables. The probability p was determined as p1 =F(XJ-F(X1_1). The
mis mean the random number of value in i group (l:mi=n).
The x2st was determined with the 5% significance level and n range of discretion. The example of results table is presented (Table 1) for suspended solids.
The hypothesis of normal distribution is true if x2st more x2. Thus, b0; b1; b2 are regression
parameters to be determined for suspended solids, nitrites, ammonium, mineralization and chlorids. Results are shown in Table 2.
Table 2. Regression parameters.
Significance
Indicators bo Significance b, Significance level
level level Suspended solids 22,789 0,05 -1,088 0,08 0,284 0,05 Nitrites 0,084 0,18 0,588 0,05 >0,2 Ammonium 0,546 0,05 0,370 0,05 >0,2 Mineralization 535,808 0,05 0,395 0,05 >0,2 Chlorides 40,947 0,05 0,420 0,05 >0,2
79 77 Kalmar ECO-TECH 'OS and
The Second Baltic Symposium on Environmental Chem is try KALMAR, SWEDEN, November 28-30, 2005
Table 3, Water quality in CP2 due to public water consumption
PWC, l/persld 350 300 250 200 150
Indicators Concentration in the CP2, mg/{
Suspended solids 11, 155 11,420 11,781 12,289 13,07 Ammonium 1,209 1, 198 1. 182 1, 161 1, 128 Nitrites 0,272 0,269 0,264 0,258 0,249 820 815 808 799 785 Mineralization Chlorides 78 76 74
It can be seen that the values of b 1 are negative for suspended solids but those of b0 and b2.
meaning that the concentration of suspended solids increases if the wastewaters volume decrease, Mostly, other non-point and point water pollution sources impact on water quality in the Lopan River.
Using the model it is possible to calculate the concentration of water quality indicators in the control point to set below the entry of municipal wastewaters (CP2), Variations of water quality in the Lopan River to depend on the level of water consumption are presented in Table 3, Wastewaters quality to come in the river and characteristics of water flow (the Lopan River) are constant
4. RESULTS AND CONCLUSIONS
Based on the model it is possible to monitor the influence of municipal wastewaters on water quality in surface urban waters.
The balanced model of quality of water environment and public water demand were developed by real data. Due to the model it is possible to analyze environmental impacts of municipal water consumption.
But sustainable water consumption help not only save environment but also save money, For the first sustainable water management system should take into consideration economic, social, environmental, legal, institutional and other factors.
On the beginning powerful water consumers should be recovered for developing water conservation measures.
After elucidating the impact of unsustainable water consumption cost-efficiency measures were proposed, Due to implementation of such measures water consumption in household could be reduced on 30%, for example, it is about 200 thousands of cubic m, per day in Kharkiv city. Also the technical and economic indicators were developed for the measures
Kalmar ECO-TECH '05 and
The Second Baltic Symposium on Environmental Chemistry KALMAR, S WEDEN, November 28-30, 2005 Table 4, Indicators of water saving measures in the public sectors,
Environmental Economic Social
-reduction of air emissions; -the value of water saving; -free financial resources
-reduction of wastewaters -municipal payments reduction; -wastes minimization -capital investments;
-decrease of operational expenses
The comparison economic and environment cost-benefit analysis show real positive results of water-saving measures implementation in the municipal economy,
Also research results have shown a low activity of society in environmental problems solving, It connects with no sufficient environmental education to orient on sustainable development Also promotions of environmental friendly living, like ecoliving, are not developed in our country,
However, it is necessary to develop a social activity in environmental problems solving, including resource conservation, The enthusiasm of citizens can be transferred into concrete actions and will increase economic growth while minimizing ecological and environmental harm,
Good economics and good environment must go hand in hand, especially in developing countries, where there is a great potential for improving the efficiency of municipal economy.
REFERENCES
[ l ] 2000. TTocrnttoaa Bepxoattoi' PaJ:ltt YKpai'tttt N21390-XIV BiJ:l 14.01 . e2000 p. ,,flpo KOHl.{errui!O p03BHTKY BOJ{HOro rocrro]:{apcrna YKpai'tttt". 36ipHHK 3aKOHOJ{aBqHx aKTiB YKpai'HH rrpo oxopotty HaBKOJIHlllHbOro cepe]:{OBHl.l.{a. T.6. 3eneHa 6yKOBHHa, Y:epttiaui (in Ukrainian).
[2] WeaeneB, <l>.A., OpnoB T.A., 1 987. 80J{OCHa6lKeHHe 60JJbllIHX ropOJ:lOB 3apy6elKHbIX crpatt. CrpoHtt31{aT, MocKBa, 35 1 c. (in Russian).
[3] flerpocoa, B.A., 1 998 . . Bonoctta6)1(etttte r. XapKOBa. KopTeJJb, XapbKOB, 40 c. (in Russian).
(4] Neil S. Grigg, 1996. Water Resource Management. Principles, Regulations and Cases. McGraw-Hill, New York, 540 p.
[5] David J. Blackwood, 2002. Environmental Hazards and Risk Assessment. Kharkiv, Ukraine, 70 p.
[6] KarraHHHa, 0.11., Kanatttttta, I0.11., CyxopyKoB, r.A., 2002. Pa3pa6oTKa tt rrpttMettetttte 6anaHCOB TIOTOKOB Bel.l.{eCTB ]:{Jill TeXHOreHHblX H npttponHblX o6beKTOB. TTpo6neMH oxopoHtt ttaBKOJJHIIIHhOro npttponttoro cepenoam.ua Ta Texttorettttoi' 6e3rreKtt: 36.ttayK.npaub YKpH,l]JETT,X. 2 13 c. (in Russian).