Kalmar ECO-TECH '07
KALMAR, SWEDEN, November 26-28, 2007
QUALITY INDEXES OF GROUND WATER AT
ZMIEV DISTRICT OF KHARKIV REGION
0. Sierikova
V. Yakovlev
Kharkiv National Academy of Municipale Economy, Ukraine
ABSTRACTThis study investigates the ground water quality at Zmiev district of Kharkiv Region. The result shows that 97% of cases the water in wells doesn't meet the requirements of the quality standards for sanitary and chemical indices. The most actual indices of non-correspondence of quality are: hardness, solid residual, iron, manganese, sulfates, chlorides, nitrates, and oxidation characteristic. The necessity of use of more strict approach to decentralized water sources while evaluation of the drinking qualities is grounded.
KEYWORDS
Ground water; Quality standards, Well; Sanitary indices, Chemical indices. 1 INTRODUCTION
The Zmiev district of Kharkiv Region is known for its quality surface water resources. However, the surface water quality is gradually deteriorating. In spite of the urban and village population growth, 65% of water supply is taken from the wells, i.e. at the expense of the first layer from the elevation of water -the ground waters.
Generally, underground waters are characterized by a relatively high level of stability of physical-chemical and bacteriological indices of the quality in comparison with surface water. That is why minor treatment of purification and disinfection is needed. But, the quality of ground water may change negatively under the influence of natural and anthropogenic factors. The aim of this study is to determine the present situation of ground water quality at Zmiev district of Kharkiv region which was used as the source of decentralized water supply of the population (for drinking and economic purpose).
2 DISCUSSIONS
The decentralized water supply of Zmiev district is provided with the help of common and private wells and the regular analysis of water quality is conducted only in common wells. Today the Sanitary Drinking Standard 1226-75 "The maintenance of cappings and wells" is used, and it regulates such quality indices as total microbe number, taste, smell, color of
Kalmar ECO-TECH '07 KALMAR. SWEDEN. November 26-28. 2007
possible to give a many-sided characteristics of the quality of drinking water are represented in Table 1.
Table 1. Present standards of the quality of drinking water.
Indices Unit
measure State Standards
Standards 2874-82 (Drinking water) State Sanitary Drinking Standards 136/1940 (#383) World Health Organization (WHO) Sanitary Drinking Standards #1226-75 Sanitary Drinking Standards of Russian Federation 2. 1.4. I 074-0 I
Organoleptic indices
Smell mark 2 2 Should be Not >2-3 2
Taste and mark 2 2 good Not >2-3 2
odor
Color degrees 20 20(35) 15 Not >30 20(25)
Turbidity mg/dm3 1.5 0.5( I 5) 2.0 Not>2 2.6(3.5) Toxicolordc indices Aluminum mg/dm 0.5 0.2(0.5) 0.2
-
0.5 Barium mg/dm'-
0.1 0.7-
0.1 Beryllium mg/dm' 2-10·4-
-
-
2·10 4 Boron mg/dm'-
0.6 0.3-
0.5 Bromine mg/dm' 0.2 Molybdenum mg/dm' 0.25-
0.07 - 0.25 Arsenic mg/dm-' 0.01 0.01 0.01-
0.05 Nickel mg/dm'-
0.1 0.02 - 0.1 Mercury Lead mg/dm 3 mg/dm'-0.03
-0.01 0.01 10·-'
-
5·10 4 0.03 Selenium mg/dm' 0.001 0.01 0.01-
0.01 Strontium mg/dm' 7.0-
-
-
7.0 Fluorine mg/dm· 0.7-1.5 0.7-1.5 1.5 - 1.5 Chrome mg/dm'-
-
0.05 - 0.05 Phenols mg/dm-'-
-
-
- 0.25Indices influencinK the or:sanoleotic characteristics of water
pH value Solid residue mg/dmpH 3 6.0-9.0 1000 6.5-8.5 1000 (1500)
-
--
6.0-9.0 General rigidity Mg-eq/dm3 1.5-7.0 7.0 ( 10)-
-
7.0(10) Oil products mg/dm' - --
-
0.1 Surface-active substance mg/dm 3-
-
-
-
0.5Kalmar ECO-TECH ·07 KALMAR. SWEDEN, November 26-28, 2007 Table J, Present standards ofthe quality of drinking water (Cont)
General mg/dm' 1000 1000 1000 mineralization ( 1500) Iron mg/dm 0.3 0.3 0.3 Manganese mg/dm 0.01 0.1 0.01 Copper mg/dm' I I I
-Indices Unit Standards
measure State State World Sanitary
Standards Sanitary Health Drinking 2874-82 Drinking Organization Standards (Drinking Standards (WHO) # 1226-75
water) 136/1940 (#383) Organoleptic indices Sulphates mg/dnl" 500 250(500) 250
-Cloride mg/dm' 350 250(350) 250 -Zinc mg/dm-' 5.0
-
3.0-Nitrate mg/dm-' 45 45 50 Not >45 nitrogen Nitrite mg/dm'
-
- 3-nitrogen Potassium mg/dm-'
-
-
-
-Calcium mg/dm'-
- - -Magnesium mg/dm3-
10-80-
-General Mg--
0.5-6.5-
-alkalinity eq/dm3Chemical substances £enerated in the process o(water processin£
Residual mg/dm-' 0.3-0.5 0.3-0.5 0.6-0.1
-chlorine Residual mg/dm-' 0.1-0,3 0.1-0,3 0.1-0.3
-ozone Polyacrylami mg/dm·' 2.0
-
1.0-de Polyphosphat mg/dm3 3.5
-
-
-es Integral indices I 000(1500) 0.3(1) 0. I (0.05) I Sanitary Drinking Standards of Russian Federation 2. I A 1074-01 350 350 5.0 45 3
-03-0.5 0.3 2.0 3.5 / Oxidability mgO,/dm 4.0
-
-
-
5.0 J I I Toxicity %-
Not >50-
-
-i -index Microbiolo£ical indices
Kalmar ECO-TECH '07
KALMAR, SWEDEN, November 26-28, 2007
that exceed the index of POK in accordance with data of geological service are represented in
Table 2.
Table 2. Quality indices of the ground waters from the wells of Zmiev district.
# Place of sampling and the address mg/dPb
J m Solid residue mg/dm3 General rigidity mg-eQ/dm3 Fe, mg/d 3 m Mn, mg/d J m NO3, mg/d J m Oxidability mg/O2/dm3 Estimati on of quality State Sanitary Drinking Standard "Drinking water" 0,0 1 1000 1.5-7 0.3 0. 1 45 4 Limiting characteristic of harmfulness and dangerosity class s-t 2 g, 4 org. 4 org. 3 org, 3 s-t, 3 I v. Borki 0 495 5. 1 1 0 0 59.2 2.24
-2 v, Pogoreloe 0.0 1 179 1 23,5 0 0 490 4.5
-3 v, Kravtsovo 0,0 1 446 4.4 0 0 70.4 14.4
-4 v, Timchenki 0 963 9. 1 0,7 2.2 0.76 9, 12
-5 v, Trosnoe 0,0 1 736 10,7 0 0. 13 40 4.96
-6 v, Kuklyvka 0.0 1 1205 16,8 0 0 422.9 4,2
-7 v, Jupe 0 535 7,3 0,7 0 88 3.6
-8 v, Krasna Polyana 0.02 1 170 13,8 0,5 0 220 1.9
-9 v, Vodyanoe 0 1092 1 1.5 0,65 0 3 10 12
-10 v, Ch. Bishkin 0 345 2.76 0,65 0 130. 1 3.2 -II v, Gineevka 0 1285 6.3 1 0 0 48 10,I
-12 v, N, Bishkin 0 1260 17,53 0 0 200 5, 12
-13 v, Liman 0 1322 17.3 0,8 0 58 8
-14 v. Zadonetskoe 0 20 1 1,57 1,5 0 19,7 3,2
-15 v, Omelchenki 0 58 1 6,7 0,5 0 130 7,2
-16 v, Liman 0 740 10,I 0.3 0 7,2 2.5
-17 v, Liman 0,06 256 3,8 2,8 0.22 0,85 4,2
-18 v. Liman 0 15 17 10,8 0 0 53 10,2
-19 v, Liman 0 1762 16,I 0.3 0 324 16
-20 v. Liman 0 1386 8,7 0,5 0 159 9,4
-2 1 v. Konstantinovka 0,04 473 7, 1 0,5 0 22.3 L7
-22 v, Borovaya 0 147 1 14,9 0 0.49 14 12
-23 v. Skripai 0,0 1 759 8,9 0,2 0 15,7 3,2
-24 v, Sheludkovka 0.0 1 1706 20 0.2 0 395 7,7
-25 v, Gineevka 0,0 1 490 7 0 0 18,9 2,4 + 26 Zanki station 0,0 1 1 100 1 1.2 0.3 0 15 6,6
-27 v. Artuhovka 0,06 459 5.4 0,8 0. 15 2,3 24.2
-28 v, Chemuzhovka 0,02 558 4.9 0.3 0 II 20.3
-29 v. Vovyahovka 0,02 2 123 3 1. 1 0 0, 15 284 5.2
-30 s, Donets 0,07 902 13.4 0 0 79 3,2
-Kalmar ECO-TECH '07
KALMAR, SWEDEN, November 26-28, 2007
Table 2. Quality indices of the ground waters from the wells of Zmiev district.(cont)
31 v. Blagodatnoe 0.02 3138 30.3 0 0 735 7
-32 v. Pasiki 0.07 976 16.2 0 0 71.25 1.9
-33 v. Bespalovka 0.05 1128 16.4 0 0 40.2 1.6
-34 v. Bespalovka, Chaikovskovo Street I 0.05 3638 49.4 0 0 547.5 5.8
-35 v. Taranovka 0.06 864 14.7 0 0 67.3 2.6
-36 v. Sokolovo 0.01 964 15.2 0 0 179.8 1.28
-Average value 0.03 1106.58 3 13.055 0.6 6 0.55 666 7 148.03 78 6.742222
-% of samplings, not corresponding to the standards 33 47 72.22 33. 33 16.6 7 69.44 63.89 97.2
2 -highly harniful; 3-harmful; 4-reasonably harmful; +-the water is good in accordance with indices listed above; --the water is not good.
In connection with insufficient data, the data quality analysis of water from wells is obtained from Kharkiv Research Institute of Ecological Problems and by sanitary-epidemiological station of Zmiev district during the period of 1986-2005.
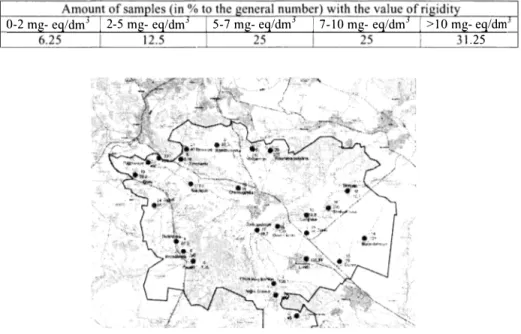
Some quality indices of water from wells were charted on the map of Zmiev district. The indices of general rigidity (Figure 1) and nitrates content (Figure 2) turned to be considerably contrast in the area. These are the main indices that characterize the water quality.
Kalmar ECO-TECH '07 KALMAR, SWEDEN, November 26-28, 2007
The data of the level of general rigidity are represented in Table 3. From all sampling there are 56% of samples that exceed maximum permissible rigidity (7 mg- eq/dm3).
Table 3 Distribution of water samples from the wells of Zmiev district with different indices of rigidity
0-2 mg- eq/dm' I 2-5 mg- eq/dm' I 5-7 mg- eq/dm' I 7-10 mg- eq/dm' I >IO mg- eq/dm .25
Figure 2. Nitrate content in subterranean waters of Zmiev district in Kharkiv region. The upper value signifies the well number, the lower one - nitrate content, in mg/dm3 in the given
well.
The data about nitrates content are represented in Table 4.
Table 4. Distribution of water samples from the wells of Zmiev district with different indices of nitrates content.
Amount of samples (in % to the general number) with nitrates content 0-10 m
8 dm' 10-45 m dm' 27 45-90 m /dm' 19 90- 180 m /dm' 15 > 180 mg/dm 31 Maximum permissible nitrates content (45 mg/dm3) is exceeded in 65% of cases, and the maximum value reaches 490-735 mg/dm3
Kalmar ECO-TECH '07
KALMAR, SWEDEN, November 26-28, 2007 3 CONCLUSIONS
I. According to the data of Geological Survey the 97% water of domestic wells of Zmiev district in Kharkiv region does not correspond to the standards of drinking water of centralized systems. The inconsistency with the sanitary standards of water quality is observed in the following indices: general rigidity - 72.2% of samples; nitrates content - 63.9%; oxidability - 6 1. 1 %; solid residue - 44.4%; dissolved iron - 33.3%; lead content - 22.2%; manganese content - 16. 7%.
2. In comparison with the quality standards which are applied to the centralized water supply sources (State Standards 2874-82 and State Sanitary Drinking Standards) for the sources of decentralized water supply at the actual time (State Sanitary Drinking Standards 1226-75 "Wells and capping content") an extremely poor listing of standards is applied which can be viewed as a restraint in the right of villagers to drink the drinking water of quality.
For objective evaluation of the quality of ground waters it is necessary to elaborate more rigid standards than the Sanitary Drinking Standards 1226-75. Before such standards are elaborated the most convenient normative document for practical usage in the evaluation of the water quality of decentralized water supply will be State Sanitary Drinking Standards # 383 "Drinking water. The hygienic requirements for the water quality of centralized household drinking water supply," as it includes integral quality index - toxicity index.
REFERENCES
[I] Data of areal inspections of wells of Zmiev district in Kharkiv region by Geological Survey for the period of 1985-2005.
[2] The data of monitoring the subterranean water quality in the affected zone of Thermo electric Power Station (National Research Institute of Ecological Problems) for the period of 1993-2006.
[3] The data of monitoring water quality in wells of Zmiev district in Kharkiv region of 1986.
[4] State Standards 2874-82. "Drinking water. Hygienic requirements and quality control."Moscow 1983. 1 1 pages.
[5] Yakovlev, V.V .. , Sokolov, Yu.P.,.Mirka, G.E., 1994. Geological ecological research of industrial municipal agglomeration of Kharkiv, Kharkiv.
[6] State Sanitary Drinking Standards #383 "Drinking water. The hygienic requirements for he water quality of centralized household drinking water supply".
[7] Sanitary Drinking Standards of Russian Federation 2. 1.4. 1074-0 1 (Drinking water. The hygienic requirements for the water quality of centralized household drinking water supply. Quality control).
[8] Sanitary Drinking Standards 1226-75 (Capping and wells content). [9] Quality standards of drinking water of the World Health Organization.