Technical Report
Agricultural Experiment Station Cooperative Extension2001
RESEARCH
REPORTS
Arkansas Valley Research CenterTR02-8
August 2002AIlIiANSAS VALLEY RESEARCH CIWmR
Lt.WI h . . . J.88II
Frank C. Schweissing Michael E. Bartolo Marvin A. Wallace Kevin J. Tanabe
Arkansas Valley Research Center Rocky Ford, Colorado
Staff (719) 254-6312
Cooperators Joe Brummer, Bureau of Reclamation
Superintendent-Entomologist Vegetable Crops Scientist
Farm Technician Research Associate
Jessica Davis, C.S.V., Ext. Soil Specialist, Department of Soil and Crop Sciences
Orren Doss, Graduate Research Assistant, C. S. V., Department of Soil and Crop Sciences
Tim Damato, Res. Associate, C.S.V., Department ofBioagricultural Sciences and Pest Management
Jim Hain, Res. Associate, C.S.V., Department of Soil and Crop Sciences
Ardell Halvorson, Soil Scientist, VSDA-ARS
Jerry Johnson, Crop Scientist, C.S.D., Department of Soil and Crop Sciences
Kevin Larson, Crop Scientist, C. S. D., Plainsman Research Center and Dept. of Soil & Crop Sciences
Scott Nissen, Weed Scientist, C.S.V., Department ofBioagricultural Sciences and Pest Management
Curtis Reule, Soil Scientist, VSDA-ARS
Howard Schwartz, Plant Pathologist, C.S.V., Dept. ofBioagricultural Sciences and Pest Management
Jim Valliant, Irrigation Specialist, Rocky Ford, Cooperative Extension
Philip Westra, Weed Scientist, C.S.D., Department ofBioagricultural Sciences and Pest Management
S. Lee Gray, Head
Colorado State University Fort Collins, Colorado Agricultural Experiment Station
Administration
Lee E. Sommers
Director, Agricultural Experiment Station 491-5371
Department of Agricultural and Resource Economics 491-6325
J. Daryl Tatum, Head
Department of Animal Sciences 491-6672
Thomas O. Holtzer, Head
Department ofBioagricultural Sciences and Pest Management 491-5261
Stephen J. Wallner, Head
Department of Horticulture & Landscape Architecture 491-7019
James S. Quick, Head
Department of Soil and Crop Sciences 491-6517
County Bent Crowley El Paso Huerfano Las Animas Otero Prowers Pueblo *Research Bent Crowley El Paso Huerfano Las Animas Otero Prowers Pueblo NIlCS Tem Expires 2002 2003 2004 2002 2003 2004 2002 2003 2004 2002 2003 2004 2002 2003 2004 Vice Chm. 2002 Chaiman 2003 2004 2002 2003 2004 2002 2003 2004 Committee Member Secretary
2002 Advisory Council Members ARKANSAS VALLEY RESEARCH CEN'rER
ROCKY FORD, COLORADO
Naw and !,Mrnss
Bill Elder, 13500 Hwy. 50, Las Animas, CO 81054
*K±m Siefkas, 32470 Cty. Rd. 10, Las Animas, CO 81054 Ed Blackburn, 6619 Hwy. 194, Las Animas, CO 81054
*John Tomky, 4413 Lane 8.5, Olney Sps., CO 81062 Matt Heimerich, 5325 Ln. 9 1/2, Olney Sps., CO 81062 Dean Rusher, 7995 Co. Ln. 10, Olney Sps., CO 81062
Jay Frost, 18350 Hanover Rd., Pueblo, CO 81008 Glen Ermal, 10465 REA Road, Fountain, CO 80817
*TOby Wells, 11120 Old Pueblo Road, Fountain, CO 80817
Art Winter, 20110 CIt 75.0, Trinidad, CO 81082 Allen Nicol, Box 63, Hoehne, CO 81046
*Paul E. Philpott, Box 3, Hoehne, CO 81046
RObert Gerler, 25320 Road BB, La Junta, CO 81050 Hans Hansen, 36606 Road JJ, La Junta, CO 81050
*Dennis Caldwell, 25026 Road 19, Rocky Ford, CO 81067
*RObert Jensen, 23485 Co. Rd. GG.5, Granada, CO 81041 Leonard Rink, 21971 Hwy. 196, Bristol, CO 81028
J~ Ellenberger, 36101 Rd. 11 1/2, Lamar, CO 81052
*RObert Wiley, 52699 Olson Rd., Boone, CO 81025 Clay Fitzsimmons, 36038 So. Rd., Pueblo, CO 81006 Dan Genova, 33200 South Rd, Pueblo, CO 81006
Extension Agepts
John King, Fair Grounds, Las Animas, CO 81054 Bill Hancock, Courthouse Annex, Ordway, CO 81063 Jonathan Vrabec, 305 S. Union, CO. Sps., CO 80910
, 401 Main, Suite 101, Walsenburg, CO 81089 Dean Oatman, 200 E. 1st, Rm. 101, Trinidad, CO 81082
Bill Hancock, Box 190, Rocky Ford, CO 81067
T~ Macklin, 1001 S. Main, Lamar, CO 81052 Frank Sobolik, Courthouse, Pueblo, CO 81003
John Knapp, 29563 Road 18, Rocky Ford, CO 81067 Lorenz Sutherland, 318 Lacy, La Junta, CO 81050
2001 Climatic Conditions Arkansas Valley Research Center
Colorado State University Rocky Ford, Colorado
Frank C. Schweissing, Superintendent
The annual precipitation of 11.99" was somewhat greater than the long term average (101 yrs.) Of 11.86". The major part of the year's precipitation came in the first seven months (10.08") mostly from May through July. The last five months had a total of 1.91" of precipitation. The irrigation ditches carried an adequate supply of water through the season, crop production was good, disease problems were greatly reduced and field work and fall harvest was carried out without interruption. The frost free period of 165 days between April 24 and October 6 was 7 days longer than average. Based on a nominal growing season of May 1 to September 30, there were 3081 com growing degree days which is above normal.
2001 Frost Dates 2001 Average Frost Dates* Average*
Frost Free Frost Free
Last Spring First Fall Period Last Spring First Fall Period
Frost Frost (days) Frost Frost (days)
April 24 - 31°F Oct. 6 - 27°F 165 May 1 October 6 158
,---Month Temperature(FO) PreCipitation Snowfall 10 Year Precip.
---,--,---High Low Avg.
Jan. 72 -8 28.7 Feb 67
-4
34.3 March 76 17 43.2 April 88 26 56.7 May94
33 62.6 June 100 41 73.9 July 105 55 80.3 Aug. 102 49 76.5 Sept. 95 36 68.1 Oct. 91 23 55.9 Nov. 79 8 44.6 Dec. 69-4
33.3 2001 Normal* inches 0.68 0.26 0.26 0.29 0.34 0.68 0.91 1.32 3.77 1.85 2.21 1.40 1.91 2.00 0.27 1.57 0.52 0.91 0.02 0.79 0.68 0.47 0.42 0.32 Total inches 15.1 3.2 2.5 1.0 0.5 7.5 1992 1993 1994 1995 1996 1997 1998 1999 2000 2001 Average Inches 12.33 11.36 11.42 12.64 13.38 18.58 14.62 19.96 9.60 11.99 13.59 ---Total 11.99 11.86 29.8 *Average -101 years ivTABLE OF CONTENTS
FIELD CROPS
Alfalfa-Variety Trials ... I
Alfalfa Weevil-Chemical Control ... 5
Bean-Pinto Variety Trial ... 8
Corn-Grain & Silage Variety Trial ... 11
Com-Nitrogen Management ... 14
Com-Tillage ... 19
Com-Pam Application . . . 24
Com-Banks Grass Mite . . . 26
Com-Southwestern Com Borer ... 29
Com-Weed Management ... 34
Sorghum-Forage Variety Trial ... 37
Sorghum-Greenbug Management ... 39 Soybean-Variety Trial ... 42 Salinity Study . . . 44
VEGETABLE CROPS
Onion-Variety Trial ... 48 Onion-Fertility Trial ... 51 Onion-Disease Management ... 53 Onion-Weed Management ... 62This research is partially supported by the Arkansas Valley Onion Growers Ass'n. Cabbage-Insect Management . . . 64
Cantaloupe-Early Production ... 67
Hyrid Chile Establishment Trial ... 70
Jalapeno Establishment Trial ... 73
Bell Pepper Production Trial ... 75
Mira Sol Chile Trial ... 77
Spinach-Hail Simulation ... 79
Sweet Com-Variety Trial ... 81
Tomato-Spacing Trial ... 83
Watermelon-Establishment Trial . . . 85
Zinnia-Stand Loss . . . 87
2002 -RESEARCH PLOTS ... 90
Compiled by Frank C. Schweissing
NOTICE
This publicatioo is a compilatioo of reports dealing with research carried out at the Arkansas Valley Research Center. Trade names have been used to simplify reporting, but mention of a product does not constitute a recommendation nor an endorsement by Colorado State University or the Colorado Agricultural Experiment Station. In particular, pesticides mentioned in various reports may not be registered for public use. Pesticides are to be used only in accordance with the manufacturers' label.
2001 Alfalfa Variety Performance Trial Report
Location:
Stand Established:
Investigator:
Arkansas Valley Research Center Rocky Ford, Colorado 81067
1997
Frank C. Schweissing, Superintendent
This is a report of the results of an irrigated alfalfa variety trial, planted August 29, 1997, after 4 years of production. There are 25 commercial and 3 public varieties included in this test.
The trial was set up in a randomized complete block, with four replications (1 plot = 75 sq. ft.). The trial was managed to reduce factors which limit production. The plot area was fertilized with 1501bs. ofPz Os per acre prior to planting and again on November 30, 1998. Sencor 75DF .50 lbs.
+
Gramoxone .31Ibs. were applied on February 16, 1999, February 22,2000 and at .75 lbs.+
.47Ibs. AIlAcre respectively on March 9,2001. Furadan 4F at .75 lbs. AIlAcre was applied on April 21, 1999 and at 1.0 AIlAcre on April 25, 2000 and at.s
lbs. AIlAcre on May 13,2001 for alfalfa weevil control.Harvest dates in 2001 were May 31, July 3, August 9 and October 3. Rainfall from April through September was 9.5 inches compared to a long term average of 9 inches. Growing degree days were above normal. The trial was irrigated prior to the first cutting and after each of the four cuttings. All four cuttings were harvested without significant rain damage. The average trial yield was 4.43 tons, compared to 5.84 tons in 2000,6.35 tons in 1999 and 5.36 tons in 1998.
Significant differences in yield were observed for all cuttings and total yield.
Yields are reported in oven-dry weights. If you want to determine yields with a particular percent moisture, divide dry yield by 1.00 minus the percent moisture you usually sell your hay. Example: (Yield/l.00-.IO)
=
yield with 10% moisture or 4.43/.90=
4.92 tons.Decisions as to variety selection in addition to being based on highest yields should include consideration of those varieties which are doing better after 4 years of harvest.
Forage yields of 28 alfalfa varieties at the Arkansas Valley Research Center, Rocky Ford, Colorado from 1998-2001. Variety WL334RK 3LI04* Leaf Master Millennia DK 143 Pinnacle CirnarrCOl 3i ZX 9352* 5454 Depend+EV Brand/Source W -L Research Novartis Union Seed Co. UniCOl Seed Co. DeKalb Genetics Corp. Arkansas Valley Seed Great Plains Research ABI Alfalfa
Pioneer Hi-Bred Int'1 Agripro Seeds Inc. Big Hom Cargill Hybrid Seeds TMF Muhiplier II Mycogen Seeds DK142 DeKalb Genetics Corp. Lahontan USDA-NY Archer WL324 WL325HQ ZC 9651* 631 America's Alfalfas Germain's Germain's ABI Alfalfa Garst Seed Co.
1st 2nd 3rd 4th
Cut Cut Cut Cut 2001 2000 1999 1998 4 Yr. 5/31 7/3 8/9 10/3 Total Total Total Total Total
---TCOlS dU)r~r/acrel---1.44 1.02 1.08 1.27 4.81 6.65 7.03 5.86 24.35 1.57 1.10 1.17 1.11 4.95 6.43 6.59 5.57 23.54 1.61 1.11 1.09 1.17 4.98 6.44 6.73 5.24 23.39 1.49 1.14 1.39 1.11 1.57 1.12 1.32 0.91 1.32 1.06 1.31 1.02 1.33 1.02 1.41 0.95 1.52 0.93 1.40 0.95 1.44 1.18 1.39 1.01 1.37 0.93 1.43 1.10 1.09 1.12 1.02 1.13 1.03 1.12 0.93 1.09 1.07 1.22 1.11 1.16 0.96 1.07 0.98 1.13 0.94 1.05 1.01 1.12 1.18 1.16 1.04 1.25 0.97 1.01 1.04 1.07 4.84 4.65 4.84 4.25 4.67 4.60 4.38 4.47 4.44 4.48 4.96 4.69 4.28 4.64 6.36 6.64. 5.48 6.34 6.52 5.67 6.36 6.48 5.35 6.24 6.62 5.54 5.81 6.55 5.46 5.86 6.49 5.43 5.74 6.63 5.60 5.94 6.48 6.00 6.40 5.95 6.47 6.08 6.06 5.87 6.29 5.54 6.52 6.12 6.01 5.41 5.44 5.34 5.13 5.24 5.74 5.25 23.32 23.18 23.03 22.65 22.49 22.38 22.35 22.30 22.28 22.24 22.23 22.09 22.08 22.02 1.27 0.96 1.02 1.15 4.40 5.66 6.39 5.56 22.01 1.21 0.94 1.02 1.04 4.21 5.69 6.60 5.38 21.88 Innovator + Z 6L271* America's Alfalfas 1.41 0.99 1.00 1.06 1.02 1.23 0.95 0.94 0.97 1.03 0.90 0.98 0.96 1.04 0.98 0.99 4.46 4.58 4.13 4.20 4.02 4.31 4.14 5.68 6.27 5.43 5.74 6.11 5.07 5.74 6.29 5.24 5.64 6.19 5.34 5.44 6.44 5.44 5.46 6.24 5.29 5.46 6.01 5.30 21.84 21.50 21.40 21.37 21.34 21.30 20.91 DK 127 630
Arkansas Valley Seed 1.35 0.98 DeKalb Genetics Corp. 1.32 0.92 Garst Seed Co. 1.22 0.98 America's Alfalfas
Great Plains Research ABI Alfalfa 1.24 0.90 1.40 0.91 1.22 0.95 Affinity + Z Haygrazer ZC 9650* Ranger Vernal USDA-NE 1.07 0.83 0.88 0.93 3.71 4.83 5.25 4.71 18.50 Column Mean LSD (0.05) CV(%) USDA-WI
1 Yields calculated on oven~ basis. Planted August 29, 1997 0.91 0.59 0.73 0.78 3.01 4.49 5.39 4.51 17.40 1.35 0.99 0.17 0.13 9.05 9.49 1.00 1.09 0.10 0.14 7.23 9.20 *Indicates experimental entry.
2 4.43 0.46 7.44 5.84 6.35 5.36 0.48 0.42 0.31 5.90 4.72 4.12 21.98 1.17 3.77
2001 Alfalfa Variety Performance Trial Report
Location:
Stand Established:
Investigator:
Arkansas Valley Research Center Rocky Ford, Colorado 81067
2000
Frank C. Schweissing, Superintendent
This is a report of the results of an irrigated alfalfa variety trial, planted September 1, 2000, after one year of production. There are 22 commercial and 2 public varieties included in this test.
The trial was set up as a randomized complete block, with four replications (1 plot = 75 sq. ft.). The trial was managed to reduce factors which limit production. The plot area was fertilized with 100 lbs. ofP2 Os
+
21 lbs. OfN per acre prior to planting. A frost (28'P) on September 25,2000 tended to set stand establishment back somewhat. Pesticides have not been used to date.Harvest dates in 2001 were May 31, July 3, August 9 and October 2. Rainfall from April through September was 9.5 inches compared to a long term average of9 inches. The trial was irrigated 3 times after planting in the fall, once prior to the first cutting and once after each cutting. All four cuttings were harvested without appreciable rain damage. The irrigation prior to the 2nd cutting was inadequately applied and resulted in lower yields. The trial at the end of the season appeared to be well established and the earlier problems overcome. The average trial yield was 4.95 tons per acre.
Yields are reported in oven-dry weights. If you want to determine yields with a particular percent moisture, divide dry yield by l.00 minus the percent moisture you usually sell your hay. Example: (Yield/l.OO-.IO) = yield with 10% moisture or 4.95/.90 = 5.5 tons per acre.
Decision as to value of a particular variety for production in our area should not be based on one year's result.
Forage yields of 24 alfalfa varieties in the irrigated trial at the Arkansas Valley Research Center, Rocky Ford, Colorado in 2001.
1st 2nd 3rd 4th
Cut Cut Cut Cut 2001
Variety Brand/Source 5/31 7/3 8/9 10/2 Total
---TCOls
~rnatter/Jlcrel---Arapaho Dairyland Research 1.64 1.21 1.24 1.43 5.52
ZX9450Jl* )lSI Nfalfa, Inc. l.47 1.15 l.18 l.40 5.20
Target Plus Producers Hybrids l.47 l.15 l.15 1.40 5.17
ArrowHead Dairyland Research l.42 1.15 1.26 1.32 5.15
FG6M71* Forage Genetics Int'I. 1.32 1.17 1.25 1.36 5.10
Emperor America's Nfalfas l.45 1.18 1.14 1.32 5.09
ZG 9650Jl )lSI Nfalfa, Inc. 1.28 1.12 l.20 l.47 5.07
Winter Crown Dairyland Research l.36 1.13 l.22 l.35 5.06
Jlbilene+ Z America's Nfalfas l.33 1.l6 l.20 l.37 5.06
Dagger+EV AgriPro 1.33 1.20 1.14 l.36 5.03
53V08 PiCOleer Hi-Bred Int'I. 1.35 1.21 l.16 l.30 5.02
54Q53 PiCOleer Hi-Bred Int'I. 1.35 1.09 l.16 l.31 4.91
FG5M84* Forage Genetics Int'I. 1.30 1.08 1.l9 1.33 4.90
Magnum V-Wet Dairyland Research l.22 1.13 l.17 l.38 4.90
LahCOltan USDJl-NV 1.30 1.14 l.18 l.25 4.87
Ranger USDJl-NE 1.31 1.14 1.13 1.25 4.83
4200 kkansas Valley Seed 1.37 1.08 l.10 l.24 4.79
Geneva Novartis l.30 1.10 l.12 l.26 4.78
ZC 9941Jl* )lSI Nfalfa, Inc. l.25 1.14 1.11 1.27 4.77
Samurai America's Nfalfas 1.26 1.12 1.08 1.28 4.74
ZX9853 )lSI Nfalfa, Inc. l.24 1.03 1.14 l.30 4.71
Jl30-06 )lSI Nfalfa, Inc. 1.25 1.17 l.10 l.18 4.70
Baralfa 42IG Barenbrug U .S.k l.31 1.07 l.09 l.23 4.70
FG 3R139* Forage Genetics Int'I. 1.26 1.07 l.10 l.24 4.67
ColunmMean 1.34 1.13 l.16 1.32 4.95
LSD (0.05) 0.13 ns 0.10 0.10 0.33
CV(%) 6.92 6.39 6.17 5.53 4.71
lYields calculated on oven~ basis. *Indicates experimental entry Planted: September 1,2000
Chemical Control of the Alfalfa Weevil- 2001 Arkansas Valley Research Center
Colorado State University Rocky Ford, Colorado
September 2000 through April 2001 was somewhat drier(4.37") than the 100 year average (5.06") precipitation. This was followed by substantially higher precipitation in May (3.77") compared to the 1 00 year average of 1.83". Weevil populations were above the nominal economic injury level of 20 per sweep in the untreated plots and at the first cutting damage was very visible. Pea aphid populations were low.
Methods and Materials -Supporting information relating to the test plots is given below. All insecticide treatments were applied April 30, 2001, at the time the plants were about 18" tall, with a compressed air sprayer mounted on bicycle wheels. Chemicals were applied at the rate of 25 g.p.a. at a pressure of 27 p.s.i. using 11002 flat fan nozzles.
Alfalfa weevil populations were determined by using a 15" sweep net covering a 180 degree arc. Two separate sweeps were taken in each plot per sampling date. This constitutes 6 sweep counts per treatment from 3 replications. Pea aphid counts were also obtained.
Forage yields were obtained from a 10' X 2.5' area in each of the three replications for the Furadan and untreated plots.
Results and Discussion -All insecticides reduced the larval populations well below the untreated plots. Visible damage was apparent at harvest time and the difference in oven-dry yield between treated (Furadan) and untreated plots was the equivalent of2.18 tons/acre and 1.74 tons/acre respectively. Relative Feed Value (RFV) was 175.9 (treated) and 158.6 (untreated). Pea aphids were not a factor.
Frank Schweissing
Test Plot Information - 2001
Purpose - To evaluate the effectiveness of selected insecticides for control of the alfalfa weevil,
Hypera postica
(Gyll.) on alfalfa.Data - I. Sweep Counts
2. Forage Yield - 1 treatment vs untreated
Plots - 39.6' XII'
=
435.6 sq. ft.=
100th acre Yield - 10' X 2.5=
25 sq. ft.=
1/1742.4 acre Design - Randomized complete block (3 replications)Variety - Tahoe - 3ed year
Fertilizer - 150 lbs. P20S
+
31.7 lbs. N as 11-52-00/acre - 11/30/98, 11/7/00. Herbicide - Sencor 75 DF .75bs. + Gramoxone Extra .47lbs AIlacre - 3/9/01Soil- silty clay loam, 1 - 1.5% o.m., pH ca. 7.8
Plant - March 1, 1999
Irrigation - in 2001 - 3/27
Treated -April 30, 2001- Compressed air bicycle sprayer - 27 p.s.i. 25 g.p.a. - FF 11002 nozzle
Frank C. Schweissing
Table I.-Chemical control of the alfalfa weevil on alfalfa. Sweep counts. Arkansas Valley Research Center, C.S.U., Rocky Ford, Colorado. 2001.
Treatmentl AJ2 Alfalfa Weevil3 Pea Aphid3
Larvae Adults 5/7 5114 5/23 5/7 5114 5/23 5/7 5/14 5/23 Warrior lCS .03 0.00 0.00 0.67 0.50 1.00 1.17 0.00 0.17 0.67 Baythroid 2E .035 0.33 0.67 0.17 0.00 0.83 1.33 0.00 0.00 2.50 + Pounce 3.2E .05 Baythroid 2E .035 0.17 0.17 1.67 0.00 0.83 1.83 0.00 1.17 3.50 F0570 0.8EW .016 0.00 1.17 2.17 0.17 0.67 2.17 0.00 0.33 6.50 Steward 1.25SC .11 0.00 2.00 4.80 0.00 0.17 0.33 0.50 1.83 7.00 Lorsban 4E .50 0.00 1.17 5.83 0.17 0.17 0.33 0.00 0.50 3.33 Furadan 4F .50 0.00 2.00 6.83 0.00 0.33 0.00 0.50 1.17 5.33 Pounce 3.2E .20 1.83 6.83 5.00 0.00 0.17 0.83 0.00 0.17 0.50 LannateLV 2.4WS .90 0.67 6.17 11.67 0.00 0.33 0.83 0.00 0.67 5.17 SevinXLR 4F 1.00 2.67 9.33 13.50 0.00 0.17 0.17 0.33 2.00 5.17 Untreated 25.33 29.67 27.33 0.17 0.17 0.17 1.00 5.67 5.50
1 - Treated - April 30, 2001 Selwet L-77 at 8 ozlacre
2 - Active ingredient per acre
3 - Average number per sweep, 2 separate sweeps per plot, 3 replications.
Insecticides are to be used in accordance with manufacturer's label.
2001 Pinto Bean Trials Arkansas Valley Research Center
This is the twelfth year a variety trial has been carried out at this Center in recent years. The overall trial yield average was very good with several of the top varieties producing excellent yields. This years trial average was 3020 lbs./acre compared to 3664lbs./acre in 2000, 2749lbs./acre in 1999, 2134Ibs./acre in 1998, 2461lbs./acre in 1997, 3419lbs./acre in 1996, 15991bs./acre in 1995,3129 Ibs./acre in 1994,3760 lbs./acre in 1993,2541 lbs./acre in 1992,2361 lbs./acre in 1991 and 2848 lbs./acre in 1990 ..
Precipitation for the year was 11.99", somewhat above average. Irrigation water was available through the season. Rust was not a problem.
Test Plot Information
Purpose - To evaluate the inherent genetic ability of selected pinto bean varieties to yield under irrigated conditions of the Arkansas Valley.
Data - 1. Yields 2. Test Weight 3. Seeds! lb.
Plot - 42' X 5'(2 rows)
Design - Randomized complete blocks (3 replications)
Varieties - 20 entries
Fertilizer - 50 lbs. P20sfAcre
+
10 lbs. N/acre - 11/7/00Herbicide - Tretlan 4E .75 Ibs.AIIAcre + Eptam 7E 3 Ibs.AIIAcre - 5/2901
Insecticide - none Fungicide - none
Plant - June 5, 2001
Irrigate - 6/6, 7/6, 7/25, 8/10, 8/27
Harvest - Cut - 9/19; Lift-9/26; Thresh - 9/26 - 2 rows, 38' long
Jerry J. Johnson James P. Hain
Frank C. Schweissing
Pinto bean performance at Rocky Ford
lin 200l.
Test
Variety
Yield Moisture Weish
tSeed/lb
lb/ac
%
lb/bu
No.
Montrose
3950
12.5
59.4
1I08
USPT-73
3478
12.1
55.7
1111
,Bill Z
3464
12.4
57.7
II65
Poncho
3429
12.1
57.1
1067
C073680
3263
12.1
56.2
1026
Vision*
3221
13.7
61.6
1137
Buster
3155
13.4
57.7
1064
C075619
2988
13.5
57.7
1214
C073740
2970
20.5
57.5
II 62
GTS-900
2942
14.0
57.9
1111
C074017
' 2913
12.7
55.5
1203
C064155
2896
11.5
53.5
1202
C083778
2887
11.1
51.7
1147
C083785
2826
12.3
53.5
1121
C084086
'2803
14.8
56.5
955
C064342
2719
18.3
57.1
1226
Grand Mesa 2705
10.0
54.3
1161
Burke
2698
13.5
55.5
1179
C075944
2640
14.3
57.3
1167
Rally
2459
11.7
55.6
1035
Average
3020
13.3
56.5
1128
CV%
12.0
l.SD,o,;ol
312
*Estimated value calculated on single plot, two missing
values.
lTrial conducted on the Arkansas Valley Research Center;
seeded
6/5and harvested
9/26.Bill Z Burke Buster CO Grand Mesa GTS-900 Montrose Poncho Rally USPT-73 Vision
DESCRIPTION OF PINTO BEANS
A variety released by Colorado State University in 1985. It has a vine Type III growth habit with resistance to bean common mosaic virus and moderate tolerance to bacterial brown spot. It is a productive variety when growing conditions are good, similar to Olathe for white mold and rust susceptibility and maturity.
A medium season variety (USW A-19) released by Washington State in 1996. It has resistance to rust and white mold.
Anew variety from Asgrow Seed Co. (5051) released in 1998.
Colorado State University experimental lines. Only 64155 has rust resistance. Colorado State University release (C075511) semi upright, medium season, rust
resistant, moderate resistance to white mold. Full season experimental line from Gentec.
A variety released from Colorado State University in 1999 (C051715) with resistance to rust and excellent seed quality.
A variety from Novartis Seeds, Inc. (ROG 179) susceptible to rust, but moderately resistant to some bacterial diseases.
Gentec in Twin Falls, Idaho (GTS-Cob.502) An experimental line from WSU-ARS.
A full season upright variety with resistance to rust. Asgrow Seed Co.
2001 Corn Grain and SHage Variety Trial Arkansas Valley Research Center
The average grain yield in this trial was 206 bushels per acre compared to 2000-233 bu., 1999-206 bu., 1998-200 bu., 1997-206
bu.,
1996-219 bu., 1995-197 bu., 1994-230 bu., 1993-178 bu., 1991-209 bu. and 1990-183 bu. The average silage yield was 34 tons per acre compared to 2000-39T.,1999-33T., 1998-40T., 1997-32T., 1996-36T., 1995-35T., 1994-33T., 1993-27T., 1992-41T., 1991-3 7T., and 1990-1991-31 T. The average silking date for this trial was 1 day later than in 2000. Grain yields were adjusted to 15.5% moisture and 56 pound bushels while silage yields were adjusted to 70010 moisture. This allows direct comparison between varieties, but actual harvest moistures and silking dates indicate maturity and should be considered when choosing a variety.
Test Plot Information
Purpose - To evaluate the inherent genetic ability of selected com varieties to yield grain and silage under irrigated conditions in the Arkansas Valley.
Data - 1. Grain yields 2. Forage yields 3. Growth factors
Plots - Grain - 32' X 10' (4rows) Harvest 2 rows Silage - 32' X 5' (2 rows)
Design - Randomized complete blocks (3 replications)
Varieties - Grain-22 entries Silage-18 entries
Fertilizer - 50 lbs. P20,
+
10 lbs. N/Acre - 11/7/00 1921bs. N/A as NH3 - 12/5/00Herbicide - Bladex 1.0 lbs. + Dual IT 1.15 lbs. + Gramoxone .31 AIl Acre - 4/23/01 Banvel.5Ibs. AIlAcre - 5/15/01
Insecticide - Capture .08 lbs. AIl Acre - 8/11/01
Soil- Silty, clay loam, 1-1.5% o.m., pH ca. 7.8
Plant - April 27, 2001
Irrigate - 5/2, 6/29, 7/18, 7/31, 9/3
Harvest - Silage - September 11, 2001 - Forage harvester
Grain - October 26, 2001 - Self-propelled two row plot combine
Jerry J. Johnson James P. Hain
Frank C. Schweissing
Irrigated corn I!erfonnance at Roc!!! Fordl in 2001.
Grain Test Plant
Hybrid Yield Moisture Weisht HeiBiht Densi!l: LodginS Silkins2 bu/ac % lblbu in plants/ac % date Pioneer brand 33P67 (BT) 253 13.5 60.7 84 28949 0 199 HYTEST HT7806 231 15.4 58.8 82 29312 2 201 Producers PH 714 (BT) 226 12.2 58.2 79 30401 0 198 Garst 8559 (BT) (RR) 217 11.3 56.7 80 29040 0 197 ASGROW RX730 (RR) (YG) 215 12.1 58.1 75 28768 0 198 Pioneer brand 33B51 (BT) 215 13.7 59.8 78 27830 0 197 Kaystar X1181 211 13.0 59.7 88 26819 2 202
Grand Valley SXI600 211 14.6 59.0 87 26196 3 205 Pioneer brand 33R77 210 14.0 57.8 86 27264 4 201 Pioneer brand 33A72 209 12.4 60.5 82 29131 2 198 Triumph 1120 (BT) (RR) 208 12.1 58.0 77 28597 0 199 Producers PH 717 (BT) 204 13.3 59.0 80 27588 0 198 Grand Valley SX1300 204 12.1 58.7 79 28188 0 197 Novartis N67-T4 (BT) 203 12.2 59.0 79 29948 0 198 Grand Valley GVX1758 203 12.7 59.6 80 28159 0 199 Triumph 2020 (BT) (RR) 198 14.0 57.5 82 28405 0 202 Grand Valley GVX4426 196 16.2 60.3 87 25397 2 203 Novartis N72-J5 189 12.7 58.4 83 25444 3 198 Grand Valley GVX4478 184 13.0 57.9 84 24775 3 199 DEKALB DKC57-38 181 10.0 60.0 77 28411 3 198 DEKALB DKC60-15 181 12.2 59.0 72 25954 3 196 Kaystar KX-899 179 17.6 58.8 77 27406 2 199 Average 206 13.2 58.9 81 27817 1 199 CVOIo 5.5 LSD'iI~ 10
lTrial conducted on the Arkansas Valley Research Center; seeded 4/27 and harvested 10/26. No significant ear drop.
2Julian date.
Corn silage J2erformance at Rocky Ford
lin 2001.
Plant
Hybrid
Yield Moisture Height Density
Silking2
tJac%
m
plants/ac
date
Grand Valley SX1602
37.9
62.2
98
30421
204
HYTEST HT7820
36.9
62.8
100
28805
205
Wilson 1980
36.7
62.9
92
26197
207
AgriPro HY 9646
36.6
61.5
94
27406
204
Zimrnennan 1851W
35.8
61.9
90
30401
205
HYTEST HT7815
35.5
65.7
88
30946
207
Asgrow R.X938
35.4
63.0
88
28223
207
MBS3 811 x Lfy 497L
35.1
60.0
106
29222
206
HYTEST TNTl18
34.6
61.7
87
28858
204
Pioneer brand 31 B 13 (BT)
34.5
58.4
87
29131
203
Grand Valley GVXOl16
34.4
64.7
92
28768
204
DEKALB DK743
·33.6
64.3
90
27860
203
Pioneer brand 32P76 (BT)
33.5
58.8
87
28211
200
Pioneer brand 31 G98
33.2
62.4
88
28223
203
MBS3811 x Lfy 669L
31.9
68.2
III
26553
213
FR1064 x Lfy 419L
31.2
57.3
95
28314
203
Garst 8315 (IT) (1MI)
31.1
63.2
89
27871
205
Wilson 1788
28.0
56.0
86
28968
198
Average
34.2
61.9
93
28577
204
CV%
7.5
LSD(o.
3012.2
ITrial conducted on the Arkansas Valley Research Center; seeded 4127 and harvested 9/11.
2Julian date.
Nitrogen Fertilization of Irrigated Corn at A VRC
Ardell Halvorson!, Frank Schweissing2, and Curtis Reule!
!USDA-ARS, Fort Collins, CO and 2 A VRC, Rocky Ford, CO
email: adhalvor@lamar.colostate.edu; phone: (970) 490-8230
The U.S. Department of Agriculture, Agricultural Research Service, Northern Plains Area is an equal opportunity/affinnative action employer and all agency services are available without discrimination.
SUMMARY
This study evaluated the effects ofN fertilizer rate (0, 50, 100, 150, 200, and 250 lb N/a) and N source (urea and Polyon®3) on com yields following 5 years of alfalfa and one year of watermelon production. Com grain yields were not increased by N fertilization in 2000 and were not influenced by N source. Silage yields increased with increasing N rate up to about 150 lb N/a, then decreased with increasing N rate. Soil residual N03-N levels after com harvest increased with increasing N rate in 2000. In 2001, com grain and silage yields were not significantly increased by increasing residual soil N03-N levels (no N fertilizer applied). Based on this study, it appears that a minimal amount «50 lb N/a) ofN fertilizer may need to be applied to com to maintain grain and silage yields in the Valley in rotations with a vegetable crop like watermelon. Fertilizer N appears to be moving out of the root zone with downward movement of irrigation water. Residual soil NOrN was greatly reduced by the second com crop which was not fertilized.
PROBLEM
High nitrate-N (N03-N) levels have been reported in groundwater in the Arkansas River Valley in Colorado, which is a major producer of melons, onions, and other vegetable crops grown in rotation with alfalfa, com, sorghum, winter wheat, and soybeans. Relatively high rates of N fertilizer are used to optimize crop yields and quality, generally without regard to soil testing. Vegetable crops generally have shallow rooting depths and require frequent irrigation to maintain market quality. High residual soil N03-N levels, high N fertilization rates to shallow-rooted crops, shallow water tables, and excess water application to control soil salinity all contribute to a high NOrN leaching potential.
Application of slow-release fertilizers to crops in the Arkansas Valley could potentially increase nitrogen use efficiency (NUB) and reduce nitrate-N leaching potential. Nitrogen management research is needed to develop improved NUB and N management practices for furrow irrigated crops in this area. Improved N management practices for crops in the Arkansas River Valley should optimize crop yields while minimizing N fertilizer impacts on ground water quality.
®Registered Trade Mark of Pursell Technologies Inc., Sylacauga, AL.
3Trade names and company names are included for the benefit of the reader and do not imply any endorsement or preferential treatment of the product by the authors or the USDA, Agricultural Research Service.
Objectives of this research were to determine N fertilizer needs for optimizing furrow-irrigated com yields in a high residual soil N environment in Arkansas River Valley, evaluate the effects of a slow-release N fertilizer on N fertilizer use efficiency by com, and evaluate the influence ofN management on residual soil NOrN and potential for groundwater contamination.
A N fertilizer rate and source study was initiated under conventional till, furrow irrigated com on a calcareous Rocky Ford silty clay loam soil at the Arkansas Valley Research Center (A VRC) in 2000. The plot area that had previously been in alfalfa for 5 years, before being plowed up on 20 October 98. Two applications of 150 Ib P 20/a as 11-52-0 added 641b N/a during the five years of alfalfa production. Watermelon was produced on the plot area in 1999 with 21lb N/a added with the phosphate fertilizer. Com was produced in 2000 with 11 lb N/a added with phosphate fertilizer. Six broadcast N rates were established (0,50, 100, 150,200, and 250 lb N/a) in 2000. Two N sources, urea and Polyon® (a slow-release urea fertilizer), were applied at each N rate. The N fertilizer was broadcast and incorporated with a harrow before com planting. No additional N fertilizer was applied to the 2001 com crop.
Com (pioneer 33A14 hybrid) was planted on April 27 ,2000 at a seeding rate of about 28,400 seeds per acre. The 2001 com (DeKalb 642RR hybrid) crop was planted on April 24 at a seeding rate of about 40,000 seeds per acre.
Soil N03-N levels in the 0-6 ft profile have been monitored since the spring of 1999. The N fertilizer rates were not reapplied in 2001 because of high levels of residual soil N03-N following the 2000 com crop. In the fall of2000, 11lb N/a was applied with the phosphate fertilizer just prior to plowing.
The N level in the irrigation water was monitored by A VRC throughout each growing season. The irrigation water contained an average of2.5 ppm N03-N in 2000 and 2.8 ppm NOrN in 2001. The N contribution from the irrigation water to the plot area would have amounted to about 61b N/a in 1999 while irrigating the watermelon and about 151b N/a in 2000 and 141b N/a in 2001 while irrigating the com. Assuming a 50% irrigation efficiency, about 7 to 8 Ibs ofN may have entered the soil each year.
RESULTS
In April 1999, the soil NOrN in the profile was concentrated in the 0-2 ft soil depth, with low levels ofN03-N at deeper depths (Table 1). The total amount ofNOrN in the 6-ft profile was 1141b N/a. Following the watermelon crop, soil N03-N levels in November 1999 had decreased in the top 2 ft but increased in the deeper soil depths. The total amount ofNOrN in the 6-ft profile was 157 Ib N/a in November of 1999. In April 2000, soil N03-N levels in upper part of the soil profile had increased, with a total level of180 Ib N/ain the 6-ft profile. Thus soil N03-N levels just prior to N fertilization and com planting was relatively high, despite the fact that little N fertilizer had been applied during the previous 6 years. The question is, what is the source of this high level of residual soil N?
The total watermelon oven dry biomass produced (tops
+
melons) in 1999 was 12,0941b/a with the tops contributing 4,0981b/a of this total. About 124lb N/a was returned to the soil in the tops, which had a CIN ratio of 13. At this CIN ratio, the tops would decompose rather rapidly when incorporated into the soil, with a release of N to the following com crop. The watermelon rinds made up 29.5% of the oven dry melon weight. Assuming that 50% of the melons were ofharvestable size (>18 lbs), the rinds on the unharvested melons left in the field could have contributed 35 lb N/a back to the soil. With a CIN ratio of 14, the rind was expected to decompose rather rapidly. Assuming that the fruit or meat part of the unharvested melons contained about 1% N, an additional 30 lb N/a could possibly have been returned to the soil. When the unharvested melons and tops were destroyed by disking, microbial decomposition of the melon biomass was initiated. This could explain the increase in soil NOrN measured in the profile from November 1999 to April 2000. The amount of N in the watermelon tops and unharvested melons could potentially contribute up to 184lb N/a to the next crop. This might explain the unexpected high level of soil N at com planting in 2000 (Table 1).
Table 1. Average soil NOrN levels in the non-fertilized check plots before and after the 1999 watermelon crop, before and after the 2000 com crop, and before the 2001 com crop.
1 Apr 99 8 Nov 99 10 Apr 00 25 Oct 00 20 Mar 01 Before After Before 2000 After 2000 Before 2001 Soil Depth Watermelon Watermelon Com Crop Com Crop Com Crop
feet Soil NOrN, lb/a
0-1 81.8 41.1 78.9 42.3 72.3 1-2 13.1 23.1 33.0 21.5 14.8 2-3 5.6 26.4 24.4 32.1 13.8 3-4 4.4 25.4 18.1 19.6 10.7 4-5 5.2 23.7 14.9 16.7 7.3 5-6 3.7 16.7 11.2 7.3 6.2 Total 113.7 156.5 180.5 139.5 124.9
Residual soil N03-N levels after com harvest in 2000 and 2001 are reported in Table 2. Residual soil NOrN levels were approaching more normal levels after harvest of the 2001 com crop which was not fertilized. Residual NOrN levels in the 6 ft soil profile on 5 November 2001 still increased with increasing rates ofN above 100 lb N/a applied to the 2000 com crop.
Com grain yields were not significantly increased by N fertilization in this study in 2000 or by increasing residual soil N03-N levels in 2001 (Tables 2 and 3). Nitrogen fertilizer source had no significant effect on grain yield either year (Table 3). The overall average grain yields were 254 bula in 2000 and 198 bula in 2001. The lower yields in 2001 were partially caused by insect damage to the com ear during ear development. The lack of response to N fertilization in 2000 and to increasing residual soil N03-N levels in 2001 was unexpected. Residual soil NOrN was 136lb N/a in the 0 to 3 ft soil depth prior to N fertilization in April 2000. Assuming a yield goal of250 bula and a N requirement of 1 lb Nlbu, about 250 lb/a of available N would be needed to produce this high yielding crop. Assuming that about 30 lb N/a is produced from each 1 % soil organic matter, about 45 lb N/a may have been mineralized from SOM. It is estimated that less than 200 lb N/a was
16
,
j
available to the com crop without N fertilization, yet the non-fertilized plot produced 251 bula in . 2000.
Table 2. Soil N03-N levels with soil depth on 25 October 2000 and 20 March 2001 for each
of the 2000 N rate treatments.
Fertilizer N Rate (lb N/a) Applied to 2000 Com Crop
Soil 0 50 100 150 200 250 0 50 100 150 200 250
Depth 25 October 2000 5 November 2001
ft Soil N03-N, lb N/a 0-1 42 64 90 118 157 206 20 22 20 18 21 45 1-2 22 21 17 21 79 62 6 7 8 7 13 20 2-3 32 41 48 73 36 145 5 6 9 10 20 40 3-4 20 16 17 34 35 83 6 6 5 14 16 14 4-5 17 22 50 43 69 52 8 6 5 14 20 16 5-6 7 15 21 15 25 23 6 9 7 12 17 14 Total 140 180 244 304 401 570 52 55 54 76 107 149
Com silage yields (70% moisture) on 9 September 2000 increased significantly with increasing N rate up to 150 lb N/a then declined with increasing N rate (Table 3). The 2001 silage yields did not increase with increasing residual soil N03-N levels. The decrease in plant population at the 200 and 250 lb/a N rates, especially with urea, explains the decrease observed in com silage yields at these N rates. In contrast, com grain yields were maintained at these high N rates despite the lower population.' Thus, the com plants at the high N rates compensated with larger ears and two ears were produced on some plants.
Crop N fertilizer use efficiency (NFUE) based on total N uptake in 2000 decreased with increasing N rate with NFUE of 41,21, 15,2, and 7% for the 50, 100, 150,200, and 250 lb N/a
treatments, respectively. The two year NFUE's were 71, 39, 34, 25, and 25 % for these same respective N treatments.
Based on the 2000 plant N uptake data, 0.7 lb Nlbu was removed in the com grain in 2000 and 0.68 lb Nlbu in 2001. An average total N requirement of 1.091b Nlbu was required to produce the 2000 com crop and 1.19 lb Nlbu in 2001. These total N requirement values from A VRC are in agreement with total N needs of irrigated com of 1.1 to 1.2 lb Nlbu reported in the literature and used by the fertilizer industry to estimate N fertilizer needs.
Although the irrigation water contributes some N to the cropping system, it does not appear to be the major contributor to the high levels of N03-N found in the soils at A VRC. Soil N
I
I
This com N study will be continued on the same plots in 2002. Nitrogen fertilizer will be applied, but lower N rates than in 2000 will be used. Nitrogen fertilization effects on residual soil . nitrate-N levels will continue to be monitored. Based on the soil N03-N data in Table 2, the addition
ofN fertilizer increased the level of soil N03-N throughout the 6 ft profile. Assuming an effective
rooting depth of 3 to 4 ft, some of the fertilizer N was leached beyond the com root zone in this study. This observation is supported by an adjacent lSN fertilizer study with onion and com by Halvorson et al. (2002), who found fertilizer N leached to a 6-ft depth the year of application to an onion crop and was still present after harvest of the following com crop with no additional fertilizer N applied.
Table 3. Com grain and silage yields for 2000 and 2001 as a function of the fertilizer N rates applied only to the 2000 com crop at Rocky Ford, CO.
2000 2000 Grain Yield 2000 Silage 2001 Grain Yield 2001 Silage Yield
Fertilizer Yield
NRate
lb N/a Urea Polyon® Urea Polyon® Urea Polyon® Urea Polyon® bula (15.5% moist.) tla (70% moist.) bula (15.5% moist.) tla (70% moist.)
0 248 254 33.3 35.3 170 185 37.5 39.9 50 260 258 36.8 36.3 193 194 39.6 41.4 100 248 253 36.5 36.3 198 201 39.9 38.9 150 254 247 37.7 37.0 214 201 42.2 38.1 200 250 260 32.7 35.4 205 204 40.4 42.5 250 256 259 33.9 36.0 209 196 39.7 42.1 LSDo.os N.S. 2.3 N.S. N.S. REFERENCE
Halvorson, A.D., R.F. Follett, M.E. Bartolo, and F.C. Schweissing. 2002. Nitrogen fertilizer use efficiency by furrow irrigated onion and com. Agronomy Journal (In press, May-June issue)
ACKNOWLEDGMENT
The authors wish to thank Patti Norris, Marcella Causton, Kevin Tanabe, and Marvin Wallace for their field assistance and analytical support in processing the soil and plant samples and collecting the data reported herein.
Location: Investigator:
Introduction
Com After Alfalfa Tillage Study Five Year Study Results 1994, 1995, 1996, 1997 and 2001 Arkansas Valley Research Center
Jim Valliant, Irrigation Specialist and Research Scientist Colorado State University
Many producers think old alfalfa stands must be moldboard plowed if com is to be planted on that area the following season Because the alfalfa has been run over with swathers, rakes and balers for the past 4 to 7 years, they think there is a compacted layer of soil that will reduce infiltration of the rainfall and irrigation and will result in reduce com yields. In most old alfalfa, there is a massive root systems as deep as 6 to 8 feet and as these roots decay they leave the soil open. Most ofthe compacted layer is close to the surface, usually within three (3) to five (5) inches, and can be easily penetrated by water or developing com roots. Under most conditions during seed germination and early rood development, there is adequate soil moisture to keep the soil soft to allow root development through the compacted layer. As the main root system develops, it will be able to follow the alfalfa roots down into the soils below the softened compacted layer.
A tillage study was started in 1994 to compare the effect of moldboard plowed alfalfa and reduced tilled alfalfa on com yield and returns. This study was continued as alfalfa stands were planted to com in 1995, 1996, 1997 and 2001. Yields and production practices associated with each of the tillage practices were recorded and costs and returns were based on local pricing for the year that the study was conducted.
Materials and Methods
All of the production costs associated with the different tillage practices were based on the conditions prevailing during the year of the study. For example, in 1994, Banvel4 was applied to both the moldboard plowed and reduced tilled areas because of excessive weed populations during the early growing season. Fertilizer amounts, herbicide type and amounts and com variety and seeding rates were the same on both tillage areas. All of the materials were the same on both tillage areas but tillage methods and costs differed.
2001 Results
Production costs on the moldboard plowed areas were $20.80 per acre higher that on the reduced tilled areas as shown in Table 1. And, com yields and adjusted returns were significantly affected by the tillage method in 2001.
The reduced tillage areas produced 198.4 bushels per acre compared to 188.3 bushels per acre on the moldboard plowed areas (Table 2.). This yield increase combined with the reduced cost of field operations resulted in the reduced tilled areas producing an adjusted return increase of$43.00 per acre when compared to the moldboard plowed areas (Table 3.)
Table 1. Corn After Alfalfa Tillage study Field Operations & Costs, 2001
Arkansas Research Center, Rocky Ford Moldboard Plowed Area Reduced Tillage Area
Operation $/Acre1 Operation $/Acre1
Fertilize 3.50 Fertilize . 3.50
10.6 N & 50 P lb/ac 10.6 N & 50 P lb/ac
as 11-52-0 as 11-52-0 @ $270/ton 13.00 @ $270/ton 13.00 Moldboard Plow 16.00 Mulch 6.00 Disk ... 2X 10.00 Disk-2X 10.00 Fertilize 6.00 Fertilize 6.00 100 lb/ac N as NH3 100 lb/ac as NH3 @ $340/ton 17.00 @ $340/ton 17.00 Float 5.00 Float 5.00 Bed 5.00 Bed 5.00
Dual 2-1.15 lb AI/Ac 16.90 Dual 2-1.15 lb AI/Ac 16.90
Gromoxone-0.3 AI/Ac 3.90 Gromoxone-0.3 AI/Ac 3.90
Bladex -1.0 lb AI/Ac 12.10 Bladex-1.0 lb AI/Ac 12.10
Boom Spray 4.00 Boom Spray 4.00
Plant 8.00 Plant 8.00
DeKalb DK423 DeKalb DK423
31,500 Seed/Ac 43.30 31,500 Seed/Ac 43.30
Banvel 4-0.5 lb AI/Ac 11.50 Banvel 4-0.5 lb AI/Ac 11.50
Boom Sprayer 4.00 Boom Sprayer 4.00
Cultivate - 2x 12.00 Cultivate - 2x 12.00
Capture-0.08 lb AI/Ac 16.60 Capture-0.08 lb AI/Ac 16.60
Aerial Spray 4.00 Aerial Spray 4.00
Harvest 12.00 Harvest 12.00
188 bu/ac @ $0.12/bu 22.60 198 bu/ac @ $0.12 23.80
TOTAL $252.40 TOTAL $231.60
T~llage, spray~ng and harvest costs were based on Most Common for Southeast Colorado, £QQQ Custom Rates For Colorado Farms and Ranches, Colorado State University. Chemical and seed costs based on local rates for 2001. Corn at $110 per 80,000 seed bag.
I
I
Table 2. Com After Alfalfa Tillage Study
Grain Com Yield, 2001
Arkansas Valley Research Center, Rocky Ford
TILLAGE METHODS HARVEST MOISTURE GRAIN CORN YIELD- Bushels! Acre 15.5% Moisture
Moldboard Plow 9.9 188.3
Reduced Tillage 10.2 198.4
(+10.1)
"
Table 3. Corn After Alfalfa Tillage Study
Yield, Gross Returns, Field Operations Costs and Adjusted Returns, 2001
Arkansas Valley Research Center, Rocky Ford
TILLAGE GRAIN YIELD RETURNS COST, FIELD ADJUSTED
METHOD BU/AC $/AC1 OPERATIONS RETURNS
$/AC2 $/AC3 Moldboard 188.3 414.30 252.40 161.90 Plow Reduced 198.4 436.50 231. 60 204.90 Tillage (+43.00) 1 Based on $2.20/bushel,11/01. 2 Based on costs shown in Table 1.
Five-Y ear Results and Discussion
Results of the 5-year study show, that contrary to the beliefs of many growers, there was no yield reduction because of the reduced tillage but the trend was to equal or higher com yields. The com on the moldboard plowed areas averaged 194.3 bushels per acre, lower although not significantly lower than the 197.9 bushels per acre produced on the reduced tilled areas as shown in Table 4.
But when the adjusted returns for the 5-year study were compared, the reduced tilled areas returned $317.80 per acre which was significantly higher than the $292.00 per acre returned on the moldboard plowed areas. The increase of$25.80 per acre was due mostly to the cost of field operations reqUired with moldboard plowing, $17.00, while the rest was due to the slight increase in yield.
Table 4. Com After Alfalfa Tillage Study
Grain
Yield and Harvest Moisture1994, 1995, 1996, 1997 and 2001
Arkansas Valley Research Center, Rocky Ford
TILLAGE YEAR GRAIN YIELD %
METHOD of BU/AC MOISTURE
STUDY 15.5% MOISTURE AT HARVEST
Moldboard Plow 1994 215.1 13.7 1995 180.7 16.2 1996 189.6 12.9 1997 197.8 14.7 2001 188.3 9.9 Average 194.3 13.5 Reduced Tillage 1994 213.6 14.1 1995 188.4 16.8 1996 192.5 13.5 1997 196.8 14.7 2001 198.4 10.2 Average 197.9 13.9
Table 5. Com After Alfalfa Tillage Study
Yield, Gross Return, Production Costs and Adjusted Return 1994, 1995, 1996, 1997 and 2001
Arkansas Valley Research Center, Rocky Ford
TILLAGE YEAR GRAIN GROSS "PROD." ADJUSTED
METIIOD YIELD RETURN COST RETURN
BU/AC $IAC $IAC $IAC
Moldboard 1994 215.1 505.50 208.60 296.90 Plow 1995 180.7 440.90 201.50 239.40 1996 189.6 583.90 193.50 390.50 1997 197.8 561.70 190.60 371.10 2001 188.3 414.30 252.40 161.90 Average 194.3 501.20 209.30 292.00 Reduced 1994 213.6 502.00 192.10 309.90 Tillage 1995 188.4 459.7 181.00 278.70 1996 192.5 593.00 184.00 409.10 1997 196.8 558.90 172.60 386.30 2001 198.4 436.50 231.60 204.90 Average 197.9 510.00 192.30 317.80 +or- +3.6BU +$8.80 -$17.00 +$25.80
Gross Returns and Production Costs are based on prices during the individual year of production. The results, when considering yield and adjusted gross return, indicate that reduced tillage can be a useful tool to reduce costs while maintaining yields and increasing returns in com
production. It not only produces greater returns but should increase soil moisture in the soil just below the surface. Although this was not part of the study, moldboard plowing out of alfalfa stands to plant corn, especially on dry years, have resulted in extremely cloddy ground which required even more investment in tillage operations.
!fa grower wants to moldboard plow. the results of this study indicate that it would be more profitable to plow after the first year of corn. not following alfalfa.
2001 PAM Application Study on Com And Three-Year Summary Location:
Arkansas Valley Research Center
Investigator: Jim Valliant, Irrigation Specialist and Research Scientist
Introduction
PAM, an acronym used for a linear-linked polyacrylamide, has been shown to reduce erosion as much as 99010 and increase infiltration up to 40% in several studies throughout the western U.S. Some users asked, "What effect does PAM have on yield and will I get my money back?
Studies were conducted in 1997, 1998 and 2001 to detennine the effect of the use of PAM on corn. Because of the short lengths of run, erosion studies were not connected to the study. Neither were any studies ofthe effect of PAM on infiltration.
Materia]s and Methods
All field operations, fertilizer, herbicides, insecticides, com variety, planting rates and harvest date were the same on both the untreated c~k areas and the PAM treated areas. All areas received 96 pounds per acre of 11-52-0 in the late fall prior to planting year and were sidedressed with 234 pounds per acre of anhydrous ammonia.
The com was planted on top of the bed on April 27 and irrigated, every other row, for germination on May 2. Pam was applied only to the irrigated furrows at the rate on one (1.0) pound per irrigated acre or, in this case, 0.5 pounds per crop acre. One acre was 36 30- inches rows 500 feet long, so 1118 of a pound or slightly under 1.0 ounce was applied to each irrigated row. The PAM granules were weighed and put into a container and the level was marked. Then the PAM was applied using the "shot glass" method pouring the 1118 of a pound in each row to be irrigated, BEFORE the water was started.
The PAM was applied to the same area in 1997, 1998 and 2001. PAM was applied at germination irrigation and, again, after the com had been cultivated.
The com was harvested October 26 using a two-row harvester that recorded plot yield, moisture and bushel weight. Two rows were harvested using two replications and eight sub-plots. All yields were converted to bushels per acre at 15.5% moisture.
Results and Discussion. 2001
The PAM treated areas produced an average yield of 216.1 as compared to 203.7 bushels per acre on the untreated area while harvest moisture was the same at 10.6% (Table 1).
Table. 1 PAM Application Study on Com, 2001 Grain Moisture and Yield
Arkansas Valley Research Center, Rocky Ford
TREATMENT MOISTURE GRAIN YIELD
% BU/AC
Untreated 10.2 203.7
PAM 10.2 216.1
Moisture LSD - NS
Yield LSD - 12 BuiAc @5%
These results indicate that the application on 1.0 pounds of PAM per acre substantially increased the yield of com producing a very good return on the investment. The increase of 12.4 bushels at $2.20 per bushel would return $27.28 per acre while requiring an investment of $5 per acre for the PAM.
Results and Discussion. 1997, 1998 and 2001
Results of the three-year study, as shown in Table 2, indicate that the effect of the use of PAM on com yield may depend on the year. In 1997, a significant yield increases was produced by the use ofP AM, however; there was no effect on the yield of com in 1998 due to the use of PAM. There was no significant difference in yield at 5% in 2001, yields were significant at 10%. This study did indicate a trend to an increase in yield during the three years of study, 1997. 1998 and 2001.
Table 2. PAM Application Study on Com-1997, 1998 and 2001 Harvest Moisture and Grain Com Yield
Arkansas Valley Research Center, Rocky Ford HARVEST MOISTURE, % TREATMENT
1997 1998 2001 3-YEARAVE.
Untreated 17.3 13.8 10.2 13.8
PAM 17.6 13.9 10.2 13.9
GRAIN CORN YIELD, BU/AC @ 15.5% MOISTURE
Untreated 205.5 191.0 203.7 200.1
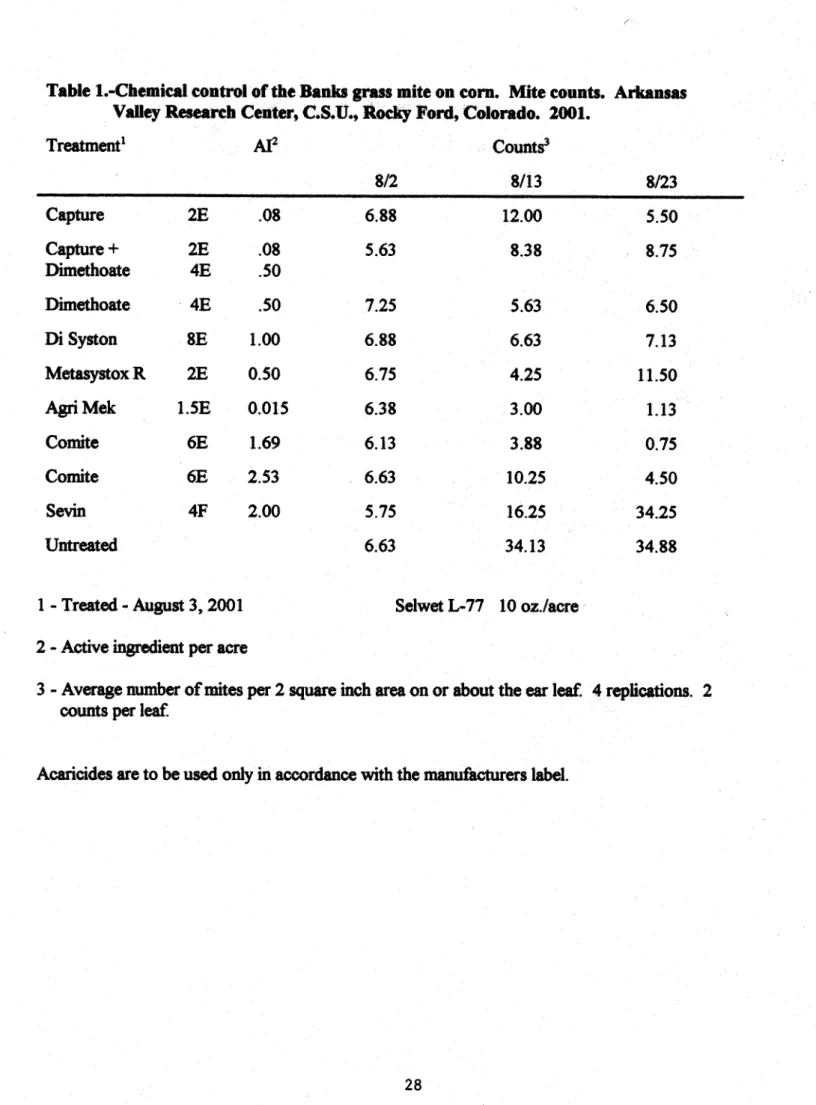
Chemical Control of the Banks Grass Mite - 2001 Arkansas VaDey Research Center
Rocky Ford, Colorado Frank C. Schweissing
Com production in the area was generally good due to warm weather, adequate irrigation and average precipitation. There were 3081 growing degree days between May 1 and September 30 which is above normal. Substantially above average precipitation occurred during May and June while July was slightly below average. August at .27" precipitation was well below average (1.57"). The rainy conditions of May and June along with normal July rainfall tended to suppress and delay mite development. A dry August allowed mites to develop but due to the lateness in the season serious damage to the com was avoided. The plots were treated August 3, 18 days after the half silk date of July 16.
Methods and Materials-Supporting information is given on page 2.
The two row·plots were separated by four rows of com which served as a buffer between plots to reduce the effect of chemical drift and to maintain adequate population pressure on the various treatments.
The treatments were applied August 3. Silwet L-77 at the rate of 10 oz. per acre was added to all treatments. The acaricides were applied with a compressed air sprayer at 40 p.s.i. at the rate of25 g.p.a.
Mite counts were taken from an approximately 2 sq. in. marked area on the underside of two leaves per plot on or near the ear leaf on August 3 and recounted in the same area on August 13 and 23 (Table 1). Predators were counted at the same time. Individual plots were not rated for leaf damage. A general overall plot rating was noted.
Com was harvested for grain with a self-propelled two row plot combine on October 26.
Results
and
Discussion-Banks grass mite populations did not have a chance to develop during the early part of the season when rainfall was excessive. Populations began to build up during August but never reached a level which caused serious damage to the plant. Predators, particularly a thrips, Scolothripsspp.
were numerous early in the season helping prevent population development and late in August after some population buildup. Leafloss was restricted to the lower 4 to 6 leaves and most plots would have a damage rating of2.0 or less on a scale of 0-4. There was no significant difference in yields.All acaricides in the trial, except Sevin, provided substantial reduction in mite populations over the untreated plots. Dimethoate, DiSyston and Metasystox-R all provided better control than we normally expect, poSSIbly due to a lack ofuse the past 3 years due to high rainfall conditions reducing the need for chemical control and pressure on the mite populations to develop resistance. Capture and dimethoate were both effective and a new acaricide Agri-Mek provided very good control.
Test Plot Information - 1001 Arkansas VaDey Research Center
Purpose - To evaluate the effectiveness of selected chemicals for the control of the Banks grass mite,
Oligonychus pratensis
Banks, on com. Data - 1. Mite populations2. Predator populations 3. Injury ratings
4.
Grain yields
Plots - Treated 43.56' long X 2 rows (5') wide
=
217.8 sq. ft.=
200* acre. Design - Randomized complete block ( 4 replications)Variety - Garst 8559 Bt RR
Fertilizer - 50 lbs. P20, - disc, 150 lbs. N as NH3 chisel-preplant
Herbicide - Guardsmen 2.5Ibs. AIlAcre - 4/19 Banvel .5 lbs. AIl Acre - 5/1 0
Glystar Plus 1.0 lbs.
+
Banvel.25Ibs. AIlAcre - 6/25 Soil- Silty, clay loam, 1 - 1.5% o.m., pH - ca. 7.8Plant - April 20, 2001 Halfsilk - July 16 Irrigate - 4/23, 6/28, 8/4, 8/28
Treated - August 3, 2001 - Hahn Hi-Boy - compressed air sprayer - 40 p.s.i 25 g.p.a. - TW12 cone nozzle
Table I.-Chemical control of the Banks grass mite on com. Mite counts. Arkansas Valley Research Center, C.S.tr., Rocky Ford, Colorado. 2001.
Treatment1
Af
Counts3 8/2 8/13 8/23 Capture 2E .08 6.88 12.00 5.50 Capture+
2E .08 5.63 8.38 8.75 Dimethoate 4E .50 Dimethoate ·4E .50 7.25 5.63 6.50Di
Syston 8E 1.00 6.88 6.63 7.13 Metasystox R 2E 0.50 6.75 4.25 11.50 AgriMek 1.5E 0.015 6.38 3.00 1.13 Comite 6E 1.69 6.13 3.88 0.75 Comite 6E 2.53 6.63 10.25 4.50 Sevin 4F 2.00 5.75 16.25 34.25 Untreated 6.63 34.13 34.881 - Treated -
August
3, 2001 Selwet L-77 100z.lacre 2 - Active ingredient per acre3 - Average number of mites per 2 square inch area on or
about
the ear lea£: 4 replications. 2 counts per leaf.Evaluation of Com Borer Resistant (Bt) Hybrids to the Southwestern Com Borer - 2001
Arkansas Valley Research Center
Twenty one com hybrids, including 19 Bt and 2 non-Bt hybrids, were evaluated for resistance to the southwestern com borer (SWCB),
Diatraea grandiosella
Dyar. All of the Bt hybrids had substantially reduced SWCB infestations and significantly increased yields when compared to the non-Bt hybrids. The com earworm (CEW),Helicoverpa zia
(Boddie) was not a factor in this years test.The infestation (SWCB) rate for the non-Bt variety Mycogen 2725 of23% was very much below the rate of 77% in 2000. This could be due to the increased acreage ofBt varieties planted in the area and possibly a colder 2000-2001 winter which did not eliminate overwintering larvae but may have reduced them.
Test Plot Information Date - 1. Yields - grain
2. Brokenllodged stalks
Plot - 32' X 10' (4 rows) Harvest - 2 rows Design - Randomized complete blocks ( 4 replications) Varieties - 21 entries
Fertilizer - 50 lbs. P2
0,+ 10 lbs. N/Acre - 1112/00
1921bs. N as NH3 - 12/5/00
Herbicide - Bladex 1.0 Ibs.
+
Dual II 1.15 lbs.+
Gramoxone .31 Ibs. AIl Acre - 4/23/01 Acaricide - Comite 1.681bs. AIlAcre - 2 g.p.a. aerial- 7/14/01Soil- Silty, clay loam, 1-1.5% o.m., pH ca. 7.8 Plant - April 30, 2001
Irrigate - 5/1, 6/28, 7/16, 8/3, 8/31
Harvest - October 26, 2001 - self-propelled two row plot combine
Table t.-Grain yields of com borer resistant (Bt) and non-resistant com hybrids. Arkansas Valley Researcb Center, C.S.U., Rocky Ford, Colorado. 200t.
Grain Yield2 %3
Hybrid! Brand BU/Acre Moisture % Test Wt. BrokenlLodged
AP9570Bt Agripro 240.59 12.8 58.8 0
AP9689Bt Agripro 226.18 13.8 60.4 0
DK61-11 (Bt) DeKalb 225.37 12.0 59.4 0
H-9235 BtIRR Golden Harvest 222.98 11.8 59.6 . <1
1120BtIRR Triumph 221.59 11.8 58.3 0 DK647Bty DeKalb 218.89 12.3 58.4 0 7821 Bt Cargill 217.45 12.8 61.0 1 HC7747Bt Fontanelle 216.98 13.0 59.0 0 8383 Bt GarSt 216.60 13.8 60.3 0 N65-Al(Bt) NKBrand 210.86 11.1 59.3 0 RX799Bt Asgrow 208.75 14.4 59.9 0 RX730YG Asgrow 207.57 13.0 59.1 0 N9328Bt Garst 206.18 15.0 59.1 0 N67-T4 (Bt) NKBrand 204.64 11.6 58.6 <1 717Bt Producers 204.02 12.3 59.1 0
H-9226 BtIRR Golden Harvest 202.59 10.8 58.3 0
1141 ABt Triumph 200.31 13.0 58.4 0 714Bt Producers 197.08 11.7 58.3 <1 HC7700Bt Fontanelle 187.68 12.3 60.6 <1 2725* Mycogen 165.91 11.6 59.3 23 DKS80RR* DeKalb 164.98 10.5 60.3 33 Column Mean 207.96 LSD(0.10) 15.74 CVOIo 6.41
1 - Plant - April 30, 2001 °NotBt
2 - Yield a(ljusted to 15.5% moisture and 56 lb. bushels. Test wt. = lbs.lbushel at harvest. 3 - Percent of all stalks broken or lodged for each treatment.
Chemical Control of the Southwestern Com Borer ~ 2001 Arkansas Valley Research Center
Rocky Ford, Colorado Frank C. Schweissing
This was a good com production year due to warm temperatures, above average rainfall in May and June, above average com growing degree days (2952) and plentiful irrigation water. Overall precipitation was close to our 100 year average of 11.86" for the year.
This pest, due to a recent string of mild winters, has become an important limiting factor to production in all of the important com producing areas of the Arkansas Valley with the exception of Pueblo County. Bt varieties are an important tool available to growers to reduce the damage caused by this pest. However, there are insecticides available to provide another good tool for the management of this pest.
Methods and Materials -Supporting information relating to the test plots is given on page 2. The two row plots were separated by four rows of com which served as a buffer between plots to reduce the effect of chemical drift and maintain pest population pressure on the various treatments. The insecticides were applied August 3 and a second time on August 16 on half of each plot. Silwet L-77 at 10 oz./acre was added to each treatment. The insecticides were applied with a compressed air sprayer, mounted on a Hahn Hi~Boy sprayer at 38 p.s.i. at the rate of25 g.p.a.
Broken or lodged plants for each plot were counted on October 17, 2001. Com was harvested for grain on October 26, 2001.
Results and Djscussion ~ The various treatments resulted in significantly different yields and a wide range ofbroken/lodged com stalks. The untreated plots produced significantly lower yields than all of the two application treatments except Lorsban. Warrior, Capture and Furadan provided significantly better yields with only one application. Yields were significantly increased when Asana
XL and Pounce were applied twice and they yielded as well as Warrior, Capture and Furadan. Lorsban was ineffective in this test.
It appears, considering the present low price of com, and the cost of insecticide applications the use of 1 application of an effective insecticide would be of particular benefit to growers. Proper timing through the use of pheromone traps and field inspections would be important tools to use with single applications.
Test Plot Information .. 2001
Arkansas VaDey Research Center
Purpose - To evaluate the effectiveness of selected insecticides for the control of the southwestern
com borer
Diatraea grandiose//a Dyar, in com.
Data - 1. Broken stalks, lodging
2. Grain Yields
Plots - Treated 87.12' long X 2 rows (51 wide
=
435.6 sq. Ft.
=
100
1hacre
Design. Split plot, randomized block (4 replications)
Variety - Mycogen 2725
Fertilizer - 50 Ibs.
P20S+
10 lbs.
N/A ..disc, 150 lbs.
N/AasNH
3,chisel .. preplant
Herbicide - Guardsman 2.5Ibs. AlIAcre -
4/18Banvel .5 lbs.
All
Acre -511 0
Acaricide - Comite 1.68lbs. AlIAcre - 2 g.p.a. aerial -7117
Soil- Silty, clay loam, 1-1.5% o.m., pH ca. 7.8
Plant - April 19, 2001
HalfSilk - July 16,2001
Irrigate -
4/24,711,
7/23,8/8,8/30Treated - August 3
and16 .. Hahn Hi-Boy, compressed air
sprayer-38 p.s.i. - 25 g.p.a ... TW12 cone nozzle
Harvest - October 26, 2001 - self-propelled two row combine
w w
Table I.-Chemical control of the southwestern com borer in com. Arkansas Valley Research Center, C.S.U., Rocky Ford, Colorado. 1001.
Treatmentl 1 Application1 Sig.S 2 Applications1
Moist Test Wt. BIL4 Yield3 Moist Test Wt. BIL 4
BulA % lbs/bu. % BulA
%
lbslbu % Warrior 1CS .03 195.60 8.2 58.9 4.3 N.S. 3 192.47 8.5 59.2 2.5 Capture 2EC .08 191.53 8.5 59.3 6.2 N.S. 5 187.93 8.3 59.1 3.5 Furadan 4F 1.00 190.12 8.2 58.9 4.0 N.S. 2 193.56 8.1 59.0 4.2 AsanaXL .66EC .05 168.49 8.6 59.4 12.7*
1 202.97 8.5 59.1 4.5 Untreated 164.98 8.4 59.0 26.5 N.S. 7 159.50 8.0 60.3 27.4 Pounce 3.2EC .20 156.01 8.3 58.9 13.9*
4 188.14 8.5 59.0 7.2 Lorsban 4E 1.00 145.51 8.8 59.9 32.1*
6 162.55 8.1 59.3 21.0 Column Mean 173.18 183.87 LSD(O.lO) 11.23 10.52 CV(%) 4.46 3.93 1 - Treated- IX - August 3, 2001; 2X - August 3 & 16,20012 - Active insecticide per acre.
3 - Average yield per acre, 3 replications per treatment, 15.5% moisture, 56 lb. bushel.
POST EMERGENCE \VEED CONTROL IN CORN
Colorado State University - Weed Science
Project Code: COR.'N1401 Location: ROCKY FORD, CO Cooperator: CSU
Site Description
Crop: CORN Variety:
Plot Width: 10FT Plot Length: 30 FT
Irrigation Type: FURROW
Application Date Time of Day Application Method Application Timing Air Temp (F) Soil.Temp (F) Relative Humidity (%) Wind Velocity (mphldir.)
Sprayer Type BACKPACK C02 A 5124/01 11:00 AM BROADCAST POST 74 62 32
o
Speed (mph) Nozzle Type FLAT FAN 3 Application Information B Application Equipment Nozzle Nozzle Size Height 1l002LP 12IN Summary Comments C Nozzle Spacing 20 IN Planting Date: Reps: 3 Boom Width 10 FT GPA 22 D PSI 24All treatments were applied post emergence to 4 inch tall corn at the 3-4 leaf stage: Weed species were: Russian thistle (SASKR) 6·10 inches: redroot pigweed (AMARE) 1-2 inches \\'/2-4 leaves; green foxtail (SETVI) I inch & 2 leaves; Venice mallow (HIBTR) I inch w/2 leaves; and kochia (KCHSq 2-8 inches tall.
Some of the nev .. ' products tested were: 79406 - Basis Gold with no atrazine; Callisto - a pigment inhibitor from Syngenta: and F 130360 - a sulfonylurea from Aventis. product name will be Option. All treatments provided good to excellent control of the weed species at this site.
34
Tim Damato Phil Westra