Experimental quantification of bulk sampling volume of ECH
2O soil
moisture sensors
Anuchit Limsuwat1, Toshihiro Sakaki1, Tissa H. Illangasekare1
Center for Experimental Study of Subsurface Environmental Processes (CESEP), Environmental Science and Engineering, Colorado School of Mines, Golden, Colorado, USA
Abstract. Recently developed, relatively low-cost, ECH2O soil moisture sensors have re-ceived considerable attention by both laboratory and field scientists. For these sensors to be in-stalled properly, the sampling volume that defines the volume of soil zone where the soil mois-ture affects the sensor readings has to be known. These dielectric sensors comprise plus and ground prongs, where the sensitivity of the plus prong is higher than that of the ground prong. Moreover, the sensor head in which the circuitry is embedded has some sensitivity. It is not straightforward to incorporate these characteristics into numerical quantification of the sampling volume that is often used for conventional TDR probes. Therefore, we re-visited a “classic” experimental approach for quantifying the bulk sampling volume of these sensors. We obtained sensor readings under varying distances between the sensor and a water-air interface, and de-termined the bulk sampling volume when the sensor readings start to show an “abrupt” change. Firstly, we tested two TDR probes (CS-640 and CS-630, Campbell Scientific, Inc.) and showed that the experimental procedure yielded results that were consistent with the previous findings. Secondly, we examined four ECH2O soil moisture sensors that differ in design (EC-5, TM, 5TE, and 10HS, Decagon Devices, Inc.). The results showed that: 1) the sensitivity of the plus prong was generally higher and the contribution of the ground prong varied depending on whether or not the ground prong was in air or under water, 2) abrupt changes were generally limited within small distances (order of ~1 to 2 cm) from the prongs, and 3) the sensor head affected the output readings by 3-5 % for EC-5, TM, and 10HS, and 34% for 5TE. Since the experiments were performed in air and under water, where soil moisture conditions are ex-pected to be in between these extreme conditions, the estimated bulk samplingvolumes should be valid in soils.
1. Introduction
Measurement of soil moisture content is crucial in various applications in hydrolo-gy, irrigation, and environmental engineering. Dielectric properties of soils are known to exhibit a strong dependency on soil moisture content. Since the “universal” relation-ship between dielectric constant (Ka) and volumetric water content (θ) for various types
of soils measured using time domain reflectometry (TDR) was published (Topp et al., 1980), the characteristics of TDR probes and the dielectric properties of soils have been investigated extensively. Electromagnetic methods are now one of the most widely used methods for measuring soil moisture in the laboratory and fields.
For proper installation of the probe/sensor into soil and interpretation of ob-tained data, it is helpful to know the “sampling volume” to determine what proportion
1
Center for Experimental Study of Subsurface Environmental Processes (CESEP), Environmental Science and Engineering Department
Colorado School of Mines Golden, CO 80401 Tel: (303) 273-3483
of the soil sample is being measured. The sampling volume can be defined as the vo-lume of soil around the sensor, inside of which a change in water content affects the sensor readings. In general, the sampling volume of TDR probes depends on several factors such as the number of rods/electrodes (N), rod diameter (D) and rod spacing (S). Baker and Lascano (1989) experimentally measured a sampling volume of a 2-prong TDR probe by placing the probe in a collection of glass tubes filled with either air or water. Knight (1992) and Knight et al. (1995) developed approximate analytical solu-tions, respectively, for two- and multi-prong probes by weighting the energy density distribution. Petersen (1995) performed a series of experiments using 2-prong probes and found that the resulting sampling volumes were in excellent agreement with the theoretical results by Knight et al. (1995). Based on these studies, it was determined that, for a 2-prong TDR probe, the sampling volume was a cylinder with a diameter roughly equal to twice the prong spacing. Sakaki (1996) numerically obtained two-dimensional energy density distributions around various types of TDR probes and cal-culated its cumulative energy. For a 3-prong probe (with S/D = 10), it was found that roughly 90% of the energy was enclosed within a volume with a thickness of about S (perpendicular to prong spacing) and width slightly larger than 2S (in the direction of prong spacing); which seemed to agree closely with the results for a 3-prong TDR probe presented by Knight (1995). Knight et al. (1997) and Ferré et al. (1998) performed fur-ther analysis for more complicated probe configurations, thus, the sampling volume for TDR probes are now well understood as summarized in Robinson et al. (2003).
Recent developments and improvements of ECH2O soil moisture sensors (Decagon Devices, Inc.) allow for detailed monitoring of soil water content at relatively low cost both in the laboratory and field. Whereas TDR measures travel time of an electromag-netic pulse along a waveguide embedded in soil, the ECH2O soil moisture sensor uses capacitance to measure the apparent dielectric constant of the surrounding medium. The ECH2O soil moisture sensors are comprised of plus and ground prongs where the sensitivity of the plus prong is higher than that of the ground prong. Moreover, the sen-sor head in which the circuitry is embedded has some sensitivity. Therefore, it is not as straightforward to incorporate these asymmetric characteristics and sensor head sensi-tivity into numerical/analytical analysis of the sampling volume.
The main objective of this study is to quantify the sampling volumes of the ECH2O soil moisture sensors. We focused on four different currently available sensor types;
EC-5, TM, 5TE, and 10HS. They differ in design (dimensions and capability) but all util-ize an excitation frequency of 70MHz. Due to the asymmetry and sensor head sensitivi-ty, we adopted a “classical” experimental method similar to that adopted by Petersen (1995) to quantify bulk sampling volume of the aforementioned sensors. To accomplish this, we performed the following two tasks; 1) Examine the methodology using two commercially available 3-prong TDR probes and show that the obtained bulk sampling volumes are consistent with the previous findings; 2) Quantify the bulk sampling vo-lume of the four ECH2O soil moisture sensors.
2. Experimental Methods
The quantification of the bulk sampling volume was performed using two extreme materials, i.e., air and water. Air and water have dielectric constants of 1 and 81,
re-spectively. The typical range of apparent dielectric constant of soil is 3-35, thus, we as-sumed that the sampling volumes determined using air and water would be valid in soils. Figure 1 shows the two TDR and four ECH2O sensors that were tested together with the selected dimensions.
length, L (cm) spacing, S (cm) diameter/width, D (cm) CS-640 3 7.5 1.5 0.318 CS-630 3 15 0.75 0.159 EC-5 2 5.5 (9 *) 1 0.5 TM 3 5.3 (11.3 *) 1 0.5 5TE 3 5.3 (11.3 *) 1 0.5 10HS 2 10.3 (16.3 *) 2.2 1
* including sensor head
prong dimensions sensor type no. of
prongs, N
Figure 1. Sensors tested: from left, TDR CS640, CS630, ECH2O EC-5, TM, 5TE, and 10HS.
For each of the sensors shown in Figure 1, the sampling volume was determined for the configurations illustrated in Figure 2a. A sensor was set horizontally (Cases 1 and 2) or vertically (Case 3) above the air-water interface in a bucket. Starting suffi-ciently far from the interface, (the distance X is negative) X was varied in small incre-ments as shown in Figure 2b. At each step, the sensor reading was recorded. Extreme care was taken in measuring X when the prongs were partially in contact with water be-cause a meniscus was formed around the partially submerged prong which often made it difficult to read correct values of X. Measurements were taken until the sensor was completely submerged in water and no further change in sensor output was observed. In this study, we defined the bulk sampling volume to be the X values at which the sen-sor readings showed an “abrupt” change. That is, we determined L1, L2, and L3 values
for different configurations as defined in Figure 2a. This procedure was then repeated for different types of sensors. For the ECH2O sensors only, two sub-cases were consi-dered for Case 1; the plus prong on top of the ground prong (Case1a), and vice versa (Case 1b).
X
Case 1 Case 2 Case 3
water air
sampling volume
(a) Tested sensor configurations and sampling volume dimensions
L1 L2 L3 X < 0 X > 0 X = 0 X = 0 (b) Measuring steps Case 1 Case 3 X < 0 X > 0
Figure 2. Tested sensor configurations and measuring steps. Case 2 was performed similar to Case 1. For
the 3-prong sensors, the distance X is from the center of the center prong. Petersen (1995) performed on-ly Case 2 for 2-prong TDR probe using wet soil-air interface.
The TDR probes were connected to a TDR100 system (Campbell Scientific, Inc.). The ECH2O sensors were connected to an Em50 data logger (Decagon Devices, Inc.).
All experiments were performed in the laboratory where ambient temperature was about 23 °C. Water temperature was 21 °C throughout the experiments.
3. Results and Discussion
3.1. Validation using conventional TDR probes
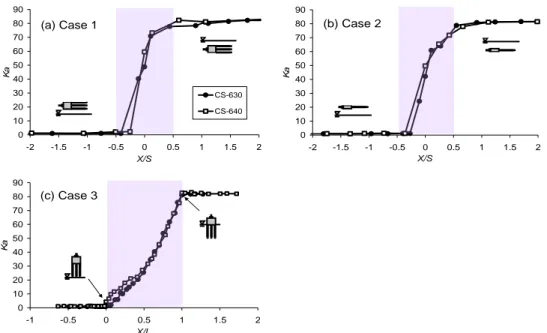
Discussions on the sampling volume of TDR probes were typically made with re-spect to the prong spacing S. Figures 3a and 3b shows the recorded sensor reading (di-electric constant, Ka) as a function of distance X normalized by prong spacing S for
Cases 1 and 2. The change in Ka was observed roughly within the shaded range of X/S.
When normalized by S, the behavior for CS630 and CS640 probes were nearly identical. Interestingly, both graphs show that the major change in Ka occurred within ± 0.5 X/S,
which suggests the center plus prong is controlling the sensitivity of the entire sensor and the ground prongs do not have practical sensitivity under the conditions that we employed in this study. A slight change observed for 0.5 < X/S < 1.0 may still be cap-tured by numerical quantifications. However, the contribution would probably be mi-nimal in practical applications. Figure 3c shows Ka as a function of X normalized by
the prong length L. The sensitivity is nearly proportional to the fraction of the prong in water and the sensitivities of the sensor head and beyond the end of the prongs are prac-tically negligible. In summary, the bulk sampling volume of the TDR probes is roughly a cylinder around the center plus prong with a diameter equal to the prong spacing. Al-though the sensitivity of the ground prongs was not detectable, our results are reasona-bly in good agreement with the findings in literature. This justifies that our experimen-tal approach is valid for quantifying the bulk sampling volume.
0 10 20 30 40 50 60 70 80 90 -2 -1.5 -1 -0.5 0 0.5 1 1.5 2 X/S Ka CS-630 CS-640 (a) Case 1 0 10 20 30 40 50 60 70 80 90 -2 -1.5 -1 -0.5 0 0.5 1 1.5 2 X/S Ka (b) Case 2 0 10 20 30 40 50 60 70 80 90 -1 -0.5 0 0.5 1 1.5 2 X/L Ka (c) Case 3
Figure 3. Sensor readings Ka as a function of X /S for (a) Case 1, (b) Case 2, and as a function of X/L for Case 3.
3.2. Bulk sampling volumes for ECH2O sensors
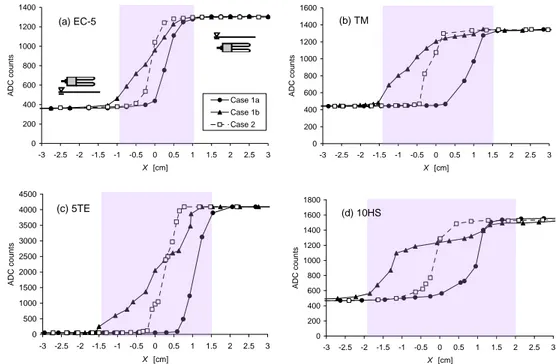
Physical dimensions of the ECH2O sensors are fixed in the sense that the user cannot choose arbitrary dimensions. Therefore, the results were analyzed in terms of the actual distance X rather than those normalized by S. Figure 4 shows the recorded sensor readings (Analog-to-Digital Counts, or ADC counts, also referred to as Raw in the user’s manuals) as a function of X for the horizontal (Cases 1a, 1b, and 2) configura-tions. The shaded portion in each graph corresponds to the range of X values where an abrupt change in the sensor readings was observed. The values of L1 and L2 (as defined
in Figure 2) estimated from the results are summarized in Table 1. In general, results for Cases 1a and 1b suggest that the plus prong exhibits high sensitivity over the ground prong. That is, when the plus prong is in air and the ground prong in water (Case 1a), the ground prong’s contribution seems to be very small. However, the sensitivity of the ground prong becomes somewhat significant when the plus prong is in water and the ground prong is in air (Case 1b). The upward kink in Case 1b for 10HS at about X = -1 cm is due to the meniscus formed on the surface of the plus prong which led to some-what higher readings. For Case 2 configurations, an abrupt change in sensor readings was observed within a smaller range (L2) as summarized in Table 1.
0 200 400 600 800 1000 1200 1400 -3 -2.5 -2 -1.5 -1 -0.5 0 0.5 1 1.5 2 2.5 3 X [cm] A D C c ount s Case 1a Case 1b Case 2 (a) EC-5 0 200 400 600 800 1000 1200 1400 1600 -3 -2.5 -2 -1.5 -1 -0.5 0 0.5 1 1.5 2 2.5 3 X [cm] AD C c ounts (b) TM 0 500 1000 1500 2000 2500 3000 3500 4000 4500 -3 -2.5 -2 -1.5 -1 -0.5 0 0.5 1 1.5 2 2.5 3 X [cm] ADC coun ts (c) 5TE 0 200 400 600 800 1000 1200 1400 1600 1800 -3 -2.5 -2 -1.5 -1 -0.5 0 0.5 1 1.5 2 2.5 3 X [cm] A DC c o u n ts (d) 10HS
Figure 4. Sensor readings (ADC) as a function of X for horizontal configurations (Cases 1a, 1b, and 2).
Figure 5 presents the sensor readings as a function of X for the vertical configura-tions (Case 3). The general trend is similar to that for TDR probes (Figure 3c). Three of the sensors (EC-5, TM, and 10HS) showed small sensitivity (ADC smaller by 3-5 % compared to when the entire sensor was submerged under water) in their sensor head. The half of the sensor head of 5TE showed a significant sensitivity (ADC smaller by 34 %). The estimated L3 values are also provided in Table 1.
0 200 400 600 800 1000 1200 1400 -5 -2.5 0 2.5 5 7.5 10 12.5 X [cm] AD C count s (a) EC-5 0 200 400 600 800 1000 1200 1400 1600 -5 -2.5 0 2.5 5 7.5 10 12.5 X [cm] ADC c o unts (b) TM 0 500 1000 1500 2000 2500 3000 3500 4000 4500 -5 -2.5 0 2.5 5 7.5 10 12.5 X [cm] AD C coun ts (c) 5TE 0 200 400 600 800 1000 1200 1400 1600 1800 -5 0 5 10 15 20 25 X [cm] A DC c ount s (d) 10HS
Figure 5. Sensor readings (ADC) as a function of X for vertical configuration (Case 3). Table 1. Estimated bulk sampling volume dimensions.
sensor type L1 (cm) L2 (cm) L3 (cm)
EC-5 2 1 5.5 (9 *)
TM 3 1 5 (11 *)
5TE 3 1 7.5 **
10HS 4 2 10 (16 *)
* including sensor head with slight sensitivity ** 1/2 of sensor head has significant sensitivity
4. Summary
We have quantified the bulk sampling volume of four different types of recently de-veloped ECH2O soil moisture sensors (EC-5, TM, 5TE and 10HS). Due to the asym-metric characteristics and sensitivity in the sensor head, we adopted a classical experi-mental method used in TDRs. Using two commercially available conventional TDR probes, the experimental methodology was validated to yield sampling volumes that were consistent with the previous findings.
Although the ECH2O sensors showed higher sensitivity around the plus prong as expected, we were able to determine the bulk sampling volumes in terms of three cha-racteristic dimensions (L1-L3) defined in Figure 2a. At some large distances, very small
sensitivity was observed. However, abrupt changes in the sensor readings were general-ly limited to within smaller distances (order of ~1 to 2 cm) from the prongs. In practical applications, we believe that the small sensitivity outside the estimated sampling vo-lume characterized by L1-L3 will have minimal effects on the sensor readings. The
sen-sor head also exhibited some sensitivity; especially, the first half of the 5TE sensen-sor head showed very high sensitivity. This suggests that care must be taken when
instal-ling/calibrating these sensors as the output values can be somewhat different depending on if the sensor head is embedded in the material of interest or not.
These findings will be useful in the development of experimental methods to moni-tor soil moisture in heterogeneous soil tanks to investigate soil moisture distribution in the shallow subsurface subjected to natural boundary conditions at the
land-atmospheric interface.
Acknowledgments. This research was funded by the United States Army Research
Of-fice award W911NF-04-1-0169.
References
Baker, J. M., and R. J. Lascano, 1989: The spatial sensitivity of time-domain reflectometry. Soil Sci. Soc. Am. J., 147(5), 378-384.
Ferré, P. A., J. H. Knight, D. L. Rudolph, and R. G. Kachanoski, 1998: The sample areas of conventional and alternative time domain reflectometry probes, Water Resour. Res., 34(11), 2971–2979.
Knight, J. H., 1992: Sensitivity of time domain reflectometry measurements to lateral variations in soil water content, Water Resour. Res., 28(9), 2345–2352.
Knight, J. H., I. White, and S. J. Zegelin, 1995: Sampling volume of TDR probes used for water content monitoring, in Proceedings of the Symposium: Time-Domain Reflectometry Appli-cations in Soil Science, SP Rep. 11, vol. 3, edited by L. W. Petersen and O. H. Jacobsen, pp. 45– 56, Dan. Inst. of Plant and Soil Sci., Lyngby, Denmark.
Knight, J. H., P. A. Ferré, D. L. Rudolph, and R. G. Kachanoski, 1997: A numerical analysis of the effects of coatings and gaps upon relative dielectric permittivity measurement with time domain reflectometry, Water Resour. Res., 33(6), 1455–1460.
Petersen L. W., 1995: Sampling volume of TDR probes used for water content monitoring: Practical investigation, in Proceedings of the Symposium: Time-Domain Reflectometry Applications in Soil Science, SP Rep. 11, vol. 3, edited by L. W. Petersen and O. H. Jacob-sen, pp. 57– 62, Dan. Inst. of Plant and Soil Sci., Lyngby, Denmark.
Robinson, D. A., S. B. Jones, J. M. Wraith, D. Or, and S. P. Friedman, 2003: A review of ad-vances in dielectric and electrical conductivity measurement in soils using time domain ref-lectometry, Vadose Zone J., 2, 444–475.
Topp, G. C., J. L. Davis, and A. P. Annan, 1980: Electromagnetic determination of soil water content: Measurements in coaxial transmission lines. Water Resour. Res., 16(3), 574-582. Sakaki, T., 1996: Quantitative evaluation of sampling volume of TDR-probes for soil water
content measurement by numerical analysis (in Japanese), paper presented at 31st Japan Na-tional Conference on Geotechnical Engineering, 2073-2074, Jpn. Geotech. Soc., Hokkaido, Japan.