Journal Pre-proof
Estimation of main aquifer parameters using geoelectric measurements to select the suitable wells locations in Bahr Al-Najaf depression, Iraq
Zaidoon Taha Abdulrazzaq, Nadhir Al-Ansari, Nadia Ahmed Aziz, Okechukwu Ebuka Agbasi, Sunday Edet Etuk
PII: S2352-801X(20)30088-6
DOI: https://doi.org/10.1016/j.gsd.2020.100437 Reference: GSD 100437
To appear in: Groundwater for Sustainable Development
Received Date: 12 March 2020 Revised Date: 14 May 2020 Accepted Date: 25 June 2020
Please cite this article as: Abdulrazzaq, Z.T., Al-Ansari, N., Aziz, N.A., Agbasi, O.E., Etuk, S.E., Estimation of main aquifer parameters using geoelectric measurements to select the suitable wells locations in Bahr Al-Najaf depression, Iraq, Groundwater for Sustainable Development (2020), doi: https://doi.org/10.1016/j.gsd.2020.100437.
This is a PDF file of an article that has undergone enhancements after acceptance, such as the addition of a cover page and metadata, and formatting for readability, but it is not yet the definitive version of record. This version will undergo additional copyediting, typesetting and review before it is published in its final form, but we are providing this version to give early visibility of the article. Please note that, during the production process, errors may be discovered which could affect the content, and all legal disclaimers that apply to the journal pertain.
Estimation of Main Aquifer Parameters Using Geoelectric Measurements to
Select the Suitable Wells Locations in Bahr Al-Najaf Depression, Iraq
Zaidoon Taha Abdulrazzaq a, Nadhir Al-Ansari b, *, Nadia Ahmed Aziz a, Okechukwu
Ebuka Agbasi c, Sunday Edet Etuk d
a Directorate of Space and Communications, Ministry of Science and Technology, Baghdad 10070, Iraq;
zaidoon.taha@live.com; nadia_naa@yahoo.com.
b
Department of Civil, Environmental and Natural Resources Engineering, Lulea University of Technology, 97187 Lulea, Sweden; nadhir.alansari@ltu.se.
c Michael Okpara University of Agriculture, Department of Physics, Umudike, Nigeria; ebukasean09@yahoo.com. d University of Uyo, Department of Physics, Uyo, Nigeria; sunetuk2002@yahoo.com.
*Corresponding authors e-mails: nadhir.alansari@ltu.se
Abstract
The aquifer parameters like hydraulic conductivity and transmissivity are extremely important for the management and development of groundwater resources. Vertical Electrical Sounding (VES) and 2D Electrical Resistivity Imaging (ERI) techniques were adopted for geophysical investigation in Fadaq plantation area within Bahr Al-Najaf depression, Iraq. A total of 22 VES point distributed as a grid along six profiles in the plantation with half-current electrode spacing (AB/2) is 400 m are used to evaluate the aquifer geoelectric and hydraulic parameters, where six 2D ERI profiles were conducted and concatenated as one 2D ERI profile with a total length of 4525 m to verify the results of VES. The average formation factor of the aquifer is 22.33 with porosity and water saturation average of 22.62 % and 0.59% respectively. Geoelectric and hydraulic parameters estimated values are; apparent resistivity 2.17–2.92 Ω, formation factor 6.23–31.18, porosity 17.91–40.06 %, water saturation 0.18–0.85, longitudinal conductance 1.60–10.06 Ω-1, transverse resistance 3258– 27200
Ωm2, hydraulic conductivity 0.62–0.68 m2/day and transmissivity 70.68–198.05 m2/day. The thickness and bulk resistivity vary between 112–320 m and 18–85 Ωm respectively. About 26% of the aquifer in the study area has an intermediate designation, while 73.91 % of the aquifer has high designation. There is a linear relationship between transmissivity and water saturation. Based on designation, protective capacity, and groundwater supply potential VES 6C, VES 7A, VES 4C and VES 2E were recommended for new drilling sites.
Keywords: Aquifers; Fadaq Plantation; VES; 2D ERI concatenated profile; Transmissivity
1. Introduction
Water is an essential element of life; however, there is a gradual decrease in the global resources of water (Hasan et al., 2018; Agbasi et al., 2019), especially in the arid and semi-arid areas (Abdullah
2 et al., 2019). This universal water crisis is evident in Iraq in the form of the gradual degradation of the Euphrates and Tigris rivers over the last four decades. This problem coincides with a significant rise in Iraq’s population, increasing water demand and lack of scientific planning for water resources management (Alwan et al., 2019). One prominent example in Iraq is Bahr Al-Najaf depression that suffers from many shortages in surface water quantities in spite of the seasonal income of surface waters by means of the existing ephemeral wadies. This is because of its geographic location (near the Southern Desert), away from surface water resources (Thabit et al., 2018), groundwater such as the artesian, self-flowing wells and the springs are the major water sources for domestic, industrial and agricultural uses in this area (Al-Shemmari, 2012). Groundwater is the world's second largest reserve of freshwater, accounting for 12%. The largest resource is water locked as ice (87%), while surface water accounts for about 1% of the world's freshwater reserves only (Gleick, 2011). Accordingly, groundwater emerges as an ideal alternative to surface water to reduce the shortage. It is widely available, has an excellent natural quality and relatively low capital cost of development.
Vertical Electrical Sounding is the detection of the surface effects generated by the flow of electric current inside the earth. It is one of the most suitable methods for groundwater investigation in the most geological occurrence (Battacharya and Patra, 1968; Yadav and Abolfazli, 1998) due to the simplicity of technique and low cost compared to other geophysical methods (Abdulrazzaq et al., 2019; Aziz et al., 2019).
Aquifer parameters are an essential tool for managing groundwater potentials. These parameters are mostly estimated by the pumping tests. Usually, these approaches are time-consuming; besides, most wells lie in very far locations in the desert, which may create further difficulties. A correlation between the geoelectric and hydraulic parameters of an aquifer can be used to replace the pump test. This also makes a hydro geophysical model to show the fundamental agents, which may govern the hydraulic behavior of any aquifer (Vereecken et al., 2006). This approach could be applied to gather information about the hydro geophysical characterization of the aquifer in a studied area.
Kelly (1977); Kosinski and Kelly (1981); Sinha et al. (2009), on their studies have shown an equation that correlates the geoelectrical and hydraulic parameters of aquifers. While Urish (1981); Worthington (1993); Mazac et al. (1995) reported relationships between aquifer resistivity and hydraulic conductivity. Aquifer characteristics and electrical parameters of the geoelectrical layers have been studied by many researchers e.g. (Batte, et al., 2008; Chandra, et al., 2008; Massoud, et al., 2010; Abdulrazzaq, 2011; Asfahani, 2012; Sikandar and Christen, 2012; Olatunji and Musa,
3 2014; Okiongbo and Mebine, 2015; Agbasi and Etuk, 2016; Khalil, 2016; Choudhury, et al., 2017). According to Niwas and Singhal (1981); Singhal and Niwas (1983); Mbonu et al. (1991), the geological setting and groundwater characteristics remain reasonably constant within the area of interest, so the relationships between the hydraulic and geoelectric parameters of the aquifer can be deduced practically.
The area studied has special importance, as it is one of the attraction sites for religious tourists in Iraq due to the Tomb-shrine of Imam Ali Bin Abi Talib, one of the Muslim caliphs. It is considered as an essential source to enhance the national income and to support the national economy, as it opens a wide range of work and investment for human potentialities. One aspect of successful tourism is to provide and satisfy the needs of tourists and shrine -visitors for food. For the sake of varied and good meals, the Alawi Shrine administration in Najaf Governorate has released Fadaq Plantation Project, one of the great development projects, which is located 45 km to the south-west of Najaf city. Where soil, water and climate are of agreeable effect on products. The total area of the plantation is 8000 km2. The project consists generally of two parts: the first is the animal product, which includes cattle breeding (cows, sheep calves) in addition to plant products, which includes green forage like berseem and clover and dry forage like barley; the second part consists of garden product, which includes vegetables planting in plastic hothouses during summer and winter. It was planned by the Alawi Shrine administration, in case of success of this plantation project, to extend the idea by setting up many similar groundwater-fed projects. As this could exert a high burden on the groundwater aquifer in the region, it was scheduled to utilize the land gradually by dividing the plant into three parts commencing from the Southern part. However, several exhausted, unproductive wells have resulted from the application of random drilling. Accordingly, it is essential to choose new, high-productivity wells to avoid losses and replication of these mistakes. This study aims to estimate the main aquifer parameters at Fadaq plantation and use it as a guide to developing a plan for drilling new productive wells for irrigations and permanence of the plantation.
2. Materials and Methods
2.1 Site description
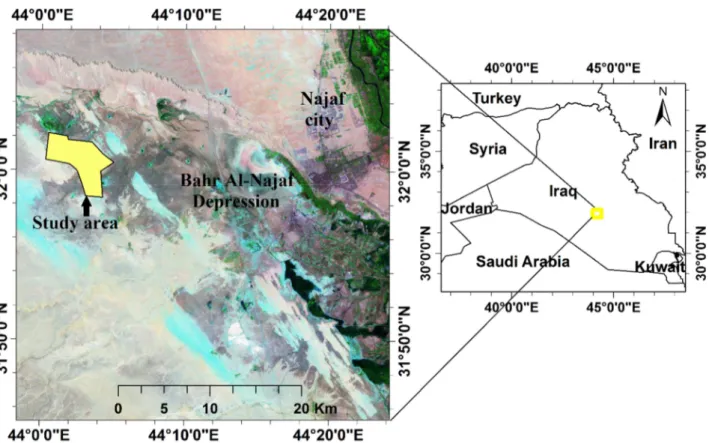
Fadaq plantation is located in Bahr Al-Najaf depression, specifically in Al-Rehiama area, which is administratively part of Najaf governorate (Fig. 1), within longitudes 44° - 44° 5' E and latitudes 31° 58' - 32° 3' N; 35 km off the city center towards Bahr Al-Najaf. Generally, it is an open flat land with little undulation and covered with soil. The surface has a little gradual gradient of around
4 4 degrees to the East from SW to NE. The utmost height of the area is around 60 meters above sea level. As for tectonic aspect, the study area is located in a sedimentary plain not liable to folds, and considered as part of Al-Salman zone within the stable shelf area, as per the geologic and tectonic division. Moreover, it is a zone that keeps the stable shelf apart from the unstable shelf (Jassim and Goff, 2006).
The area of Bahr Al-Najaf and the surrounds were not been afflicted by tectonic significant events for a long period, except for Sinjar heights and west desert during the Tertiary epoch. Due to several significant tectonic events, Abu-Jir fault system evolved the main system of deep faults stretching towards NW-SE (Abdel Razak, 1980). The area is privileged by a high rate of erosion to SW direction of the area where rocky nature of the ground appears on the surface with a little amount of soil, which was of great effect to form several valleys in the area; while erosion factors decrease towards North and East due to the great thickness of surface soil (Ali, 2012).
Fig. 1: The location of Fadaq plantation (study area) within Bahr Al-Najaf depression
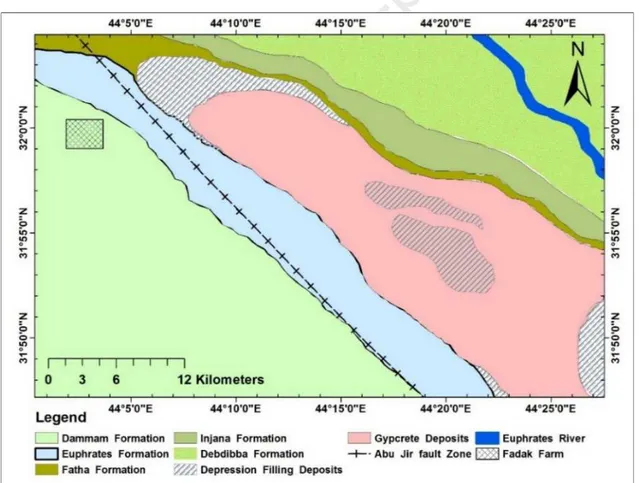
Many geological formations are apparent in the study area (Fig. 2), whose ages range from Tertiary rocks to the Quaternary deposits (Al-Suhail, 1996), which are mostly covered by recent deposits
5 where Al-Dammam formation is apparent, which is considered as an important underground water layer in the Arabic Desert areas (Aziz et al., 2018).
Geomorphologically, the area consists of two main units: the sedimentary plain and the desert plain. Sedimentary plain: geomorphological formations for this unit is of riverine and aerial origin formed by accumulatively (sedimentary) by the erosion and the human factor. These materials filling the sedimentary plain, while in aero-origin geomorphological formation might be recognizable in shape of dunes and sand sheets which represent the geomorphological units; but irrigation channels are considered as human activities as they are spread out on the flood plain. Although the area has dried desert climate, a rainfall sometimes happens as sporadic heavy flushes, which lead to surface patterns with many ephemerals and some perennial wadies (Al-Amiri, 1978). There is a widespread of old springs but most of them have dried due to the reduction of the aquifer pressure as a result of the increase in random drilling (Al-Shemmari, 2012).
Fig. 2: The geological map of Bahr Al-Najaf depression (Barwary and Nasira, 1996)
The climate of the region follows the same conditions of the west desert in terms of temperature degrees, humidity and rainfall. It is featured by cold winter of little rain and dry hot summer. The
6 area is featured, according to Iraq Atlas (1971-2000), by an average annual temperature of 38°C, the average annual relative humidity of 41%, average annual evaporation of 3.45 mm, average annual rainfall of 100 mm (Abdulrazzaq et al., 2019), average annual aridity of 34 (Alwan et al., 2019) and an average annual wind speed of 3.4 m/second.
The topographic slope is usually coincident with the structural dip of the subsurface strata, which follow the normal stratigraphic column of Iraqi Desert that Bahr Al-Najaf is part of it (Lateef and Barwary, 1984). In addition, there is a subsurface pattern of flow due to the infiltration of runoff water through near-surface fractures and joints in many areas. In addition to the underground drainage that comes from the huge regional aquifer which extends into Saudi Arabia by the effect of deep faults and fractures, which develop to dissolution channels.
The hydrogeology setting of the area represents a part of the southern desert area, which is a wide plateau tectonically (structurally) and considered within the stable shelf. Hydrogeological classification of the rocks is done by resting on hydro-geological properties of those rocks, their rocky composition and the volumetric distribution of their constituents. Al-Dammam formation represents the main aquifer of the area which consists of soluble calcareous stones. Porosity varies from a place to another as a result of caving and cracking in rocks, and most of the cavitation and high permeability processes occur near the underground water level within the formation as they are affected by water level instability and flow movement within the formation. In general, permeability gets decreased with depth, and high permeability occurs in subsided areas and valleys where water moving and rotating processes occur in those areas (Al-Rawi et al., 1983). The main source to feed the aquifer in Al-Dammam formation is rainfall in addition to valley water penetrating into depths during the season of flow. Overall, Al-Dammam formation covers impermeable layers in most of the areas located near the drainage areas, and that water in this formation is of the constrained type.
Calcareous stones permeability depends on several factors as rocky and structural composition added to cavitation property that features these stones. In general, calcareous stones represented by limestone, dolomite, gypsum and evaporates represented by anhydrite, which is of high ability to dissolve in water (Barwary and Slewa, 1994). Sub-permeability in these stones depends on several factors; the most important are: stones capacity to dissolve, climate conditions, the existence of acid solutions, the existence of faults and partitions and cracks and cavities in the mother-stones, the synthetic and structural status of the area, geomorphology of the area and the movement of surface
7 and underground water. Consequently, these factors affect calcareous stones, which contains water, and lead to an increase in their permeability and water flows in them.
2.2 Data Acquisition and Analysis
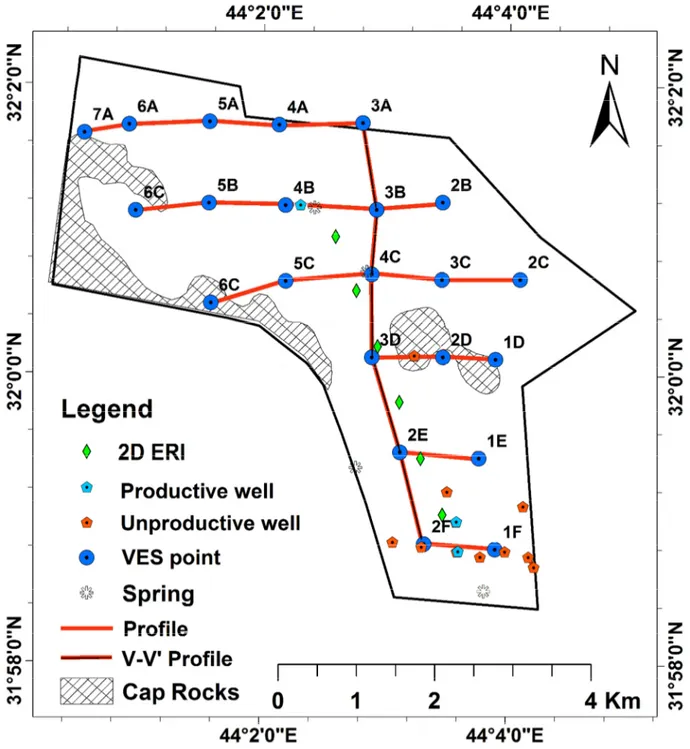
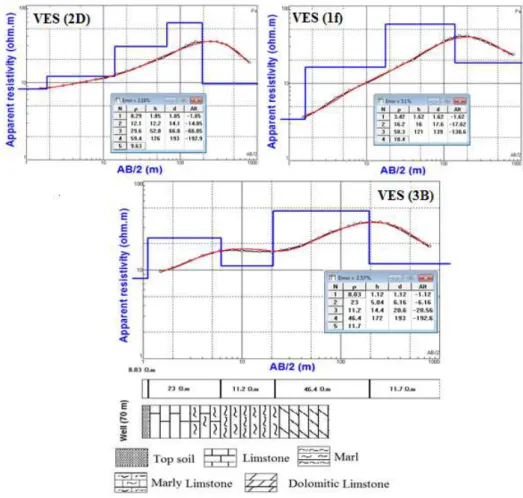
The study includes applying the VES technique using the symmetrical Schlumberger configuration in Fadaq plantation area for the purpose of drilling new irrigations wells. The apparent resistivity measured in 22 VES points, distributed evenly (the distance between the profiles was one km) as a grid across the plantation area on six profiles (AA, BB, CC, DD, EE and FF) using ABEM Terrameter LS1 resistivimeter to obtain a possible coverage of the plantation (Fig. 3). The spreading of current electrodes (AB/2) reached a distance up to 400 m, and a distance of 100 m is reached for the spreading of voltage electrodes (MN/2); thus, a depth penetration of 320 m is obtained. Field curves of VES points are interpreted quantitatively using IPI2win software (Fig. 4) to find out the values of quantitative resistivity and thickness of the electrical zones.
The choice of the appropriate number of VES points and the distance between them is very important in terms of the cost and result's accuracy. Reducing the distance between points requires an increase in the number of measured VES points, leading to a more expensive survey. While increasing the distance between VES points will reduce the measured points, reducing results accuracy. Hence, 22 VES points were selected, with a distance of 1 km separating them, in order to obtain the best results at a relatively low cost.
The VES points were measured separately, so the linking of VES points as a profile is optional and depend on the purpose of linking in a specific direction. The West-East direction was chosen to link the VES profiles to indicate the lateral extension of the aquifer in the study area. Another profile, namely V-V' was produced from the 3A, 3B, 4C, 3D, 2E, 2F VES points, which extend from South to North of the study area to indicate the extension of the aquifer along the plantation.
To verify the results of VES, six 2D ERI profiles were conducted in one sequence using Wenner- Schlumberger array by 61 electrodes ABEM Terrameter LS1 multi-electrode resistivity system. The length of each profile was 800 m with 75 m overlapped distance, and the electrode spacing was 10 m. Wenner-Schlumberger array is moderately sensitive to both horizontal and vertical structures, as the array represents adequate signal/noise ratio, an important parameter in low-resistivity
8 environments, it also provides adequate resolution (Ward, 1989; Dahlin and Zhou, 2004). Few bad data points appeared and were manually removed, as shown in Figure 5.
9
Fig. 4: VES quantitative interpretation from IPI2win
10
2.3 Geo-Hydraulic Parameters
Hydraulic parameters (longitudinal conductance, transverse resistance, hydraulic conductivity and transmissivity) are used to estimate groundwater potential, the soil corrosivity and groundwater protective capacity. Hydraulic parameters are related to geoelectric parameters (thickness and apparent resistivity) as shown in equations 1-4.
S = h/ρ (1) S is the longitudinal conductance
R = hρ (2) R is the transverse resistance
T = Kh (3) T is the transmissivity of the aquifer
= 8 ∗ 10 . (4)
K is the hydraulic conductivity, ρ and h are apparent resistivity and thickness respectively.
The nature of the aquifer substratum is controlled by hydraulic conductivity (K) and geoelectrical resistivity (ρ). If the hydraulic unit and current flow are dominantly horizontal in a typical aquifer it indicates low resistivity substratum, the relationship between K and ρ is indirect. There is a linear connection between K and ρ, for substratum that has low resistivity. If an aquifer is transmitting at an all-out volume of water, it is likely that some possible recharge is being excluded in the recharge area. Aquifers in dry regions usually have a deep vadose zone in the recharge areas, indicating a lack in the amount of potential recharge (Fetter, 2014).
From Archie law (Archie, 1942), the resistivity of water saturated clay-free material can be defined as
= (5)
Where ρ0 = specific resistivity of water-saturated sand, ρw = specific resistivity of pore water, F = formation factor.
The formation factor (F) associations all properties of the material impelling electrical current flow like porosity ϕ, pore shape, and digenetic cementation.
11 When the medium is unsaturated, changing the amount of saturation changes the nominal porosity. It gives Archie’s equation, given below as
= ∅ ∗. ∗ (7)
Where ρ0 is the bulk resistivity, ρw is apparent, ϕ is the porosity, Sw is the water saturation, m and n are constants with respect to the rock type, and saturation index (equal 2). Worthington (1993); Vinegar and Waxman (1984); Börner et al. (1996); Huntley (1968), concluded that Archie’s law for water saturation is broken down into three cases: clay contaminated aquifer, partially saturated aquifer and freshwater aquifer.
From the hydraulic parameters, we can also determine the soil corrosivity, protective capacity, groundwater potential and designation. Soil corrosivity is a geologic hazard that affects buried metals and concrete that is in direct contact with soil or bedrock. Soil corrosion is a complex phenomenon, with a multitude of variables involved. Soil corrosivity was inferred from the resistivity values of the soil (i.e. the aquifer resistivity values). Table 1 below shows various soil corrosivity for different soil resistivity values (Oladapo et al. 2004; Ibanga and George, 2016).
Table 1: Classification of soil resistivity in terms of corrosivity (Baeckmann and Schwenk, 1997) Soil Resistivity (Ωm) Soil Corrosivity
< 10 Very strongly corrosive 10 – 60 Moderately corrosive 60 – 180 Slightly corrosive
≥ 180 Practically noncorrosive
The protective capacity rating was inferred from the calculated longitudinal conductance (S) using protective capacity rating as shown in Table 2 (Kumar et al., 2016), where S is the sum of all the thickness/resistivity ratios of n − 1 layers which overlie a semi-infinite substratum of resistivity ρn, such that S = h1/ρ1 + h2/ρ2 + h3/ρ3 + … + hn−1/ρn−1 (mho), where h1, h2, etc. are the depths and
ρ1, ρ2, etc. the resistivities, of successive layers. A knowledge of hi/ρi for the ith layer when it is
sandwiched between two layers of much higher resistivity is of importance in resolving the problem of equivalence (Henriet 1976; Obiora et al., 2015). Protective capacity rating is used to predict how safe a layer is as to if it can allow containments or collapses of the layer.
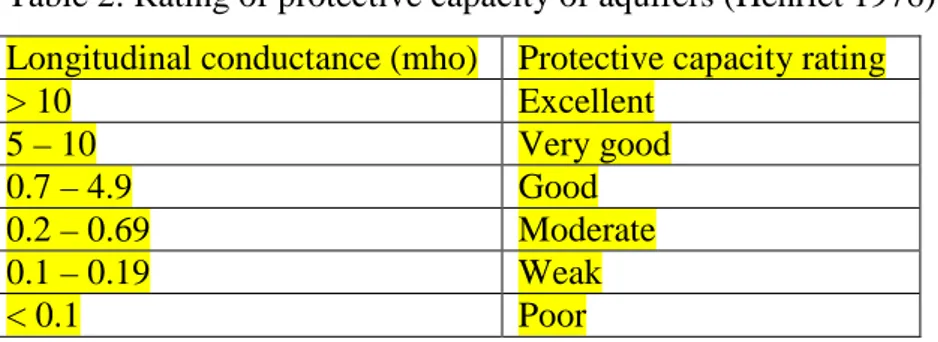
12 Table 2: Rating of protective capacity of aquifers (Henriet 1976).
Longitudinal conductance (mho) Protective capacity rating > 10 Excellent 5 – 10 Very good 0.7 – 4.9 Good 0.2 – 0.69 Moderate 0.1 – 0.19 Weak < 0.1 Poor
Designation infers to the ability for fluid flow between very high flow to impermeable (not allowing fluid flow). Groundwater supply potential indicates the withdrawal potential of groundwater supply (Krasny, 1993; Reddy, 2014). The designation and groundwater supply potential can be inferred from the values of transmissivity based on Krasny’s (1993) classification of transmissivity magnitude (Table 3). Transmissivity is equal to the product of the aquifer thickness (m) and hydraulic conductivity (K). Transmissivity describes the ability for fluid flow within the plane of the material and is defined as the in-plane permeability multiplied by the material thickness (Hudak, 2000; Kirsch et al., 2006).
Table 3: The classification of transmissivity magnitude (after Krasny, 1993) Transmissivity
(m/day)
Designation Groundwater Supply Potential
1000 Very high Withdrawal of great regional importance 100 – 1000 High Withdrawal of lesser regional importance
10 – 100 Intermediate Withdrawal of local water supply (Small community, plant etc) 1 – 10 Low Smaller withdrawal for local water supply (Private consumption) 0.1 – 1 Very low Withdrawal for local water supply (Private consumption)
< 0.1 Impermeable Sources for local water supply are difficult
3. Results and Discussion
3.1 Interpretation VES and ERI data
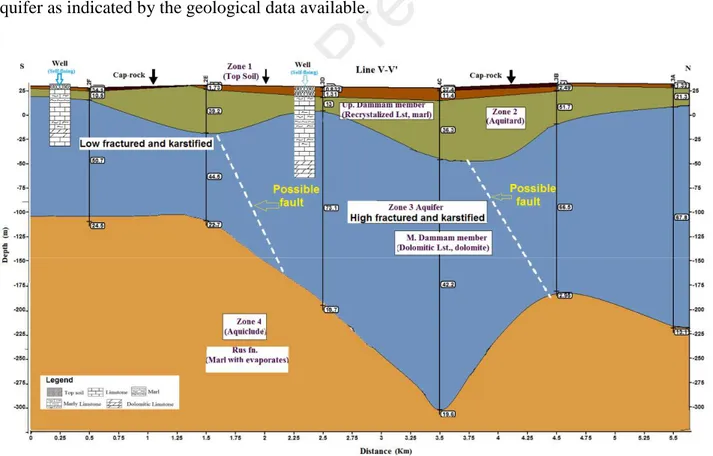
The VES points results show the presence of four geoelectrical zones. Resistivity values ranged between 0.8 – 150 ohm.m. The penetration depth of the VES is about 425 m, and the depth of the groundwater level ranged between 20-70 m. The first zone thickness is about 2 m, characterized by relatively low resistivity and represents top soil. The second zone has a moderate value of resistivity with a thickness range from 6 m to 42 m, which characterized by an impermeable layer of marl and recrystallized marly limestone of the upper member of the Dammam Formation. The third zone is carbonate rocks of the lower member of the Dammam Formation and represents the main aquifer in
13 the area, with thickness varied from 50 m to 275 m. The fourth zone is detected by VES only as an impermeable layer (Aquiclude) which consists of marl and evaporates and represents the Rus Formation (Fig. 7).
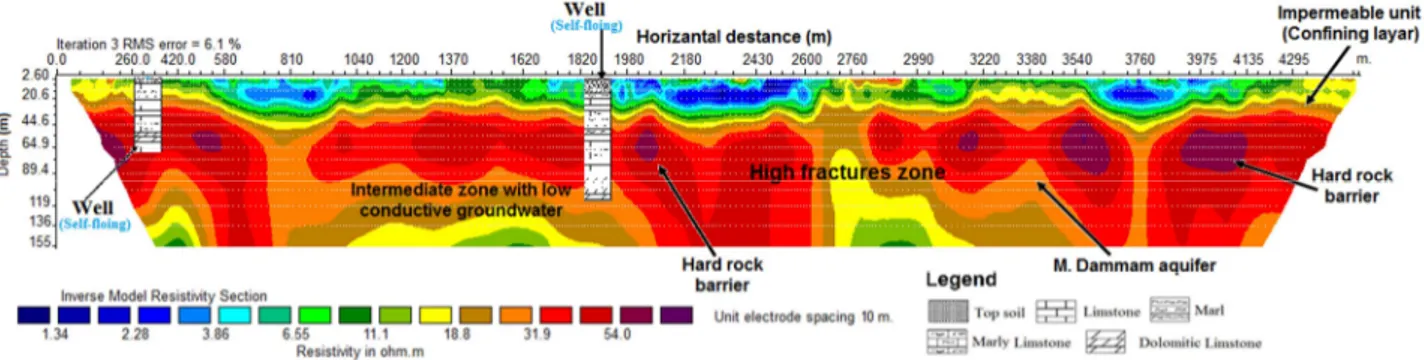
The ERI data were processed and interpreted using RES2DINV software, which provides the possibility of distributing resistivity values to the depths of investigation and the various geological strata. The six overlapped profiles were collected to produce one concatenation profile. The trend of this profile was from South to North with a total length of 4525 m, and the maximum depth of investigation is 155 m (Fig. 6). The resistivity values vary between 1.34 and 65 ohm.m. The root mean square (RMS) is 6.1 % after 3 iterations.
The VES and ERI profiles (Fig. 7 and 8) identified the high and low fractures in the study area due to the presence of the faults. Besides; they showed an increase in the areas of high fractures in the center and north part of the study area. The results of VES also showed a good agreement with the 2D ERI in determining the subsurface lithology of the area and the level of groundwater in the main aquifer as indicated by the geological data available.
14
Fig. 7: 2D ERI concatenated profile shows the high and low fractures areas along the study area
3.2 Hydraulic and geoelectric parameters
Hydraulic and geoelectric parameters which include the following; Porosity (ϕ), Formation Factor (F), Transmissivity (T), Water Saturation (Sw), Transverse Resistance (R) Hydraulic Conductivity
(K) and Longitudinal Conductance (S), are calculated for the aquifers identified in the study area using the Aquifer Thickness (h), Bulk Resistivity (ρ) and Apparent Resistivity (ρw), using equations
1–7, this is shown in Table 4. Table 5 shows the inferred aquifer properties (Soil Corrosivity, Protective Capacity, Groundwater Supply Potential, and Designation) assumed from the hydraulic and geoelectric parameters.
Table 4: The geoelectric parameters of the aquifer in the study area
VE S h(m) 0
ρ
(Ωm) S(Ω -1) R(Ωm2) K(m/day ) T(m2/day ) wρ
(Ωm) F Φ (%) Sw 3A 227.00 67.80 3.35 15390.60 0.63289 143.665 2.398 28.27 18.81 0.6 8 4A 305.00 65.70 4.64 20038.50 0.63462 193.558 2.401 27.36 19.12 0.6 6 5A 320.00 85.00 3.76 27200.00 0.61889 198.045 2.857 29.75 18.33 0.8 5 6A 219.00 81.00 2.70 17739.00 0.62212 136.244 2.775 29.19 18.51 0.8 1 7A 228.00 42.00 5.43 9576.00 0.65447 149.220 2.767 15.18 25.67 0.4 2 2B 125.00 77.90 1.60 9737.50 0.62463 78.079 2.498 31.18 17.91 0.7 8 3B 172.00 66.50 2.59 11438.00 0.63396 109.040 2.356 28.23 18.82 0.6 7 4B 172.00 46.40 3.71 7980.80 0.65074 111.927 2.876 16.13 24.90 0.4 6 5B 185.00 79.40 2.33 14689.00 0.62341 115.331 2.556 31.06 17.94 0.7 915 Table 5: The inferred aquifer properties.
VES Soil Corrosivity Designation Protective Capacity Groundwater Supply Potential 3A Slightly
Corrosive High Good
Withdrawal of lesser regional importance 4A Slightly
Corrosive High Good
Withdrawal of lesser regional importance 5A Slightly
Corrosive High Good
Withdrawal of lesser regional importance 6A Slightly
Corrosive High Good
Withdrawal of lesser regional importance 7A Moderately
Corrosive High Very good
Withdrawal of lesser regional importance 2B Slightly Intermediate Good Withdrawal of local water
6B 179.00 54.80 3.27 9809.20 0.64367 115.217 2.862 19.15 22.85 0.5 5 2C 132.00 53.90 2.45 7114.80 0.64443 85.064 2.901 18.58 23.20 0.5 4 3C 181.00 51.20 3.54 9267.20 0.64669 117.051 2.917 17.55 23.87 0.5 1 4C 257.00 42.20 6.09 10845.40 0.65430 168.156 2.671 15.80 25.16 0.4 2 5C 163.00 78.40 2.08 12779.20 0.62422 101.749 2.901 27.03 19.24 0.7 8 6C 181.00 18.00 10.06 3258.00 0.67521 122.214 2.889 6.23 40.06 0.1 8 1D 184.00 46.80 3.93 8611.20 0.65040 119.674 2.789 16.78 24.41 0.4 7 2D 126.00 59.40 2.12 7484.40 0.63983 80.619 2.457 24.18 20.34 0.5 9 3D 200.00 73.10 2.74 14620.00 0.62854 125.708 2.763 26.46 19.44 0.7 3 1E 238.00 72.00 3.31 17136.00 0.62944 149.807 2.812 25.60 19.76 0.7 2 2E 198.00 34.00 5.82 6732.00 0.66131 130.940 2.739 12.41 28.38 0.3 4 1F 121.00 58.00 2.09 7018.00 0.64100 77.561 2.167 26.77 19.33 0.5 8 2F 125.00 51.00 2.45 6375.00 0.64686 80.857 2.652 19.23 22.80 0.5 1 Mi n 112.00 18.00 1.60 3258.00 0.62 70.68 2.17 6.23 17.91 0.1 8 Ma x 320.00 85.00 10.06 27200.00 0.68 198.05 2.92 31.18 40.06 0.8 5 Av e 191.28 59.10 3.73 11725.51 0.64 121.97 2.66 22.33 22.62 0.5 9
16
Corrosive supply
3B Slightly
Corrosive High Good
Withdrawal of lesser regional importance 4B Moderately
Corrosive High Good
Withdrawal of lesser regional importance 5B Slightly
Corrosive High Good
Withdrawal of lesser regional importance 6B Moderately
Corrosive High Good
Withdrawal of lesser regional importance 2C Moderately
Corrosive Intermediate Good
Withdrawal of local water supply
3C Moderately
Corrosive High Good
Withdrawal of lesser regional importance 4C Moderately
Corrosive High Very good
Withdrawal of lesser regional importance 5C Slightly
Corrosive High Good
Withdrawal of lesser regional importance 6C Moderately
Corrosive High Excellent
Withdrawal of lesser regional importance 1D Moderately
Corrosive High Good
Withdrawal of lesser regional importance 2D Moderately
Corrosive Intermediate Good
Withdrawal of local water supply
3D Slightly
Corrosive High Good
Withdrawal of lesser regional importance 1E Slightly
Corrosive High Good
Withdrawal of lesser regional importance 2E Moderately
Corrosive High Very good
Withdrawal of lesser regional importance 1F Moderately
Corrosive Intermediate Good
Withdrawal of local water supply
2F Moderately
Corrosive Intermediate Good
Withdrawal of local water supply
Geoelectric parameters estimated values are; apparent resistivity 2.17–2.92 Ω, Formation factor 6.23–31.18, Porosity 17.91–40.06 %, Water Saturation 0.18–0.85, while for hydraulic parameters estimated values are; longitudinal conductance 1.60–10.06Ω-1, Transverse resistance 3258–27200
Ωm2, hydraulic conductivity 0.62–0.68 m/day2 and Transmissivity 70.68–198.05 m2/day. The thickness and bulk resistivity of the aquifer varies between 112.00 – 320.00 m and 18.00 – 85.00Ωm respectively. 26.08 % of the aquifers in Fadaq plantation have an intermediate designation, while 73.91 % of the aquifer has high designation. VES station 6C has excellent protective capacity, while VES station 7A, 4C and 2E have a very good protective capacity, and generally, the aquifer in the plantation considered to have a good protective capacity. 47.83 % of
17 the aquifers are slightly corrosive, with 52.17 % of the aquifer are moderately corrosive. The calculated value of the average porosity in the aquifer by applying Archie's equation is 22.62%. It is close to the porosity values of fractured dolomite and limestone 25 % and 30 %.
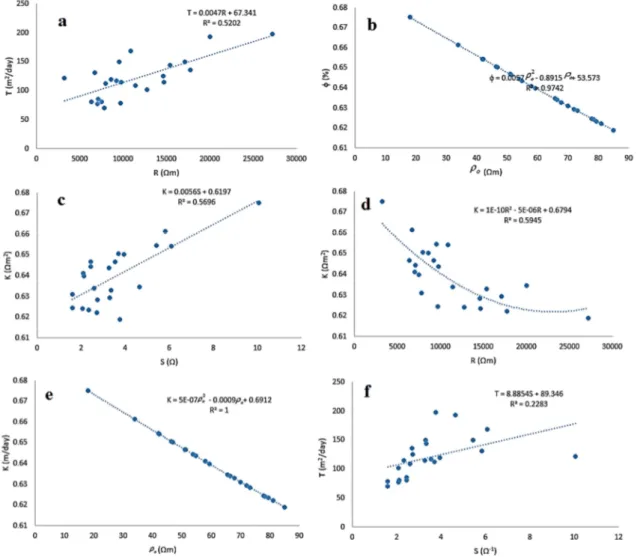
Figure 8 shows the relationship between the hydraulic parameters and the geoelectric parameters, the correlation between the two parameters shows a strong relationship between them, meaning that they depend on each other to determine aquifer parameters. Equations 8–13 shows some relationship between hydraulic and geoelectric parameters in the study area. Porosity, Hydraulic Conductivity and Transmissivity can be estimated from the equations above for VES stations within the study area.
= 0.047 + 67.341 (8) ∅ = 0.0057$%− 0.891$ (9) = 0.0056 + 0.6197 (10) = 1 ∗ 10 %− 5 ∗ 10 + 0.6794 (11) = 5 ∗ 10 ($%− 0.0009$ + 0.6912 (12) = 8.854 + 89.346 (13)
18
Fig. 8: The relationship between geoelectric and hydraulic parameters of the aquifer in the study
area. (a) Transmissivity against Transverse Resistance (b) Porosity against Bulk Resistivity (c) Hydraulic Conductivity against Longitudinal Conductance (d) Hydraulic Conductivity against Transverse Resistance (e) Hydraulic Conductivity against Bulk Resistivity (f) Transmissivity against Longitudinal Conductance.
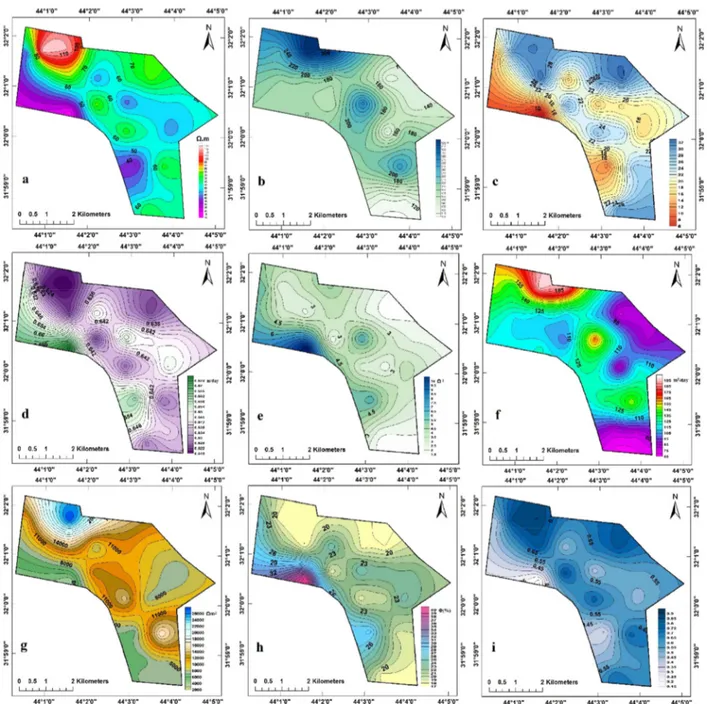
Figure 9 shows the contour maps of the geoelectric and hydraulic parameters estimated for the aquifer, along with the profiles AA, BB, CC, DD, EE and FF. The aquifer resistivity increases along profile AA, BB and DD with a decrease along profile CC, EE and FF. Along with profiles AA, BB, CC, EE and FF the thickness of the aquifer increases and decreases along profile DD. The formation factor of the aquifer increases along profiles AA, BB and DD and decreases along CC, EE and FF. Along with profiles CC, EE and FF the estimated hydraulic conductivity increases and decreases along profiles AA, BB, DD. For Longitudinal conductivity and Transmissivity; AA, BB,
19 EE and FF increases along the profile with a decrease along profiles CC and DD. Transverse resistance and water saturation increases along profiles AA, BB and DD and decreases along profile CC, EE and FF. The estimated porosity increases along profile CC and FF, it decreases along profiles AA, BB, DD and EE.
Fig. 9: Contour maps of the geoelectric and hydraulic parameters estimated for the aquifer; a:
Aquifer Resistivity; b: Aquifer Thickness; c: Formation Factor; d: Aquifer Hydraulic Conductivity; e: Aquifer Longitudinal Conductance; f: Aquifer Transmissivity; g: Aquifer Transverse Resistance; h: Aquifer Porosity; i: Aquifer Water Saturation.
20
4. Conclusions
The incorporation of VES and ERI data led to the identification of the main aquifer and the high and low fractures zones along the study area. VES survey delineated aquifer’s geoelectric and hydraulic parameters, including a correlation between some of the geoelectric and hydraulic parameters of the aquifer. The result shows a strong to a very strong correlation between the parameters. Aquifers in the study area are moderately corrosive, of high designation and have a good protective capacity. The formation factor of the aquifers in the study area range is 6.28–31.18, with an average of 22.33. The aquifers are found to be very porous, porosity range is 17.91–40.06, with an average of 22.62, while the water saturation in the aquifers range is 0.18–0.85 with an average of 0.59. More than 50 % of the aquifers have water saturation above the average. Majority of the aquifers are protected from contaminants due to their good, very good and excellent protective capacity rating. The aquifer in Fadaq plantation has a high and intermediate designation, which would serve a large community and are rechargeable.
Hydraulic parameters (Transmissivity, Hydraulic conductivity and Transverse resistance) help to reduce the additional expenditures of the pumping test and offer an alternative approach for estimating other hydraulic parameters, as it would give the estimation of the yield of a prospective well in the area before the drilling. It is concluded that the groundwater supply potential is between the withdrawal of lesser regional importance and withdrawal of local water supply.
References
Abdel Razak, M.I. (1980) A Magnetic Investigation in Rehaima Area South West Al-Najaf,M.Sc. Thesis, College of Science, University of Baghdad, Baghdad, Iraq, 171 p.
Abdullah, T.O., Ali, S.S., Al-Ansari, N.A. and Knutsson, S. (2019) Hydrogeochemical Evaluation of Groundwater and Its Suitability for Domestic Uses in Halabja Saidsadiq Basin, Iraq. Water, 11, 690.
Abdulrazzaq, Z.T. (2011) Application of Vertical Electrical Sounding to Delineate and Evaluate of Aquifers Characteristics in Baiji-Tikrit Basin. M.Sc. Thesis, College of Science, University of Tikrit, Iraq, 148 p.
Abdulrazzaq, Z.T. Hasan, R.H. and Aziz, N.A. (2019) Integrated TRMM data and Standardized Precipitation Index to Monitor the Meteorological Drought. Civil Engineering Journal, 5(7), 1590-1598.
21 Abdulrazzaq, Z.T., Al-Heety, A.J. and Shanshal, Z.M. (2019) Integration of 1D and 2D Electrical
Resistivity Techniques to Determine The Thickness and Extension of The Main Aquifer in Al-Rehaemia Area, Al-Najaf Governorate, Central Iraq. Iraqi Bulletin of Geology and Mining, 15 (1), 1-13.
Agbasi, O.E. and Etuk, S.E. (2016) Hydro-Geoelectric Study of Aquifer Potential in Parts of Ikot Abasi Local Government Area, Akwa Ibom State, Using Electrical Resistivity Soundings. International Journal of Geology and Earth Sciences. 2(4), 43-54.
Agbasi, O.E. Aziz, N.A. Abdulrazzaq, Z.T. and Etuk, S.E. (2019) Integrated Geophysical Data and GIS Technique to Forecast the Potential Groundwater Locations in Part of South Eastern Nigeria. Iraqi Journal of Science, 60(5), 1013-1022.
Al-Amiri, M. (1978) Structural Interpretation of the Land Satellite Imagery for the Western Desert, Iraq. GEOSURV, Internal report, No. 923.
Ali, B.M. (2012) Hydrogeological Study of Area between Najaf – Karbalaa Cities. Iraqi Journal of Science, 53(2), 353-361.
Al-Rawi, N., Al-Sam, S. and Shavarka, L. (1983) Hydrogeological and Hydrotechnical exploration in Block 1, 2, and 3 (Southern Desert); Final report on Hydrogeology, Hydrochemistry and water Resources, Vol.9, SOM. Lib., 204 p.
Al-Shemmari, A.N. (2012) Establishing Relations between Hydraulic Parameters and Geoelectrical Properties for Fractured Rock Aquifer in Dammam Formation at Bahr Al-Najaf Basin. Ph. D. Thesis, College of Science, University of Baghdad, Iraq, 149 p.
Al-Suhail Q.A. (1996) Evaluation of groundwater exploitation for agricultural development of Bahr Al- Najaf basin in western desert, Ph.D. Thesis, College of Science, University of Baghdad, Iraq. Alwan, I.A., Karim, H.H. and Aziz, N.A. (2019) Agro-Climatic Zones (ACZ) Using Climate
Satellite Data in Iraq Republic. IOP Conf. Ser.: Mater. Sci. Eng. 518, 022034. https://doi.org/10.1088/1757-899X/518/2/022034
Archie, G.E. (1942) The Electrical Resistivity Log as an Aid in Determining some Reservoir Characteristic. Trans. Am. Inst. Min. Eng. 146, 54-62.
Asfahani, J. (2012) Quaternary aquifer transmissivity derived from vertical electrical sounding measurements in the semi-arid Khanasser Valley Region, Syria. J. Acta Geophys. 60 (4), 1143-1158. https://doi.org/10.2478/s11600-012-0016-x
Aziz, N.A., Abdulrazzaq, Z.T. and Agbasi, O.E. (2019) Mapping of Subsurface Contamination Zone using 3D Electrical Resistivity Imaging in Hilla City/ Iraq. Environ. Earth Sci. 78: 502.
22 Aziz, N.A., Hasan, R.H. and Abdulrazzaq, Z.T. (2018) Optimum site selection for groundwater
wells using integration between GIS and hydrogeophysical data. Eng. Technol. J., 36, 596–602. Baeckmann, W. and Schwenk, W. (1997) Handbook of Cathodic protection. The theory and
practice of electrochemical corrosion protection techniques. Elsevier Inc, 3rd Edition, 568 p. https://doi.org/10.1016/B978-0-88415-056-5.X5000-X
Barwary, A.M. and Slewa N.A. (1994) The geology of Al-Najaf quadrangle sheet NH-38-2. The State Establishment of Geological Survey and Mining, Iraq. 20 p (unpublished report).
Barwary, A.M. and Slewa N.A. (1996) Geological Map of Al Najaf Quadrangle Sheet NH-38-2 of Scale 1:250 000. 1st. ed. GEOSURV, Baghdad, Iraq.
Battacharya, P.K. and Patra, H.P. (1968) Direct Current Geoelectrical Sounding. Elsevier Publishing Co., Amsterdam, 131 p.
Batte, A., Muwanga, A., Sigrist, P. and Owor, M. (2008) Vertical electrical sounding as an exploration technique to improve on the certainty of groundwater yield in the fractured crystalline basement aquifers of eastern Uganda. Hydrogeol. J. 16, 1683-1693. https://doi.org/10.1007/s10040-008-0348-4
Börner, F.D., Schopper, J. R., and Weller, A. (1996) Evaluation of transport and storage properties in the soil and groundwater zone from induced polarization measurements. Geophys. Prospect. 44 (4), 583–601. https://doi.org/10.1111/j.1365-2478.1996.tb00167.x
Chandra, S., Ahmed, S., Ram, A. and Dewandel, B. (2008) Estimation of hard rock aquifers hydraulic conductivity from geoelectrical measurements: A theoretical development with field application. J. Hydrol. 357, 218–227. https://doi.org/10.1016/j.jhydrol.2008.05.023
Choudhury, J., Kumar, K.L., Nagaiah, E., Sonkamble, S., Ahmed, S. and Kumar, V. (2017) Vertical electrical sounding to delineate the potential aquifer zones for drinking water in Niamey city, Niger. Africa. J Earth Syst Sci. 126, 91. https://doi.org/10.1007/s12040-017-0860-9
Dahlin, T. and Zhou, B. (2004) A numerical comparison of 2D resistivity imaging with 10 electrode arrays. Geophys Prospect 52:379–398. https://doi.org/10.1111/j.1365-2478.2004.00423.x
Fetter, C.W. (2014) Applied Hydrogeology. Fourth Edition. Pearson Education Limited, Edinburgh Gate, Harlow.
Gleick, P.H. (2011) Water resources: In Encyclopedia of Climate and Weather. Second edition, Oxford University Press, New York, pp.817-823.
Hasan, M., Shang, Y., Akhter, G. and Jin, W. (2018) Delineation of Saline-Water Intrusion Using Surface Geoelectrical Method in Jahanian Area, Pakistan. Water, 10, 1548.
23 Henriet, J.P. (1976) Direct application of Dar Zarrouk parameters in groundwater survey. Geophys.
Prospect. 24 344–353. https://doi.org/10.1111/j.1365-2478.1976.tb00931.x
Hudak, P.F. (2000) Principles of hydrogeology. Second edition, Lewis Publisher, Florida, USA, 204 p.
Huntley, D. (1968) Relation between Permeability and Electrical Resistivity in Granular aquifers. Groundwater, 24 (4), 466-474. https://doi.org/10.1111/j.1745-6584.1986.tb01025.x
Ibanga, J.I. and George, N.J.(2016) Estimating geohydraulic parameters, protective strength, and corrosivity of hydrogeological units: a case study of ALSCON, Ikot Abasi, southern Nigeria. Arab J Geosci. 9, 363. https://doi.org/10.1007/s12517-016-2390-1
Jassim, S.Z. Goff, J.C. (2006) Geology of Iraq. 1st edit., Dolin, Prague and Moravian Museum, Brno, Czech Republic, 408 p.
Kelly, W.E. (1977) Electrical resistivity for estimating permeability, Jour. Geotech. Eng. Div., 103 (10), 1165-1168.
Khalil, M.H. (2016) Hydraulic and electric anisotropy of shallow fresh coastal aquifer in Nabq, Sinai, Egypt. Arab J Geosci. 9, 284. https://doi.org/10.1007/s12517-016-2307-z
Kirsch, R., Ernstson, K., and, Yaramanci, U., (2006) Groundwater Geophysics A Tool for Hydrogeology. Springer Berlin Heidelberg, New York, 493 p. https://doi.org/10.1007/3-540-29387-6
Kosinski, W. K. and Kelly, W. E. (1981) Geoelectrical Sounding for Predicting Aquifer Properties. Groundwater, 18 (2), 163-171. https://doi.org/10.1111/j.1745-6584.1981.tb03455.x
Kumar, T.J.R., Balasubramanian, A., Kumar, R.S. et al (2016) Assessment of groundwater potential based on aquifer properties of hard rock terrain in the Chittar–Uppodai watershed, Tamil Nadu, India. Appl Water Sci. 6, 179–186. https://doi.org/10.1007/s13201-014-0216-4
Lateef, A.S. and Barwary, A.W. (1984) Report on the Regional Geological Mapping of Bahr Al Najaf area. Report no. 1327.
Massoud, U., Santos, F., Khalil, M.A., Taha. A. and Abbas, A.M. (2010) Estimation of aquifer hydraulic parameters from surface geophysical measurements: a case study of the Upper Cretaceous aquifer, central Sinai, Egypt. Hydrogeol J, 18 (3), 699-710. https://doi.org/10.1007/s10040-009-0551-y
Mazac, O., Kelly, W. E. and Landa, I. (1985) A hydrogeophysical model for relations between electrical and hydraulic properties of aquifers. J. Hydrol, 79, 1-19. https://doi.org/10.1016/0022-1694(85)90178-7
24 Mbonu, P.D., Ebeniro, J.O., Ofoegbu, C.O. and Ekine, A.S. (1991) Geoelectrical sounding for the
determination of aquifer characteristics in parts of the Umuahia area of Nigeria. Geophysics 56 (2), 284–291. https://doi.org/10.1190/1.1443042
Niwas, S. and Singhal, D.C. (1981) Estimation of Aquifer Transmissivity from Dar Zarrouk Parameters in Porous Media. J. Hydrol. 50, 393–399. https://doi.org/10.1016/0022-1694(81)90082-2
Obiora, D.N., Ajala, A.E. and Ibuot, J.C. (2015) Evaluation of aquifer protective capacity of overburden unit and soil corrosivity in Makurdi, Benue state, Nigeria, using electrical resistivity method. J Earth Syst Sci. 124, 125–135. https://doi.org/10.1007/s12040-014-0522-0
Okiongbo, K.S. and Mebine, P. (2015) Estimation of aquifer hydraulic parameters from geoelectrical method—a case study of Yenagoa and environs, Southern Nigeria. Arab J Geosci. 8 (8), 6085-6093. https://doi.org/10.1007/s12517-014-1671-9
Oladapo, M.I., Mohammed, M.Z., Adeoye, O.O., and Adetola, O.O. (2004) Geoelectric investigation of the Ondo State Housing Corporation Estate; Ijapo, Akure, Southwestern Nigeria. J Min Geol. 40 (1), 41–48. https://doi.org/10.4314/jmg.v40i1.18807
Olatunji, S. and Musa, A. (2014) Estimation of Aquifer Hydraulic Characteristics from Surface Geoelectrical Methods: Case Study of the Rima Basin, North Western Nigeria. Arab J Sci Eng. 39 (7), 5475-5487. https://doi.org/10.1007/s13369-013-0846-0
Reddy, K.S. (2014) Classification of transmissivity magnitude and variation in calcarious soft rocks of Bhaskar Rao Kunta Watershed, Nalgonda District, India. International Journal of Water Resources and Environmental Engineering, 6(3), 106-111. https://doi.org/10.5897/IJWREE2013.0374
Sikandar, P. and Christen, E.W. (2012) Geoelectrical Sounding for the Estimation of Hydraulic Conductivity of Alluvial Aquifers. Water Resour. Manage. 26 (5), 1201-1215. https://doi.org/10.1007/s11269-011-9954-3
Singhal, D.C. and Niwas, S. (1983) Estimation of aquifer transmissivity from surface geoelectrical measurements. Proc. UNESCO Symposium on Methods and Instrumentation of Investigating Groundwater System, Noordwijkerhout, the Netherlands, May, 405-414.
Sinha, R., Israil, M. and Singhal, D.C. (2009) A hydrogeological model of the relationship between geoelectric and hydraulic parameters of anisotropic aquifers. Hydrogeology Journal. 17, 495-503. https://doi.org/10.1007/s10040-008-0424-9
25 Thabit, J.M., Al‑Yasi, A.I. and Al‑Shemmari, A.N. (2018) Predicting aquifer characteristics to
enhance hydrogeophysical model in fractured/karstified rocks of Dammam Formation at Bahr Al-Najaf Basin, Iraq. Environ. Earth Sci. 77:671. https://doi.org/10.1007/s12665-018-7858-8 Urish, D.W. (1981) Electrical resistivity-hydraulic conductivity relationships in glacial outwash
aquifers. Water Resour. Res. 17 (5), 1401-1408. https://doi.org/10.1029/WR017i005p01401 Vereecken, H., Binley, A., Cassiani, G., Revil, A. and Titov, K. (2006) Applied Hydrogeophysics,
the series is published by ISO Press, Amsterdam and Springer in Conjunction with the NATO, Public Diplomacy Divition, 376 p.
Vinegar, H. J. and Waxman, M. H. (1984) Induced polarization of shaly sands. Geophysics. 49 (8), 1267-1287. http://dx.doi.org/10.1190/1.1441755
Ward, S. (1989) Resistivity and induced polarization methods. In: Ward, S. (ed) Investigations in geophysics 5, geotechnical and environmental geophysics 1. SEG, Tulsa, pp 147–189.
Worthington, P.F. (1993) The uses and abuses of the Archie equations, 1: The formation factor-porosity relationship. J Appl Geophys. 30, 215–228. https://doi.org/10.1016/0926-9851(93)90028-W
Yadav, G.S. and Abolfazli, H. (1998) Geoelectrical soundings and their relationship to hydraulic parameters in semiarid regions of Jalore, northwestern India. J Appl Geophys. 39, 35–51. https://doi.org/10.1016/S0926-9851(98)00003-2
Highlights
• There is a strong correlation between geoelectric and hydraulic parameters
• There is a linear relationship between transmissivity and water saturation