computermethods andprograms in biomedicine 127 (2016)83–93
j ou rn a l h om epa ge :w w w . i n t l . e l s e v i e r h e a l th . c o m / j o u r n a l s / c m p b
A
diagnostic
tool
for
population
models
using
non-compartmental
analysis:
The
ncappc
package
for
R
Chayan
Acharya
a,∗,
Andrew
C.
Hooker
a,
Gülbeyaz
Yıldız
Türkyılmaz
a,b,
Siv
Jönsson
a,
Mats
O.
Karlsson
aaDepartmentofPharmaceuticalBiosciences,UppsalaUniversity,P.O.Box591,SE-75124Uppsala,Sweden bEgeUniversity,FacultyofPharmacy,DepartmentofBiopharmaceuticsandPharmacokinetics,35100 ˙Izmir,Turkey
a
r
t
i
c
l
e
i
n
f
o
Articlehistory:
Received13July2015 Receivedinrevisedform 7December2015 Accepted7January2016
Keywords:
Non-compartmentalanalysis(NCA) PK
NONMEM
Posteriorpredictivecheck Simulation-baseddiagnostic
a
b
s
t
r
a
c
t
Backgroundandobjective:Non-compartmentalanalysis(NCA)calculatespharmacokinetic (PK)metricsrelatedtothesystemicexposuretoadrugfollowingadministration,e.g.area undertheconcentration–timecurveandpeakconcentration.Wedevelopedanewpackage inR,calledncappc,toperform(i)aNCAand(ii)simulation-basedposteriorpredictivechecks (ppc)forapopulationPK(PopPK)modelusingNCAmetrics.
Methods:ThencafeatureofncappcpackageestimatestheNCAmetricsbyNCA.Theppc fea-tureofncappcestimatestheNCAmetricsfrommultiplesetsofsimulatedconcentration–time data andcomparesthemwith thoseestimatedfromtheobserveddata.Thediagnostic analysisisperformedatthepopulationaswellastheindividuallevel.Thedistribution ofthesimulatedpopulationmeansofeachNCAmetriciscomparedwiththe correspond-ingobservedpopulationmean.Theindividuallevelcomparisonisperformedbasedonthe deviationofthemeanofanyNCAmetricbasedonsimulationsforanindividualfromthe correspondingNCAmetricobtainedfromtheobserveddata.Thencappcpackagealsoreports thenormalizedpredictiondistributionerror(NPDE)ofthesimulatedNCAmetricsforeach individualandtheirdistributionwithinapopulation.
Results:Thencappcproducestwodefaultoutputsdependingonthetypeofanalysis per-formed,i.e.,NCAandPopPKdiagnosis.ThePopPKdiagnosisfeatureofncappcproduces 8 setsofgraphicaloutputstoassesstheability ofapopulation modelto simulatethe concentration–timeprofileofadrugandtherebyevaluate modeladequacy.Inaddition, tabularoutputsaregeneratedshowingthevaluesoftheNCAmetricsestimatedfromthe observedandthesimulateddata,alongwiththedeviation,NPDE,regressionparameters usedtoestimatetheeliminationrateconstantandtherelatedpopulationstatistics.
Conclusions:Thencappcpackageisaversatileandflexibletool-setwritteninRthat success-fullyestimatesNCAmetricsfromconcentration–timedataandproducesacomprehensive setofgraphicalandtabularoutputtosummarizethediagnosticresultsincludingthemodel specific outliers.The outputis easytointerpretandto useinevaluationof a popula-tionPKmodel.ncappcisfreelyavailableonCRAN(http://cran.r-project.org/web/packages/ ncappc/index.html/)andGitHub(https://github.com/cacha0227/ncappc/).
©2016TheAuthors.PublishedbyElsevierIrelandLtd.Thisisanopenaccessarticleunder theCCBY-NC-NDlicense(http://creativecommons.org/licenses/by-nc-nd/4.0/).
∗ Correspondingauthor.Tel.:+46184714304.
E-mailaddress:chayan.acharya@farmbio.uu.se(C.Acharya).
http://dx.doi.org/10.1016/j.cmpb.2016.01.013
0169-2607/©2016 TheAuthors. Published byElsevier Ireland Ltd. Thisis an open accessarticle underthe CC BY-NC-ND license (http://creativecommons.org/licenses/by-nc-nd/4.0/).
84
computer methods andprograms in biomedicine 127 (2016)83–931.
Introduction
Theprincipal objective ofthe pharmacokinetics(PK) stud-ies is to understand the kinetics of a drug molecule in terms ofabsorption,distribution, metabolismand elimina-tion (ADME). PK data analysis can primarily be classified into non-compartmental analysis (NCA) and model-based analysis,wherethelattercanrangefromcompartment mod-els tophysiology-based models[1]. TheNCA benefitsfrom fewerassumptions,comparedtomodel-basedapproaches.In NCA,the area under the curve (AUC), peak observeddrug concentration(Cmax),timeofpeakconcentration(Tmax),
ter-minaleliminationrateconstant(Lambdaz),terminalhalf-life (HLLambdaz)andothermetricsareestimatedtodetermine thesystemicexposureofadrugfollowingadministration.NCA istypicallyanessentialpartofPKanalysisinthefieldofdrug discoveryandinrichlysampledclinicalPKstudies.Regulatory decisionsregarding bioequivalence studies are oftenbased oncomparisonsofAUCandCmax,inparticular.Additionally,
NCAmay alsobeusedas adiagnostictooltoevaluatethe performanceofanycompartmentalpopulation pharmacoki-netic(PopPK)modelsbycomparingtheNCAmetricsobtained fromsimulatedconcentration–timedatatothesamemetrics obtainedfromtheobservedconcentration–timeprofile.This canprovideinformationonthemodelsabilitytoprovide ade-quate description of exposure measures that are typically judgedasimportantforrichlysampledconcentration–time profiles.
Anumberofsoftwaretools(suchasKinetica[2],WinNonlin
[3],PKmoduleinR[4],Scientist[5],PKSolver[6])areavailable thatcanperformNCA.Asanovelty,wehaveextendedtheuse ofNCAasapharmacometricmodeldiagnostictoolemploying theprinciplesofaposteriorpredictivecheck[7]withtheNCA metricsasteststatistics.Inthisarticlewereporta simulation-baseddiagnosticpackage,calledncappc,writteninR[8]that (i)providesasimpleandflexiblemethodtoestimatetheNCA metricsfromtheobserveddataand(ii)comparesthemwith thesamemetricestimatedfrommultipledatasetssimulated usingthePopPKmodeltobediagnosed.Thusncappchelpsto bridgethegapbetweenNCAandpopulationmodelanalyses.
ncappcpackagecanpotentiallyfacilitatetheearlystageofthe drugdiscoveryprocessbyevaluatingtheperformanceofthe relatedPopPKmodelandidentifythemodelspecificoutliers.
2.
Methods
2.1. Implementationandtheusageofthencappc package
ThencappcpackageisimplementedinRandacceptsasetof inputarguments,resultingincertainprocessingofdataand outputproduction.Table1depictsthelistofacceptable argu-mentswithdefaultvaluesofthe arguments.Thenamesof mostoftheNCAmetricsestimatedbythencappcfunctionare consistentwiththoseusedinWinNonlin[3].Acomparisonof NCAmetricsobtainedbythencappcpackageandWinNonlin showednodiscrepanciesandtheresultscanbefoundinthe Supplementarymaterial-I.
obsFile and simFile arguments,used in ncappc, represent the observed and the simulated data. The default values of these two arguments are “ncaoriginal.npctab.dta” and “nca simulation.1.npctab.dta”,respectively.ToperformNCA,
obsFileargumentshouldbeadjustedtothecorrectnameofthe observeddatafile.IfsimFileargumentisNULLandtheworking directorydoesnotcontain“ncasimulation.1.npctab.dta”,only
ncafeatureofthispackagewillbeexecuted.Thenameofthe simulationoutputfile,structuredasiscommonintablefiles ofmanysoftwareincludingNONMEM[9]issuppliedviasimFile
argumenttousetheppcfeatureofthepackage.Allother argu-mentsareoptionalandtheirdefaultvaluemaybeadjusted accordingtothedescriptiongiveninTable1.
There are three arguments(namely str1Nm,str2Nm and
str3Nm)inncappcthatcanbeusedtostratifythestudy popula-tion.Forasinglelayerofstratificationanyofthesearguments canbeused.Iftheyareusedincombination,thepopulationis stratifiedintonestedlayers,wherestr1Nm,str2Nmandstr3Nm
representthe1st,2ndand3rdlevelsofstratification, respec-tively.
Ifnounitsaresuppliedforthedose,timeorconcentration,
ncappclabelsthe NCAmetricswithappropriate dimension-ality in terms of mass (M), length (L) and time (T). Fig. 1
displaystheworkflowofthisfunction.IfthesimFileargument is omitted only NCA on observeddata is performedwhile inclusionofthesimFileargumentresultsinbothNCA calcu-lationsand theppc-baseddiagnostics.Detailsofthe output generatedbyncappcpackagearedescribedinthe Supplemen-tarymaterial-II.Inbrief,theNCAfeatureproducestwosets of figures displaying the concentration vs. time profilefor eachindividualwithinacertainpopulationgroupandthe his-togramoffourNCAmetrics(AUClast,AUCINFobs,Cmax and
Tmax)estimatedfromtheobserveddata(seethe
Supplemen-tarymaterial-Iforthedefinitions).Additionally,twotablesare producedrepresentingtheestimatedindividualvaluesofthe NCAmetricsobtainedfromtheobserveddataandthevalues ofvarious populationstatistics ofeach oftheNCA metrics estimatedfromtheobserveddata,respectively.Pleaseseethe Supplementarymaterial-II forthedescriptionofthe output tablesandfiguresgeneratedbyncappc.
Inthe presenceofthe simulateddata obtainedusingof the concerned PopPK model,ncappc functionestimates the same setofNCAmetrics fromeach setofthesimulations. Next, the function performsthe individual and population level diagnostic testsand producesacomplete reportwith thegraphicalandtabularoutputsreportingtheindividualand populationleveldiagnosticresultsinvolvingsimulationmean, deviationfromtheobservedvalueandNormalizedPrediction DistributionError(NPDE)valuesofeachNCAmetric.Alltables producedbyncappcareintab-separatedtextformatandcanbe easilyloadedingenericdatavisualizationsoftwarelikeExcel, R,etc.
2.2. Simulation-basedPopPKmodelevaluationin ncappcpackage
Theobjectiveofthisfeatureofthencappcpackageistoperform aPopPKmodelevaluationusingsimulation-baseddiagnostics bycomparingtheNCAmetricsestimatedfromthesimulated datawiththesamemetricsestimatedfromtheobserveddata.
c o m p u t e r m e t h o d s a n d p r o g r a m s i n b i o m e d i c i n e 1 2 7 ( 2 0 1 6 ) 83–93
85
Table1–Descriptionandexpectedvaluesofthencappcarguments.
Name Description Exampleofpossiblevalues Default
obsFile Observedconcentration–timedatafromaninternaldataframe oranexternaltablewithcomma,taborspaceasseparator
Filenameordataframe “ncaoriginal.npctab.dta” simFile Simulatedconcentration–timedatainNONMEMformatfrom
aninternaldataframeoranexternaltable
Filenameordataframe “ncasimulation.1.npctab.dta”
str1Nm Columnnamefor1stlevelpopulationstratifier Columnname NULL
str1 StratificationIDofthememberswithin1stlevelstratification c(1,2) NULL
str2Nm Columnnamefor2ndlevelpopulationstratifier Columnname NULL
str2 StratificationIDofthememberswithin2ndlevelstratification c(1,2) NULL
str3Nm Columnnamefor3rdlevelpopulationstratifier Columnname NULL
str3 StratificationIDofthememberswithin3rdlevelstratification c(1,2) NULL
concUnit Unitoftheconcentration “ng/mL” “M.Lˆ-3”
timeUnit Unitofthetime “h” “T”
doseUnit Unitofthedose “g” “M”
doseNormUnit Normalizationfactorfordose “kg” NULL
obsLog Concentrationinobserveddatainlogarithmic Logical(TRUEorFALSE) FALSE
simLog Concentrationinsimulateddatainlogarithmic Logical(TRUEorFALSE) FALSE
psnOut ObserveddataisanoutputfromPsN(inNONMEMoutput format)
Logical(TRUEorFALSE) FALSE
idNmObs ColumnnameforIDinobserveddata Columnname “ID”
timeNmObs Columnnamefortimeinobserveddata Columnname “TIME”
concNmObs Columnnameforconcentrationinobserveddata Columnname “DV”
idNmSim ColumnnameforIDinsimulateddata Columnname “ID”
timeNmSim Columnnamefortimeinsimulateddata Columnname “TIME”
concNmSim Columnnameforconcentrationinsimulateddata Columnname “DV”
AUCTimeRange RangeoftimetocomputeAUC Lowerandupperlimitoftime(e.g.
c(0,24))
NULL
backExtrp OptiontobackextrapolatetopredictinitialconcentrationC0 Logical(TRUEorFALSE) FALSE
LambdaTimeRange RangeoftimetocomputeLambdaz Lowerandupperlimitoftime(e.g.
c(15,24))
NULL
LambdaExclude TimepointstobeexcludedfromLambdazcalculation Numeric(e.g.c(20,24)) NULL
doseAmtNm Columnnamefordoseamount Columnname AMT
adminType Doseadministrationtype “iv-bolus”,“iv-infusion”,
“extravascular”
“extravascular”
doseType Steadystateornon-steadystateofdose “ns”or“ss” “ns”
86
c o m p u t e r m e t h o d s a n d p r o g r a m s i n b i o m e d i c i n e 1 2 7 ( 2 0 1 6 ) 83–93 Table1– (Continued)Name Description Exampleofpossiblevalues Default
Tau Steadystatedosinginterval Numeric NULL
TI Infusionduration Numeric NULL
method ComputationalmethodtoestimateAUCandAUMC “linear”,“log”,“linear-log” “linear-log”
blqNm ColumnnameforBLQdata Columnname NULL
blqExcl BLQcolumnvaluestobeexcluded Numericorlogical(e.g.1,c(1,2),
“>=1”)
1
evid UseEVIDcolumntofilterdata Logical(TRUEorFALSE) TRUE
evidIncl EVIDvaluestobeincluded Numeric(e.g.0) 0
mdv UseMDVcolumntofilterdata Logical(TRUEorFALSE) FALSE
filterNm Columnnametofilterdata Columnname NULL
filterExcl Filteridentifiersusedtoexcludedata Numericorlogicalcondition(e.g.
1,c(1,2),“>=1”)
NULL
negConcExcl Excludenegativeconcentrations Logical(TRUEorFALSE) FALSE
param NCAmetricsusedfordiagnostics c(“AUClast”,“AUClowerupper”,
“AUCINFobs”,“AUCINFpred”, “AUMClast”,“Cmax”,“Tmax”, “HLLambdaz”)
c(“AUClast”,“Cmax”)
timeFormat Dataformatfortime Number,H:M,H:M:S “number”
dateColNm Nameofthedatecolumn Columnnamefordate NULL
dateFormat Formatofthedate D-M-Y,M-D-Y,Y-M-D,D/M/Y,
M/D/Y,Y/M/D
NULL
spread Measureofthespreadofsimulateddata “ppi”(95%parametricprediction
interval)or“npi”(95%
nonparametricpredictioninterval)
“npi”
tabCol OutputcolumnstobeprintedinthereportinadditiontoID, doseandpopulationstratainformation
ListofNCAmetricsinastring array
c(“AUClast”,“Cmax”,“Tmax”, “AUCINFobs”,“Vzobs”, “Cl obs”,“HL Lambda z”)
figFormat Formatoftheproducedfigures (“bmp”,“jpeg”,“tiff”,“png”) “tiff”
noPlot Suppressionofplotgeneration Logical(TRUEorFALSE) FALSE
printOut Write/printoutputonthedisk Logical(TRUEorFALSE) TRUE
studyName Nameofthestudytobeaddedasadescriptioninthereport Studydescription NULL
newdatamethod Fortestingafastermethodofreadingdata Logical(TRUEorFALSE) TRUE
overwriteSIMDATA CreatenewinformationintheSIMDATAdirectory,ortousethe informationintheSIMDATA
TRUE,FALSEorNULL NULL
outFileNm Additionaltagtothenameoftheoutputhtmlandpdfoutput filehyphenatedtothestandardncappcreportfilename
computermethods and programs in biomedicine 127 (2016)83–93
87
Fig.1–Workflowofncappcpackagedisplayingtwodifferentlogicalpathsofthepackagebasedontheavailabilityofthe simulationoutputdataset.SeeSupplementarymaterial-IIfordetaileddescriptionoftablesandfiguresgenerated.
AsNONMEM[9]isthemostwidelyusedsoftwareinnon-linear mixed-effect modeling ofPK/PD data, currently the model evaluationpartofthencappc packageisbasedonthe sim-ulationoutputobtainedfromNONMEM, butothersoftware cangenerate the same typeofoutput to beusedas input forthisroutine.ThePopPKmodeltobeevaluatedisusedto simulateksetsoftheplasmaconcentrationvs.timeprofile usingNONMEM,wherekisapositiveinteger.ncappcproduces
ksetsofNCAmetricsforeachindividualfromthesimulated data.Thispackageallowstheusertoemployanycombination ofthefollowingeightNCAmetricsforthemodelevaluation tests: AUClast, AUClowerupper, AUCINFobs, AUCINFpred, AUMClast, Cmax, Tmax, HLLambdaz (see the
Supplemen-tarymaterial-I forthe definitions).Asadefult, ncappcuses AUClastandCmaxformodelevaluationtests.TheNCAmetrics
obtainedfromtheobservedandthesimulateddataare sub-jectedtothefollowingsetofdiagnosticteststoevaluatethe performanceofthePopPKmodel.
2.2.1. Populationleveldiagnostics
2.2.1.1. Comparisonofthepopulationmeans. Acompleteset ofNCAmetricsareestimatedforeachindividualfromeach setofsimulateddata.ThepopulationmeanofeachoftheNCA metricsiscalculatedforeverysinglesetofthesimulateddata. Theprobabilitydistributionofthepopulationmeansofeach NCAmetricestimatedfromthesimulateddataiscompared graphicallywiththe populationmeanofthecorresponding NCAmetricestimatedfromtheobserveddata.Inthepresence ofstratifiedpopulation,thepopulationmeansarecalculated foreachstratumseparatelyforthecomparison.Dependingon thevalueofthespreadargumenttothefunction,thespread
ofthe simulateddistribution can bequantified as: (i) 95% parametricpredictioninterval(ppi)or(ii)95%nonparametric
prediction interval (npi). For derivationof prediction inter-vals,seeSupplementarymaterial-I.Asapreliminarygraphical analysis, thisfunction detectsif theNCA metricestimated fromtheobserveddatalieswithin95%ppiornpiofthe dis-tributionofthepopulationmeanoftheNCAmetricestimated fromthesimulateddata.
2.2.1.2. PopulationNPDEsofNCAmetrics.Basedonthe simu-lateddatasetstheNPDEoftheNCAmetricsforeachindividual iscomputedusingthemethodreportedbyCometsetal.[10]. ThepopulationmeanandSD(includingimprecision)ofthe NPDEsarecomparedwiththeexpectedvalues(i.e.mean0, SD1)inforestplots.TheprobabilitydensityoftheNPDE val-uesfortheentirepopulationisproducedandcomparedwith respecttothenormaldistributionwithmean0andvariance1.
2.2.2. Individualleveldiagnostics
2.2.2.1. Deviationfromtheobserveddataandidentificationof outliers. Asapartoftheindividualleveldiagnosis,deviation ofthesimulation-based mean ofthe NCAmetrics foreach individual from the corresponding NCA metrics estimated from the observed data are calculated by subtracting the individualsimulation-based meanoftheNCAmetricsfrom the same estimated from the observed data. The valueof the deviationis scaled by the spread ofthe corresponding simulateddistribution (measured eitheras95% ppior 95% npi).Incaseofppi,thedeviationisdividedbythedistanceof thesimulationmeantothe95%ppiboundary;incaseof95% npi,thedeviationisdividedbythedistanceofthesimulation meantothe95%npiboundarynearertotheobservedvalue. SuchdeviationiscalculatedforeachoftheNCAmetricsused formodeldiagnosis.Anegativevalueofthedeviationsignifies over-prediction of the corresponding NCA metric, while a
88
computer methods andprograms in biomedicine 127 (2016)83–93Table2–DatasummaryofMoxonidinePKstudy. GroupID(DGRP)a OccasionID (VISI)a Dailydose (g)a No.of individualsa No.of outliersb Selectedoutliers IDandNCA metricsb 7 3 200 24 0
7 8 200 21 2 ID402-Cmax,ID802-AUClast
8 3 200 26 0
8 8 400 25 2 ID606-AUClast,ID906-AUClast 9 3 200 24 1 ID322-AUClast,ID322-Cmax
9 8 600 24 0
a Obtainedfromtheinputdata. b Obtainedfromtheresultsofncappc.
positivevalueofthedeviationsignifiesunder-prediction of the same.Anindividual yielding the absolutevalueofthe scaled deviation >1, corresponding to the individual lying outsideofthecorresponding 95%predictioninterval ofthe model,foranyoftheNCAmetricsusedformodeldiagnosisis consideredasanoutlierforthespecificmodel.Foranoutlier theprobabilitydistributionoftheNCAmetriccomparedwith thecorrespondingobservedvaluesarereportedgraphically.
2.2.2.2. Individual NPDE of NCA metrics.The NPDE values fortheNCA metricsforeach individual are calculatedand reported.TheoreticallytheNPDEvaluesshouldbedistributed normallywithameanof0andSDof1.Thedistributionofthe individualNPDEvaluesforeachNCAmetricisplottedforeach populationstratumtodetectanytrendormodelbias.
3.
Results
3.1. CasestudywithMoxonidine
Moxonidineisacentrallyactingantihypertensivedrugused forthetreatmentofmildtomoderatehypertension.Herewe presentacasestudytoillustratethepackageofncappcpackage usingthedataobtainedfromthepopulationpharmacokinetic studyreportedbyKarlssonetal.[11].Thebasicinformation regardingtheMoxonidinePKdatasetisshowninTable2.In thisstudy74patientswereincludedintheactivetreatment group and treated with extravascular dose of Moxonidine. Patientsreceivingtheactivetreatmentweredividedintothree populationgroupsortreatmentarms(DGRP7,8and9)and eacharmreceivedMoxonidineintwodifferentoccasions(VISI
Fig.2–Concentrationvs.timeprofileoftheindividualsinDGRP7andVISI3obtainedformtheobserveddata.Theleft panelsrepresenttherawdata,whiletherightpanelsrepresentthesemi-logarithmicformoftheconcentrationdata.Eachof thelinesrepresentsindividualdata.
computermethods and programs in biomedicine 127 (2016)83–93
89
Fig.3–PopulationhistogramoffourselectedNCAmetrics(AUClast,AUCINFobs,Cmax,Tmax)estimatedfromtheobserved dataforDGRP7forVISI3.Thesolidanddashedblueverticallinesrepresentthepopulationmeanandthespreadofthe observeddata.Thespreadisdefinedby2.5thand97.5thpercentileboundariesoftheNCAmetricsobtainedfromthe observeddata.
3and8).TheindividualsinDGRP7received200gofdailydose forbothoccasions(VISI3andVISI8);theindividualsinDGRP 8received200gdailydoseatthefirstoccasion(VISI3)and then400gdailydoseatthesecondoccasion(VISI8)andthe individualsinDGRP9received200gdailydoseand600g dailydose ofMoxonidineinVISI3andVISI8,respectively. Pharmacokineticsamplingwasperformedatbothoccasions foreach subject.Aone-compartmentallinearPopPKmodel withfirst-orderabsorptionwithlagtimewasusedtosimulate theconcentrationvs.timeprofile1000timesforeach indi-vidual.TheNCAmetricswereestimatedfrombothobserved andsimulateddatasets.AUClastandCmaxmetricswereused
forthe diagnostictests.Fig.2presentstheplasma concen-trationprofileoftheindividualsobtainedfromtheobserved data.Fig.3representsthepopulationdistributionoffourNCA metrics(AUClast,AUCINFobs,CmaxandTmax)estimatedfrom
theobserveddata.Thesolidanddashedblueverticallines rep-resentthepopulationmeanandthespreadoftheNCAmetrics estimatedfrom theobserveddata.Thespreadisdefinedby the2.5thand97.5thpercentileboundariesoftheNCAmetrics obtainedfromtheobserveddata.
3.1.1. Comparisonofpopulationmeans(populationlevel analysis)
Fig.4representsthehistogramofthepopulationmeanofthe NCAmetricsestimatedfromthesetofsimulateddata.The
spreadofthedistributionofthesimulatedNCAmetricswas measuredbythe95%npi,calculatedfromthedistributionof thepopulationmeansestimatedfromeachsetofsimulated data.
3.1.1.1. Evaluationofreport. Thegraphicalreportofthe dis-tributionoftheestimatedpopulationmeanscomparedtothe observedpopulationoftheNCAmetricsisusedtodetermine the generalperformance ofthe PopPK modelto reproduce the drugexposureprofileforthe entirepopulation. In gen-eral,ifthe95%npiofthedistributionofthesimulatedNCA metricsusedforthediagnosticsfailtoencompassthe pop-ulation mean ofthe corresponding NCAmetrics estimated fromtheobserveddata,thePopPKmodelmayberevisitedfor improvement.Inthiscase,thegivenPopPKmodelisableto satisfytheconditionwithrespecttoAUClastandCmax.
3.1.2. Deviationofsimulatedmeanfromobservedvalue (individuallevelanalysis)
Fig.5representsthedeviationofthemeanofeachofthetwo NCAmetricsforeachindividualwithinDGRP7andVISI3 esti-matedfromthe1000setsofsimulateddatafromthevalue ofthe samemetric estimatedfromthe observeddata.The rawvaluesofthedeviationswerescaledbydividingthemby thedistancebetweenthesimulationmeanandthe95%npi boundarynearertotheobservedvalue.
90
computer methods andprograms in biomedicine 127 (2016)83–93Fig.4–HistogramofthepopulationmeanoftheAUClastandCmaxobtainedfromthesimulateddatafromthesimulations fortheindividualsinDGRP7forVISI3.TheredandbluesolidverticallinesrepresentthepopulationmeanoftheNCA metricobtainedfromtheobserveddata(mean(obs))andthemeanofthepopulationmeansofthesameNCAmetric obtainedfromthesimulations(mean(meanSim)),respectively.Thebluedashedverticallinesrepresentthespreador95% nonparametricpredictionintervalboundariesforthepopulationmeanoftheNCAmetricsobtainedfromthesimulateddata.
3.1.2.1. Evaluationofreport. Thevaluesofthescaled devia-tion foreach individual withinaspecifictreatmentarmor populationgroupare usedtodetectmodelmisspecification andindividualoutliers.Anyindividualyieldingtheabsolute
valueofthescaleddeviationgreaterthan1islabeledasan outlierbyncappcforthePopPK model.Thetotalnumberof identified outliers in the case ofMoxonidine data set was 5 out of 74 individuals and across 2 different metrics
Fig.5–DeviationofthemeanoftheNCAmetricsforeachindividualinDGRP7andVISI3estimatedfromthesimulated dataobtainedfromthesimulations(meanSim)fromthecorrespondingvaluesestimatedfromtheobserveddata(Obs).The deviationisscaledbythespreadofthesimulateddata,whichis,inthiscase,definedbythedistancebetweenthemeanof thePKsimulatedmetricvalueandthe95%nonparametricpredictionintervalboundaryofthesimulatedmetricdistribution proximaltotheobservedvalue(Deviation=(ObsmeanSim)/distancebetweenmeanSimandthe95%nonparametric predictionintervalboundarynearertotheObs).
computermethods and programs in biomedicine 127 (2016)83–93
91
Fig.6–Theindividual402inDGRP7forVISI8isidentifiedasaninthisexampleforthecorrespondingPopPKmodel.This individualislabeledasoutlierasthevalueoftheCmaxobtainedfromtheobserveddataisoutsidethe95%npiofthe distributionoftheCmaxvaluesobtainedfromthesimulateddataset.Theredandbluesolidverticallinesrepresentthe observedmetricvalueandthemeanofthesimulatedmetricvaluesforthatindividual,respectively.Thedashedblue verticallinesrepresentthe95%npiforthedistributionofthesimulatedmetricvalues.
(Cmax andAUClast)and 2profiles persubject. Last column
inTable2liststhe IDnumbers andthecorrespondingNCA metric of the individuals who are assigned as outliers for theircorrespondingpopulationgroupsunderthegivenPopPK
model.Fig.6illustratetheprobabilitydistributionoftheNCA metricsofoneoftheseoutliers(ID-402DGRP-7VISI-8)where theabsolutevalueofthescaleddeviationofCmaxwasgreater
than1.
Fig.7–ForestplotdisplayingthepopulationmeanandstandarddeviationoftheNPDEvaluesstratifiedontreatmentarms anddosegroups.TheredandgreendotsrepresentthemeanandthestandarddeviationoftheNPDE,respectivelywhilethe horizontallinesrepresentthecorresponding95%confidenceintervals.Thevaluesofthepopulationmeanandstandard deviationalongwiththecorresponding95%confidenceintervalsareshowninthefigure.
92
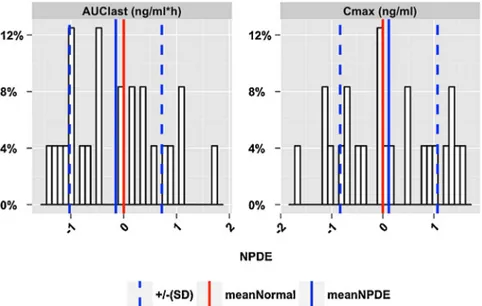
computer methods andprograms in biomedicine 127 (2016)83–93Fig.8–NPDEtypeanalysisforeachindividualinDGRP7andVISI3.NPDEvalueswerecalculatedfromthecorresponding observedandsimulatedvaluesoftheNCAmetrics.ThenegativevalueoftheNPDEsignifiesover-predictionofthe correspondingNCAmetrics,whileapositivevalueoftheNPDEsignifiesunder-predictionofthesame.
3.1.3. NPDEofNCAmetrics(bothpopulationand individuallevelanalysis)
TheNPDEvaluesofallNCAmetricsusedindiagnosticsfor eachindividualarereported. Thepopulationmeanandthe standarddeviationoftheNPDE valuesfortheNCAmetrics arealsocalculatedandshowninaforestplot(Fig.7)along withthecorresponding95%confidenceintervals.For deriva-tion ofconfidence intervals,see Supplementary material-I.
Fig.8representstheNPDEvaluesofAUClastandCmaxforeach
individualinDGRP7andVISI3.Fig.9representsthe probabil-itydistributionoftheNPDEvaluesforallindividualswithina specifictreatmentarmandoccasiongroupDGRP7andVISI3.
3.1.3.1. Evaluation of report. The forest plot (Fig. 6) shows thatthemeanNPDEvaluesofAUClastandCmaxofall
treat-mentarmsandoccasions.ForanacceptablePopPKmodel,the
Fig.9–HistogramoftheNPDEvaluesofallindividualsfortheNCAmetricsinDGRP7andVISI3.Theredsolidvertical representsthemeanoftheidealNPDEornormaldistribution(mean=0,SD=1).Thebluesolidverticallinesrepresentthe meanoftheestimatedNPDEdistributionforthecorrespondingpopulation.Thedashedblueverticallinesrepresentthe standarddeviationofthedistributionoftheNPDE.
computermethods and programs in biomedicine 127 (2016)83–93
93
populationmeanandSDalong withtheirconfidence inter-valshouldencompass0and1,respectively.Thepopulation modelsuccessfullyproducesthe95%confidenceintervalsof themeanoftheNPDEvaluesencompassing0,however,the 95%confidenceintervalsoftheSDoftheNPDEsofAUClastin DGRP8forVISI3andthesameofCmaxinDGRP8forVISI8
failtoencompass1.Thisindicatesadiscrepancybetweenthe PopPKmodelandtheobserveddataforthesemetricsinthese treatmentgroups.Nonetheless,Figs.8and9donotshowany systematictrendoferrorsforAUClastandCmax.
Theresultsoftheabovementionedsetofpopulationlevel and individual level diagnostic testsfor thestudied PopPK modelaresystematicallyreportedbythencappcpackageand itproducesacompletereportinHTMLandPDFformat.The resultsofthediagnostictestscanbeusedtoidentifymodel misspecificationsatthepopulationlevel; theresultsofthe
ncappccanalsobeusedtoidentifyspecificindividuals,which aremisfits totheconcerned PopPK modelortothe defini-tionofthepopulationstrata.Theconclusionsdrawnbased onthediagnosticswillbedependentontheintendeduseof themodelandalsowhichspecificmodelaspectthatthis diag-nosticisusedfor.Thus,theconsequenceofthediagnosticsfor thefurthermodeldevelopmentwillvarybetweenprojectand criteria.Anacceptablediscrepancymayneedtobedefinedfor eachcase.Forexample,ifthemainpurposeofthemodelis todescribethegeneraltendencyinthedata,thepopulation leveldiagnosticswillbeofmostimportance.
4.
Conclusion
Thencappcpackageisaversatileandflexibletool-setwrittenin RthatsuccessfullyestimatestheNCAmetricsrelatedtoNCA fromtheobservedandasetofsimulatedconcentration–time data.Itproducesacomprehensivesetofgraphicaland tab-ularoutputtosummarizetheresultsofthediagnostictests includingthemodelspecificoutliers.Theoutputiseasy to interpretandtouseinevaluationofapopulationmodel.This programalsoproducesacompletereportinPDFandHTML format.ncappcisfreelyavailableonCRANandGitHubatthe followingURL,respectively.
CRAN: http://cran.r-project.org/web/packages/ncappc/ index.html/.
GitHub:https://github.com/cacha0227/ncappc/.
Acknowledgements
Theresearchleading tothese resultshasreceived support from the Innovative MedicinesInitiative Joint Undertaking under grant agreement n◦ 115156, resources of which are
composed of financial contributions from the European Union’sSeventhFrameworkProgramme(FP7/2007–2013)and EFPIAcompanies’inkindcontribution.TheDDMoReproject isalsofinanciallysupportedbycontributionsfromAcademic andSMEpartners.Theauthorswouldalsoliketo acknowl-edge The Scientificand Technological Research Councilof Turkey(TÜB˙ITAK)forsupportingpostdoctoralresearchof Gül-beyazYıldızTürkyılmazandEgeUniversity,CenterforDrug Research&DevelopmentandPharmacokineticApplications (ARGEFAR), ˙Izmir,Turkeyforprovidinguswiththelicenseof WinNonlin.
Appendix
A.
Supplementary
data
Supplementarydataassociatedwiththisarticlecanbefound, in the online version, at http://dx.doi.org/10.1016/j.cmpb. 2016.01.013.
r
e
f
e
r
e
n
c
e
s
[1] J.Gabrielsson,D.Weiner,Non-compartmentalanalysis, MethodsMol.Biol.929(2012)377–389.
[2] Kinetica(ThermoFisherScientific,Waltham,MA,USA). [3] WinNonlin(Pharsight,MountainView,CA,USA). [4] T.Jaki,M.J.Wolfsegger,Estimationofpharmacokinetic
parameterswiththeRpackagePK,Pharm.Stat.10(2011) 294–388.
[5] M.Scientist,ExperimentalDataFitting/MicrosoftWindows Version2.0,1995(SaltLakeCity,Utah,City).
[6] Y.Zhang,M.Huo,J.Zhou,S.Xie,PKSolver:anadd-in programforpharmacokineticandpharmacodynamicdata analysisinMicrosoftExcel,Comput.MethodsPrograms Biomed.99(2010)306–314.
[7] Y.Yano,S.L.Beal,L.B.Sheiner,Evaluating
pharmacokinetic/pharmacodynamicmodelsusingthe posteriorpredictivecheck,J.Pharmacokinet.Pharmacodyn. 28(2001)171–192.
[8] RCoreTeam,R:ALanguageandEnvironmentforStatistical Computing,RFoundationforStatisticalComputing,Vienna, Aurtria,2013,URLhttp://www.R-project.org/.
[9] S.Beal,L.B.Sheiner,A.Boeckmann,R.J.Bauer,NONMEM User’sGuides1989–2009,2009(IconDevelopmentSolutions, City).
[10] E.Comets,K.Brendel,F.Mentre,Computingnormalised predictiondistributionerrorstoevaluatenonlinear mixed-effectmodels:thenpdeadd-onpackageforR, Comput.MethodsProgramsBiomed.90(2008)154–166.
[11] M.O.Karlsson,E.N.Jonsson,C.G.Wiltse,J.R.Wade,
Assumptiontestinginpopulationpharmacokineticmodels: illustratedwithananalysisofmoxonidinedatafrom congestiveheartfailurepatients,J.Pharmacokinet. Biopharm.26(1998)207–246.