LTHs 6:e Pedagogiska Inspirationskonferens, 15 december 2010
Abstract—Almost 120 000 individual Course Experience
Questionnaire (CEQ) responses from the Faculty of Engineering at Lund University contain a lot of information regarding how students experience courses. The data supports the notion that there is progression, e.g. with regard to written communication, in the educations, a result that can prove useful in the upcoming evaluation by the Swedish National Agency for Higher Education (HSV). Other results, however, suggest that there is much we do not fully understand with regard to how students experience courses and how they interpret the questions in the CEQ.
Index Terms—Course Experience Questionnaire, Engineering
Education, Generic Skills, Clear Goals
I. INTRODUCTION
URING the last years, data from course evaluations using the Course Experience Questionnaire (CEQ) has been made more accessible at our faculty. The coordinators of the different education programs have access to an overview of the process and survey-results and are obliged to include such data in their yearly internal reports. The four education boards, in turn, are obliged to include data on how the evaluation system is used with focus on to what extent the three parties — student representatives, course coordinators and program coordinators — write concluding comments in the final report of each course evaluation. Recently, department representatives have also been given access to an automatically updated overview of the evaluations of the courses at the department.
Naturally, the course evaluations are normally summarized on a course instance basis, but with the vast amount of data collected since the autumn of 2003, the data can be aggregated in several different ways and provide support for management decisions. In all use of CEQ-data, however, it should be carefully remembered that the answer given by a student likely depends on a long range of different factors out of which only a fraction lies under the control of e.g. the course coordinator. Earlier studies at our faculty have indicated that student responses to CEQ-surveys depend on which educational program the student belongs to (Björnsson et al. 2009) and studies in Australia (e.g. Patrick et al. 2008) have shown systematic differences between different fields of science.
Mattias Alveteg is the chairman of education board 2 at the Faculty of Engineering at Lund University.
Ingrid Svensson is the assistant dean for education at the Faculty of Engineering at Lund University.
Nevertheless, we argue that analyzing CEQ-data aggregated in different ways can both help us ask important questions regarding our educations and provide indications as to what degree our understanding of courses and educations is in agreement with the experiences of our students.
The aim with this study is thus to show some examples of how the collected data both
• supports some of our more or less well supported opinions on what the students learn and when they learn it, as well as
• displays some intriguing patterns that are difficult to explain and understand the consequences of.
II. METHOD
This study is based on 118 917 individual CEQ-survey answers during 7 full academic years starting 2003/2004 adding up to a total of 1037 different courses and 3710 course instances. Apart from aggregating data on course instance level, year of study, i.e. when in his/her education a student is supposed to take a course, was also used. Information regarding year of study was retrieved by comparing the course syllabus for each course instance with each survey answer on educational program, excluding data where no match was found. Students have also been divided into recommended
On the Usefulness of Course Evaluation Data in
Quality Assurance
Mattias Alveteg, Ingrid Svensson
D
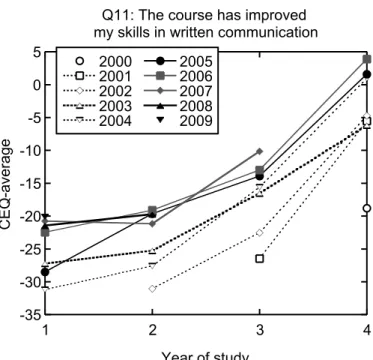
Fig. 1. Average CEQ-values, on the question regarding written communication, for different cohorts.
Q11: The course has improved my skills in written communication
2000 2001 2002 2003 2004 2005 2006 2007 2008 2009 -35 -30 -25 -20 -15 -10 -5 0 5 1 2 3 4 CEQ-average
LTHs 6:e Pedagogiska Inspirationskonferens, 15 december 2010
study-pace cohorts; If they, e.g. took a second year course in the academic year 2008/2009 their answer for that course belongs to cohort 2007 since students who started in the fall of 2007 should take second year courses 2008/2009 if they follow the recommended study pace.
III. RESULTS Written communication
A key aspect of higher education is progression. As a student follows the educational program she should face ever more intricate and difficult challenges such that she, at the point of graduation is prepared to meet the challenges in her future career. When it comes to generic skills, such as e.g. written communication, our view of the educational programs is that they are typically designed such that the students are given increasingly difficult tasks through all their education. The student experiences also point in this direction (Fig. 1). Clear Goals
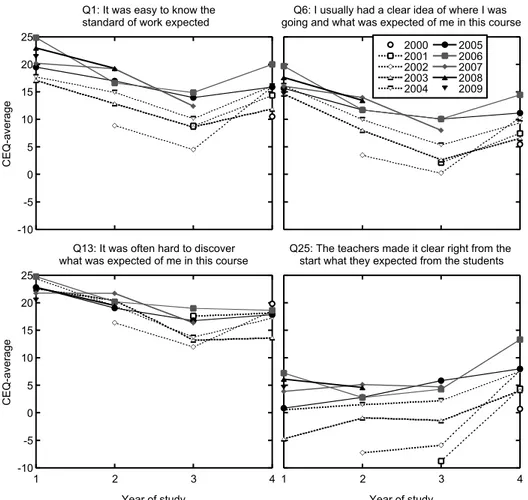
In the CEQ used there are four questions included in the “clear goals” scale. When aggregated on faculty level (Fig. 2), question 25 that specifically mentions the teachers has a tendency to increase with year of study while the other three questions display a tendency for decreasing values. Although the score on the question 25 is more similar, on average, for
later courses, linear regression on course instance level does not indicate that the correlation with the other questions increases (Table 1).
How can we interpret the data from the questions of clear goals from a quality assurance point of view? In order for us to have high quality in the education programs we need courses at low SOLO levels as well as courses that let the students dwell upon troublesome knowledge and learning thresholds, courses that asks of the students to take a (meta) cognitive leap forward and courses that situate the student in unfamiliar situations with incomplete information. Are CEQ-values for such different courses comparable?
Kember et al. (2004) argues that student’s perceptions are dependent on their conceptions of learning and state that their findings “certainly show that treating [CEQ] ratings as absolute measures is not valid”. Perry (1985) states that students go through an “evolution in their vision of knowledge and their expectations of teachers”. Consequently, a student’s perception of the clarity of the goals of a specific course is dependent on their previous experiences (Compare Prosser et al. 2003, p. 39). In a specific course some students may thus experience a friction between teaching and learning (Vermunt and Verloop 1999) while others experience congruence.
This does not imply that we should simply accept low ratings and take them as an indication of good quality. Rather we need to look more closely at courses with low ratings and try to determine e.g. to what degree there is a constructive friction or a destructive friction between the students’ strategy for learning and the teachers’ strategy for teaching (see Vermunt and Verloop 1999). We might also need to start ranking courses (as in Fig. 3, bottom) in the search of outliers and look more carefully into what is actually going on in such courses.
One such outlier has among the highest score on written communication of all our courses (Fig. 3) while simultaneously having one of the lowest scores on clear goals. As a key objective of this course is to provide training in written communication and many students write positive
Fig. 2. Averages of CEQ-values on questions in the Clear Goals scale for different cohorts. Note that there is a decreasing trend with respect to year of sudy for the three questions that do not explicitly mention the teachers. The average of the question 13 has been negated to increase comparability.
TABLEI
R-SQUARED FOR LINEAR REGRESSION WITH QUESTION 25 AND QUESTIONS 1,6
AND 13 RESPECTIVELY BASED ON COURSE INSTANCES AVERAGES
YEAR OF STUDY
QUESTION 1 2 3 4
1 0.77 0.71 0.66 0.56
6 0.70 0.73 0.63 0.48
13 0.40 0.44 0.50 0.33
Q1: It was easy to know the standard of work expected
-10 -5 0 5 10 15 20 25 CEQ-average
Q6: I usually had a clear idea of where I was going and what was expected of me in this course
2000 2001 2002 2003 2004 2005 2006 2007 2008 2009
Q13: It was often hard to discover what was expected of me in this course
-10 -5 0 5 10 15 20 25 1 2 3 4 CEQ-average
Year of study
Q25: The teachers made it clear right from the start what they expected from the students
1 2 3 4
LTHs 6:e Pedagogiska Inspirationskonferens, 15 december 2010
comments in the free text answers, it seems plausible that the friction in this case is more constructive than destructive. We have, however, found a few courses where we suspect that destructive friction dominates.
Patterns on the program level
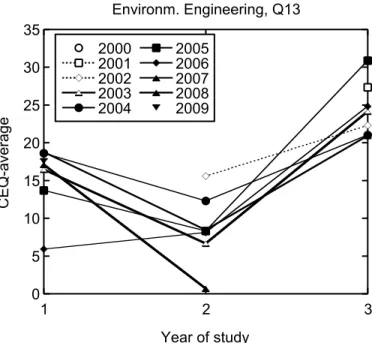
Although we cannot show all results here, many interesting results can be found by aggregating on the program or department levels. As an example, for the environmental engineering (W) program we typically saw a V-shaped curve for different questions and scales (Fig. 4). We deem it likely that this is at least partly due to the design of the program, with basic courses in the first year of study and integrative courses in the third year of study where the students begin to understand the bigger picture.
ACKNOWLEDGMENT
Special thanks to Karim Andersson for helping us use the CEQ-database.
REFERENCES
[1] Björnsson, L., Dahlblom, M., Modig, K., Sjöberg, A. 2009
Kursutvärderingssystemet CEQ vid LTH: uppfylls avsedda syften. Den
2:a Utvecklingsknoferensen för Sveriges Ingenjörsutbildningar, LTH 2-3 december 2009. http://www.konferenslund.se/pp/CEQ_Bjornsson.pdf
[2] Kember, D., Jenkins, W., Kwok Chi, N. 2004 Adult students’ perceptions of good teaching as a function of their conceptions of learning Part 2: Implications for the evaluation of teaching. Studies in
Continuing Education 26(1), 81-97
[3] Patrick, K., Bedford, A., Romagnano, S., Bedford, M., Barber, J. 2008: A Discipline-Specific Factor Analysis Approach to Using Student Surveys for Improvement Journal of Institutional Research 14(1), 96-108
[4] Perry, W. 1985: Different Worlds in the Same Classroom: Students' Evolution in Their Vision of Knowledge and Their Expectations of Teachers. in Harvard-Danforth Center (eds) On Teaching and Learning.
Vol. 1
[5] Prosser, M, Ramsden, P, Trigwell, K, Martin, E 2003: Dissonance in Experience of Teaching and Its Relation to the Quality of Student Learning. Studies in Higher Education 28, 37-48
[6] Vermunt, J.D., Verloop, N. 1999 Congruence and friction between learning and teaching. Learning and Instruction 9, 257-280 Fig. 3. CEQ-values for a specific course displayed as CEQ-values (top)
and in comparison with all other courses expressed as percentile each academic year (bottom).
Fig. 4. Typical V-shaped CEQ-result for different cohorts at the Environmental Engineering program.
Course: FMI030, FMI031
Q11: Written comm. Q17: Relevance Q26: Satisfaction Good Teaching Clear Goals Apropr. Assess. Apropr. Workload Generic Skills -100 -50 0 50 100 CEQ-average 0 20 40 60 80 100 2003 2004 2005 2006 2007 2008 2009
CEQ-average as percentile
Academic year Environm. Engineering, Q13 2000 2001 2002 2003 2004 2005 2006 2007 2008 2009 0 5 10 15 20 25 30 35 1 2 3 CEQ-average