THESIS
ACTIVE SENSING: AN INNOVATIVE TOOL FOR EVALUATING GRAIN YIELD AND NITROGEN USE EFFICIENCY OF MULTIPLE WHEAT GENOTYPES
Submitted by
Mohammed Abdulridha Naser Department of Soil and Crop Sciences
In partial fulfillment of the requirements For the Degree of Master of Science
Colorado State University Fort Collins, Colorado
Fall 2012
Master‟s Committee:
Advisor: Rajiv Khosla Scott Haley
ii ABSTRACT
ACTIVE SENSING: AN INNOVATIVE TOOL FOR EVALUATING GRAIN YIELD AND NITROGEN USE EFFICIENCY OF MULTIPLE WHEAT GENOTYPES
Precision agricultural practices have significantly contributed to the improvement of crop productivity and profitability. Remote sensing based indices, such as Normalized Difference Vegetative Index (NDVI) have been used to obtain crop information. It is used to monitor crop development and to provide rapid and nondestructive estimates of plant biomass, nitrogen (N) content and grain yield. Remote sensing tools are helping improve nitrogen use efficiency (NUE) through nitrogen management and could also be useful for high NUE genotype selection. The objectives of this study were: (i) to determine if active sensor based NDVI readings can differentiate wheat genotypes, (ii) to determine if NDVI readings can be used to classify wheat genotypes into grain yield productivity classes, (iii) to identify and quantify the main sources of variation in NUE across wheat genotypes, and (iv) to determine if normalized difference vegetation index (NDVI) could characterize variability in NUE across wheat genotypes. This study was conducted in north eastern Colorado for two years, 2010 and 2011. The NDVI readings were taken weekly during the winter wheat growing season from March to late June, in 2010 and 2011 and NUE were calculated as partial factor productivity and as partial nitrogen balance at the end of the season. For objectives i and ii, the correlation between NDVI and grain yield was determined using Pearson‟s product-moment correlation coefficient (r) and linear regression analysis was used to explain the relationship between NDVI and grain yield. The K-means clustering algorithm was used to classify mean NDVI and mean grain yield into three classes. For objectives iii and iv, the parameters related to NUE were also calculated to measure
iii
their relative importance in genotypic variation of NUE and power regression analysis between NDVI and NUE was used to characterize the relationship between NDVI and NUE. The results indicate more consistent association between grain yield and NDVI and between NDVI and NUE later in the season, after anthesis and during mid-grain filling stage under dryland and a poor association in wheat grown in irrigated conditions. The results suggest that below saturation of NDVI values (about 0.9), (i.e. prior to full canopy closure and after the beginning of senescence or most of the season under dryland conditions) NDVI could assess grain yield and NUE. The results also indicate that nitrogen uptake efficiency was the main source of variation of NUE among genotypes grown in site-years with lower yield. Overall, results from this study demonstrate that NDVI readings successfully classified wheat genotypes into grain yield classes across dryland and irrigated conditions and characterized variability in NUE across wheat genotypes.
iv
ACKNOWLEDGEMENTS
First of all I would like to thank Allah, the Almighty, for helping me a lot to accomplish my project. This was my father‟s dream to see me in graduate school; regrettably he was unable to see me conclude my study since he has passed away. May Allah, the Almighty, shower his mercy and forgiveness upon him and admit him to his paradise. Also my special thanks to my family: my wonderful wife and amazing children for supporting and encouraging me, and for bearing much when I was far away from them to complete my master degree. And I will be always grateful to my mother for her prayers and tears poured out for me all the duration of my studies, also to my brothers, and sisters for their patience and help.
I am thankful to many people who helped and supported me in completing this project. Thanks to my graduate committee who worked very closely with me during the whole project. I would like to show special thanks and take off my hat for my advisor Dr. Rajiv Khosla for his advice, experience, and the time he spent with me to complete my degree. Also, I would like to thank him for giving me this opportunity to take a place in the Soil and Crop Sciences Department in the wonderful program in precision agriculture. I appreciate his patience when I was still learning English and his effort to teach me scientific writing, also his recommendations to participate in many conferences, and for all the awards I have received. Thanks to Dr. Scott Haley for his support, advice, and suggestions to complete this project. I would like to show my great appreciation to Dr. Robin Reich for his help contribution, and suggestions, and especially for his patience in explaining the statistical analysis to me.
Thanks to Dr. Marc Moragues, and other members of the CSU Wheat Breeding Program, for their help in collecting and interpreting my data. I really appreciate the help of the staff in
v
our lab and especially Dr. Louis Longchamps for his help in collecting data and advice throughout my study, and also Rafael T. Siqueira for his help. Thanks to all the staff and faculty in the Department of Soil and Crop Sciences, and special thanks to Karen Allison for her help. I would like to thank all the staff from the USDA for their help and cooperation in collecting data. I want to thank the Iraqi Ministry of Higher Education and Scientific Research and my university (Al- Muthanna University) for providing me with the opportunity to come and study at a great school as Colorado State University in Fort Collins. Thanks to the Iraqi cultural attaché in Washington DC for their help in explaining some issues and supporting me. I cannot forget my teachers at the University of Baghdad, College of Agriculture, Soil and Water Department especially Professor Dr. Ahmad S. Muhaimeed and Professor Dr.Yousef M. Abu Dahi for their teaching, help and constant advices. Also I want to take the opportunity to thank my teacher Dr. Wadejah M. Khudair from Plant Protection Department for being so kind and treating me as a family not only a student, she encouraged me to complete my graduate school. Then I would like to thank Dr. Turki M. Saad for his help and advices. Finally I would like to show my gratitude for all my friends in Fort Collins and out of it who helped and encouraged me to complete my degree.
vi
TABLE OF CONTENTS
ABSTRACT ... ii
ACKNOWLEDGEMENTS ... iv
TABLE OF CONTENTS ... vi
LIST OF TABLES ... viii
LIST OF FIGURES ... ix
CHAPTER I ... 1
Evaluating Active Sensor to Differentiate Wheat Genotypes Based on Grain Yield under Dryland and Irrigated Conditions ... 1
SUMMARY OF CHAPTER I ... 1
INTRODUCTION ... 2
MATERIALS AND METHODS ... 6
Study sites ... 6
Experimental Procedure ... 7
Active remote sensing ... 10
Statistical analysis: ... 11
RESULTS AND DISCUSSION ... 14
NDVI variations across growth stages ... 14
In-field spatial variability of winter wheat ... 16
Grain yield of genotypes ... 18
Relationship between NDVI and grain yield ... 19
Comparing NDVI and yield classification ... 24
K-means clustering method ... 25
CONCLUSION ... 30
REFERENCES ... 31
CHAPTER II ... 36
Characterizing Variation in Nitrogen Use Efficiency for Wheat Genotypes across Dryland and Irrigated Conditions ... 36
SUMMARY OF CHAPTER II ... 36
INTRODUCTION ... 37
MATERIALS AND METHODS ... 42
Study sites ... 42
vii
Nitrogen use efficiency (NUE) ... 45
Active remote sensing ... 46
Statistical analysis... 47
RESULTS AND DISCUSSION ... 50
Nitrogen use efficiency across wheat genotypes ... 50
Sources of variation of NUE across wheat genotypes ... 54
Characterization of the NUE variability across wheat genotypes using NDVI ... 58
CONCLUSION ... 62
REFERENCES ... 64
APPENDIX A ... 70
viii
LIST OF TABLES
Table 1.1 Summary of soil properties for soil samples acquired at depths of 0-20 cm and 20-61 cm. Soil NO3-N contents were determined on samples collected on March 22nd (at
early spring) and August 19th of 2010 (after harvest) for site year I and November 8th 2010 (at early fall) and August 22nd 2011(after harvest) for site year II. ... 8 Table 1.2 Contingency table comparing grain yield classes to NDVI classes for all dates, site years and water regimes (dryland and irrigated conditions) in this study merged together. The overall accuracy is presented in the lower right end of the table. ... 26 Table 2.1 Four common definitions and methods of calculating Nitrogen Use Efficiency (NUE) according to (Hawkesford, 2012; Snyder and Bruulsema, 2007). ... 39 Table 2.2 Summary of soil properties for soil samples acquired at depths of 0-20 cm and 20-61 cm. Soil NO3-N contents were determined on samples collected on March 22nd (at
early spring) and August 19th of 2010 (after harvest) for site year I and November 8th 2010 (at early fall) and August 22nd 2011(after harvest) for site year II. ... 43 Table 2.3 Measurements and calculations of nitrogen use efficiency and related parameters (Nelson et al., 2012; Snyder and Bruulsema, 2007). ... 46 Table 2.4 Contribution of parameters related to the variation in PFP and PNB... 56
ix
LIST OF FIGURES
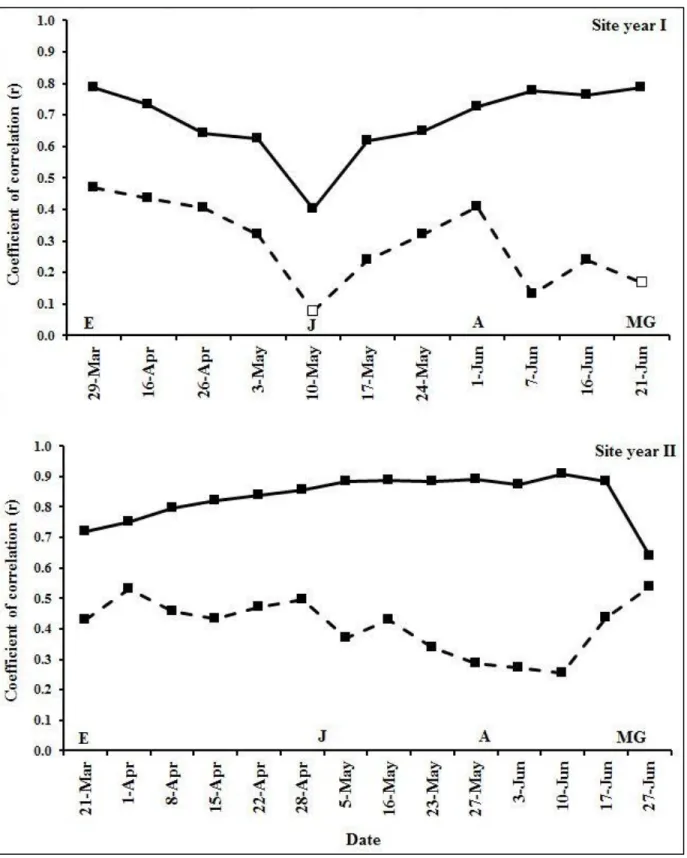
Figure 1.1 The NDVI readings were collecting using Greenseeker® handheld optical sensor. Plot boundaries are highlighted with white dashed lines... 11 Figure 1.2 Time-series of maximum, minimum and mean NDVI values for individual winter wheat genotype (CO940610) selected across the growing season under dryland conditions for site I (11 dates for NDVI readings). Crop growth stages are indicated as E=early spring, J= jointing, H= heading, A= anthesis, and MG= mid-grain filling. ... 15 Figure 1.3 Maps of spatial variability in NDVI values across 24 winter wheat genotypes collected under dryland conditions for 14 dates across site year II. ... 17 Figure 1.4 Correlation coefficient (r) between NDVI and grain yield across 24 winter wheat genotypes for site year I and II under dryland (solid line) and irrigated (dashed line) conditions across crop growth stages. E=early spring, J= jointing, A= anthesis, and MG= mid-grain filling. Solid symbols indicate significant correlation between NDVI and yield (p-value <0.05). ... 20 Figure 1.5 Relationship between NDVI and grain yield across 24 winter wheat genotypes under dryland conditions across crop growth stages. Crop growth stages are indicated as E=early spring, J= jointing, A= anthesis, and to MG= mid-grain filling. ... 22 Figure 1.6 Relationship between NDVI and grain yield across 24 winter wheat genotypes under irrigated conditions across crop growth stages. Crop growth stages are indicated as E=early spring, J= jointing, A= anthesis, and to MG= mid-grain filling. ... 23 Figure 1.7 Overall accuracy results from contingency table comparing mean grain yield
classes to mean NDVI classes using K-means clustering (solid line with squares) and stratification clustering (dashed line with circles). The overall accuracy is presented across 14 dates for site year II under (a) dryland conditions and (b) irrigated conditions. E=early spring, J= jointing, A= anthesis, and MG= mid-grain filling. ... 25 Figure 1.8 Overall accuracy between grain yield and NDVI classes for site year I (dryland with solid line and irrigated with dashed line). E=early spring, J=jointing, A=anthesis, MG=mid-grain filling stage. ... 27 Figure 1.9 Overall accuracy between grain yield and NDVI classes for site year II (dryland with solid line and irrigated with dashed line). E=early spring, J= jointing, A= anthesis, and MG= mid-grain filling. ... 28 Figure 2.1 The NDVI readings were collecting using Greenseeker® handheld optical sensor. Plot boundaries are highlighted with white dashed lines... 47
x
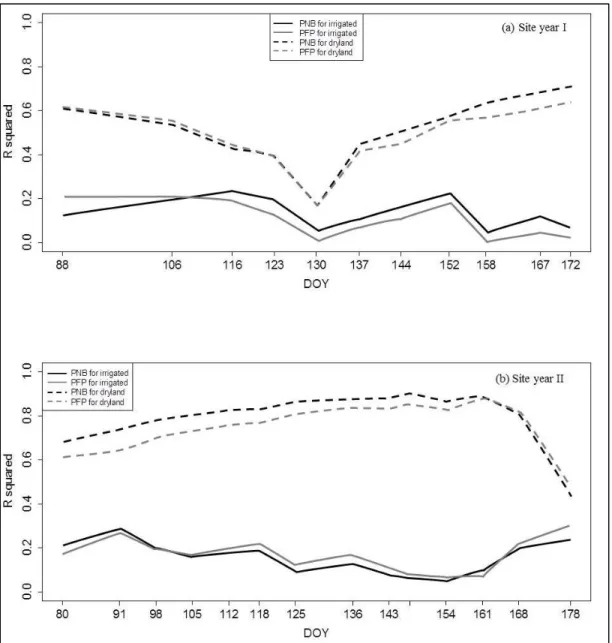
Figure 2.2 Mean nitrogen use efficiency as partial factor productivity (PFP) across 24 winter wheat genotypes. Black and gray bars represent NUE for wheat genotypes under dryland and irrigated conditions respectively, for site year I. ... 51 Figure 2.3 Mean nitrogen use efficiency as partial factor productivity (PFP) across 24 winter wheat genotypes. Black and gray bars represent NUE for wheat genotypes under dryland and irrigated conditions respectively, for site year I. ... 51 Figure 2.4 Mean nitrogen use efficiency as partial factor productivity (PFP) across 24 winter wheat genotypes. Black and gray bars represent NUE for wheat genotypes under dryland and irrigated conditions respectively, for site year II. ... 52 Figure 2.5 Mean nitrogen use efficiency as partial nitrogen balance (PNB) across 24 winter wheat genotypes. Black and gray bars represent NUE for wheat genotypes under dryland and irrigated conditions respectively, for site year II. ... 52 Figure 2.6 Relationship of the r squared value between NDVI and PFP and PNB with day of year (DOY) across 24 winter wheat genotypes under dryland and irrigated conditions for (a) site year I and (b) site year II. ... 60
1 CHAPTER I
Evaluating Active Sensor to Differentiate Wheat Genotypes Based on Grain Yield under Dryland and Irrigated Conditions
SUMMARY OF CHAPTER I
Remote sensing based indices such as Normalized Difference Vegetative Index (NDVI) are sensitive to biomass and nitrogen (N) variability in crop canopies. Active remote sensing tools such as Greenseeker® can measure NDVI using light reflected from crop canopies. The objectives of this study were (i) to determine if active sensor based NDVI readings can differentiate wheat genotypes (ii) to determine if NDVI readings can be used to classify wheat genotypes into grain yield productivity classes. This study was conducted in north eastern Colorado near Greeley for two years, 2010 and 2011. The NDVI readings were taken weekly during the winter wheat growing season from March to late June in both years. The correlation between NDVI and grain yield was determined using Pearson‟s product-moment correlation coefficient (r). The coefficient of determination (R2) was used to explain the proportion of variability between NDVI and grain yield. The K-means clustering was used to classify mean NDVI and mean grain yieldinto three classes. Our results indicate more consistent association between grain yield and NDVI later in the season, after anthesis and during mid-grain filling stage under dryland and poor association in wheat grown in irrigated conditions. Below saturation of NDVI values (about 0.9), (i.e. prior to full canopy closure and after the beginning of senescence or most of the season under dryland conditions) we observed that NDVI could be used to predict grain yield. Our results also indicate that NDVI readings successfully classified
2
wheat genotypes across dryland and irrigated conditions. This study demonstrates the potential of using NDVI readings as a tool to differentiate and identify superior wheat genotypes.
INTRODUCTION
Precision agricultural practices have significantly contributed to the improvement of crop productivity and profitability. It enhances farm input use efficiency and reduces environmental impacts (Koch and Khosla, 2003). Today, precision agricultural practices are providing farmers with valuable information, enabling them to make the right decisions with respect to management of crop inputs such as fertilizer, seed, pesticides, water, etc.
Remote sensing is a key component of precision agricultural practices. It is used to monitor the crop development, and to provide rapid and nondestructive estimates of plant biomass, leaf area index (LAI), nitrogen (N) content and grain yield (Aparicio et al., 2000; Cabrera-Bosquet et al., 2011). Remote sensing techniques can be divided into two broad categories: active and passive. Passive remote sensing utilizes ambient light as its source of energy. Satellite and airborne imagery use passive remote sensing. Several studies have reported that passive sensors are useful in obtaining information about crop canopies. However, airborne or satellite borne passive sensors have many limitations such as expense and lack of ability to collect data at night or on cloudy days. In addition, they require advanced computing skills to manipulate and interpret imagery data (Erdle et al., 2011; Govaerts and Verhulst, 2010; Inman et al., 2005; Shaver et al., 2010, 2011).
Active remote sensing devices have their own source of energy. They were developed to overcome the limitations of passive sensing devices and to minimize the effects of ambient light conditions on reflectance readings (Tubaña et al., 2011). Active remote sensors can measure the
3
amount of light reflected from the crop canopy at any time, day or night. This is because these sensors can differentiate between external light sources such as sunlight, and light generated from its own energy, a unique feature of active sensors (Schepers, 2008). Moreover, they are relatively inexpensive and easy to use. They are also small enough to be handheld or mounted on a tractor (Cabrera-Bosquet et al., 2011; Inman et al., 2005; Shaver et al., 2011). Active remote sensing tools such as Greenseeker® (NTech Industries Inc., Ukiah, California, USA) can measure vegetation indexes such as the Normalized Difference Vegetative Index (NDVI) or simple ratio (SR) using light reflectance from crop canopies. The NDVI is determined by the intensity of red light (R) and near-infrared light (NIR) reflected from the crop canopy. It is calculated using the following equation:
NDVI= NIR - R / NIR + R, Eq.1
where R is the reflectance in the red light band (wavelengths 600 to 720 nm) and NIR is the reflectance in the near-infrared band (wavelengths 720-1300 nm).
Reflectance of light from individual leaves is influenced by the internal structure of the leaf. Campbell (2002) reported that reflectance in the red and blue (wavelengths 400 to 500 nm) portion of the electromagnetic spectrum depended mainly on chlorophyll contained in the palisade layer of the leaf. In addition, 70% to 90% of incident light in the visible spectrum is absorbed by chlorophyll and is used for photosynthesis, while the green band (wavelengths 500 to 600 nm) is mostly reflected. The vegetation reflectance intensity in the visible light (VIS; waveband 400 to 720 nm) is negatively correlated to leaf N content, while NIR reflectance is positively correlated to leaf N content and biomass (Shaver et al., 2010). Reflectance of NIR depends on the structure of the mesophyll cells in the leaf and the cavities between them (Campbell, 2002). Plant anatomical characteristics are influenced by many environmental
4
factors such as soil moisture, soil salinity, nutrient status or leaf age, all of which can affect reflectance measurements (Ma et al., 2001). A strong linear relationship exists between leaf N concentration and leaf chlorophyll concentration (Evans, 1989; Lamb et al., 2002). Greater leaf area and green plant biomass translate into higher NDVI values (Shaver et al., 2010, 2011). Since N content of the plant is directly related to leaf area and green plant biomass, higher N content in plants also results into higher NDVI values (Shaver et al., 2011). Raun et al. (2001) demonstrated that a significant relationship (R2 = 0.5, p-value < 0.0001) exists between NDVI and estimated grain yield in winter wheat (Triticum aestivum L.). Likewise, Inman et al. (2007) found a linear relationship (R2 = 0.65) between NDVI and grain yield in maize (Zea mays L.). Several other studies revealed significant correlation between NDVI and grain yield from heading to grain filling in wheat (Ball and Konzak, 1993; Marti et al., 2007; Prasad et al., 2007; Reynolds et al., 2001; Royo et al., 2003). The most appropriate stage for estimating yield was reported to be at mid-grain filling stage (Marti et al., 2007; Royo et al., 2003). Aparicio et al. (2000) found correlation between NDVI and grain yield increasing as growth stage progressed from booting to maturity, but it was significant only at the maturity stage for durum wheat [Triticum turgidum L. subsp. durum (Desf.) Husn.] under irrigated conditions. They also observed a positive correlation between NDVI and grain yield at all wheat growth stages under dryland conditions.
Breeding methods often focus heavily on grain yield as a trait to identify, select, and breed new crop varieties. Likewise, crop biomass, as measured by destructive sampling, is another trait that is often used in breeding programs to identify total aboveground weight and total N in crop tissue. Regan et al. (1992) reported that destructive sampling is an efficient method to select superior genotypes of spring wheat for early vigor under dryland conditions.
5
However, destructive sampling method is practical only when small numbers of samples are involved (Elliott and Regan, 1993). Direct estimation of grain yield and biomass through destructive sampling is tedious, expensive, labor intensive and time consuming (Babar et al., 2006b; Inman et al., 2005). Experience has also demonstrated that sampling errors cause difficulty in detecting prominent differences among samples and destructive sampling reduces the plot area for estimating final biomass and grain yield.
Active remote sensing based on NDVI can be used to estimate biomass and N variability in crop canopies without destructive sampling and thus has the potential to provide a fast, inexpensive, and accurate estimate of plant biomass production and grain yield of the genotypes prior to harvest, which would be beneficial for crop breeders (Elliott and Regan, 1993; Inman et al., 2005; Royo et al., 2003). Also, NDVI can detect subtle differences in sparse canopies which makes it suitable for estimating crop growth at early stages and it is not linear with respect to LAI of > 3.0 (Aparicio et al., 2002; Serrano et al., 2000). The NDVI values range between 0.0 and 1.0. The NDVI values from bare soil reflectance normally ranges between 0.1 and 0.2. The NDVI saturation normally happens around 0.9 when the NDVI reading fail to discern differences in variable crop canopies. Reynolds et al. (2001) suggested the use of NDVI as a fast screening tool for grain yield. Similarly, Araus et al. (2001) showed that a spectral vegetation index such as NDVI is a promising tool to screen genotypes.
In recent studies, it was shown that NDVI and other spectral reflectance indices have the potential to differentiate spring wheat genotypes from heading to grain filling stages for crop biomass and grain yield under irrigated conditions (Babar et al., 2006a, 2006b). Ma et al. (2001) reported that NDVI could differentiate between high and low grain yield among soybean [Glycine max (L.) Merr.]genotypes. They concluded that NDVI can be a reliable and fast index
6
for screening soybean genotypes and estimating yield under irrigated conditions. However, review of the literature indicates that very few studies have been conducted to identify and differentiate winter wheat genotypes for grain yield using active sensor based NDVI.
The overall goal of this study was to evaluate the possibility of using Greenseeker®, measuring red NDVI, as a tool to differentiate and classify wheat genotypes. The specific objectives were: (i) to determine if active sensor-based NDVI readings can differentiate among wheat genotypes, and (ii) to determine if NDVI readings can classify wheat genotypes into grain yield productivity classes.
MATERIALS AND METHODS
Study sites
This study was conducted in northeastern Colorado over two winter wheat growing seasons, 2009-2010 and 2010-2011 referred to as site years I and II respectively. The study was located at the USDA-ARS Limited Irrigation Research Farm, near Greeley, Colorado (40˚ 26΄ 58.87˝ N and -104˚ 38΄22.56˝ W). Both site years were under drip irrigation, and soils were mapped as Otera sandy loam (coarse–loamy, mixed superactive, calcareous, mesic Aridic Ustorthents) soil series with zero to three percent slope (Crabb, 1980). The soils were deep, well-drained and were formed by eolian deposits and mixed outwash parent material and included loam and clay loam underlying material. In site year I (2009-2010), the total precipitation received during the crop growing season from October 1, 2009 to July 31, 2010 was 292.9 mm. For site year II (2010-2011), the total precipitation received from October 1, 2010 to July 31, 2011 was 209.3 mm (USDA, 2012). The total precipitation received during the two site years was higher than the ten year average precipitation of 170.6 mm for the same time periods.
7
The previous crop was dry (pinto) beans (Phaseolus vulgaris L.) under dryland and irrigated conditions for both years.
Experimental Procedure
A global positioning system unit was used to map the field boundaries and to geo-reference soil samples (Trimble Ag 114 GPS antennae with differential correction, CA, USA). Soil samples were collected using a systematic unaligned grid sampling design for the entire study area in both site-years. Thirty soil samples were collected at two depths, 0 - 20 cm and 20- 61 cm, at 15 locations within the 0.2 hectare study area (i.e. a sampling density of 72 samples per ha). Soil samples consisting of several soil cores were collected from each depth to obtain one composite soil sample. Soil samples were dried and sent to a commercial laboratory (Ag Source Harris Lab., Lincoln, NE) for chemical and physical soil property analysis. Particle size analysis was determined by using the hydrometer method (Gee and Bauder, 1986). Soil pH was measured using 1:1 water to soil slurry (Thomas, 1996). Organic matter (OM) was determined using the loss on ignition method (Heiri et al., 2001). Soil NO3-N was measured using the
cadmium reduction method (Mulvaney, 1996). A summary of soil properties for both sampling depths across the two site years is presented in Table 1.1.
8
Table 1.1 Summary of soil properties for soil samples acquired at depths of 0-20 cm and 20-61 cm. Soil NO3-N contents were determined on samples collected on March 22nd (at early spring)
and August 19th of 2010 (after harvest) for site year I and November 8th 2010 (at early fall) and August 22nd 2011(after harvest) for site year II.
Sampling
N at early N after
Site depths pH O.M spring harvest Sand Silt Clay Soil texture year (cm) % Mg g-1 Mg g-1 %
I 0-20 Min 7.9 1.0 22.0 5.0 64.8 13.6 9.6 Sandy Loam Mean 8.0 1.1 31.0 7.9 68.4 16.5 15.1
Max 8.1 1.3 47.0 14.0 72.8 21.6 17.6
20-61 Min 7.9 0.9 11.0 5.0 60.8 13.6 11.6 Sandy Loam Mean 8.0 1.1 22.3 12.5 67.7 16.9 15.3
Max 8.2 1.3 40.0 37.0 72.8 21.6 17.6 Sampling N at early N after
Site depths pH O.M fall harvest Sand Silt Clay Soil texture year (cm) % Mg g-1 Mg g-1 %
II 0-20 Min 7.8 1.0 30.0 8.0 58.8 4.4 12.8 Sandy Loam Mean 8.0 1.2 38.0 15.4 64.9 16.7 18.4
Max 8.1 1.5 54.0 22.0 70.8 24.4 30.8
20-61 Min 8.0 0.8 16.0 4.0 53.2 3.6 15.2 Sandy Loam Mean 8.2 1.0 22.4 9.8 61.7 17.7 20.5
Max 8.4 1.3 44.0 22.0 67.2 27.6 29.2
This study was a part of a large ongoing multi-disciplinary project. The experimental design for the large multi-disciplinary project was a split plot design. The data used in the study was analyzed as randomized block design, where the blocks are the replications and the experimental units are the 24 wheat genotypes. Site years and irrigation methods (dryland and irrigated conditions) were analyzed separately. Water application in the irrigated conditions was done based on climatological estimates of crop water use and evaporative demand. Twenty-four winter wheat genotypes were planted under both irrigated and dryland conditions. The genotypes were: Above, Ankor, Arlin, Avalanche, Baca, Bill Brown, Bond CL, CO940610, Danby, Goodstreak, Hatcher, Jagalene, Jagger, Keota, NuDakota, Platte, Prairie Red, Prowers
9
99, Ripper, RonL, Sandy, Snowmass, TAM 112, and Yuma. Dimensions of individual experimental plots were 3.7 m x 1.4 m with 6 plant rows at spacing of 22.8 cm between each row. Site years I and II were planted on October 11th (2009) and October 8th (2010) respectively, at a rate of 197,600 seeds ha-1. Nitrogen and phosphorus fertilizers were applied prior to planting on September 29th, 2009 and October 7th, 2010 under dryland and irrigated conditions for site year I and II respectively. Nitrogen dry fertilizer was applied at a rate of 84 and 112 kg N ha-1 as Urea (46-0-0) and phosphorous dry fertilizer was applied at a rate of 56 and 44.8 kg P2O5 ha-1 as
Mono-Ammonium Phosphate (11-52-0) for site year I and II respectively. Also, liquid Ammonium Phosphate was applied at rate 46.8 liter ha-1 (10-34-0) with wheat seed as a starter.
Crop biomass samples were collected five times during the growing season at various crop growth stages referred to as: early spring, jointing, anthesis, mid-grain filling and maturity. The early spring stage corresponds to the Feekes growth stage of 3 to 4 (tillers formed-leaf-sheaths lengthen), and jointing stage corresponds to the Feekes growth stage 6 (first visible node of stem). The anthesis stage corresponds to the Feekes growth stage 10.5 (flowering); the mid-grain filling stage corresponds to the Feekes growth stage 11.1 (milky ripe), and the maturity stage corresponds to the Feekes growth stage 11.4 (ripe for cutting and dead straw) (Large, 1954). Crop biomass samples consisted of 0.5 m row length acquired from each plot. Harvest biomass samples were determined with a 1 m row length and were taken from the middle of the experimental plot. Biomass samples were pulled up, bagged, and transferred to a cooler and stored at 4 oC until processed. Plants were freed from their roots and were placed into an oven to dry at about 68 oC until they reached a constant weight. Approximately ten to fifty plants were used per plot and then total aboveground biomass samples weighted, grinded, and analyzed to identify total N in crop tissue. The variation in the number of plants per sample across plots was
10
due to taking a fixed length of row (0.5 m for all biomass samplings except at maturity when a 1-m length of row was sa1-mpled) as opposed to a fixed nu1-mber of plants. The plots were harvested by plot combine on June 28th under dryland and July 6th under irrigated for site year I. For site year II plots were harvested on June 28th under dryland and July 7th under irrigated to measure grain yield.
Active remote sensing
Active remote sensing based NDVI measurements were acquired using a Greenseeker® Model 505 handheld optical sensor (NTech Industries Inc., Ukiah, California, USA). The principles of operation of the Greenseeker® were illustrated in Inman et al. (2005). The Greenseeker® generates light at two wavelengths: visible red light (R) at 656 ± 25 nm, and near-infrared (NIR) at 774 ± 25 nm (NTech, 2009). The Greenseeker® sensor is referred to as a “red sensor” and it measures light reflected from the plant canopy to calculate the NDVI. The field-of-view of the sensor is about 61cm by 1.5 cm (NTech, 2009). In-field reflectance measurements were taken by holding the Greenseeker® unit about 90 cm above the crop canopy and walking in the center of each wheat plot. Each plot was sensed for approximately two to five seconds, collecting 20 to 50 NDVI readings. The reflectance measurements were acquired weekly between 10:00 am and 2:00 pm on cloud-free days. Readings were collected from early spring wheat growth stage (March 29th, 2010) to after the mid-grain filling stage (June 21st, 2010) for site year I, and from March 21st, 2011 to June 27th, 2011 for site year II (Fig.1.1).
11
Figure 1.1 The NDVI readings were collecting using Greenseeker® handheld optical sensor. Plot boundaries are highlighted with white dashed lines.
Statistical analysis:
Statistical analysis was performed to determine differences among grain yield and NDVI readings for twenty-four wheat genotypes using analysis of variance (ANOVA) in statistical software R (R Development Core Team, 2010). Preliminary analysis indicated a significant interaction between the genotypes and plot replication indicating significant site differences across replications. This complicates the interpretation of the results since the response of NDVI to genotype cannot be explained just in terms of the main effects, (i.e.) wheat genotype. Hence, a three-step process was used to remove the site effect from the data prior to detailed statistical analysis. The first step was to remove the effect of genotype from the NDVI readings. This was
12
accomplished by a regression analysis on NDVI data against genotypes using a general linear model (GLM). The residuals from the GLM represent the site effect. The next step was to model the spatial structure of the residuals using a semi-variogram. The semi-variogram model was fit to several theoretical variogram models (e.g., Gaussian, exponential and spherical) using the method of least squares. The model that minimized the Akaike information criterion (AIC) was selected to estimate the site effect for each observation in the data using simple kriging. The final step was to subtract the estimated site effect from the observed raw data. This adjusted data set was then analyzed using ANOVA to test for the significance of genotype and replication effects. When no significant interaction between genotype and replication was observed, the approach was deemed to be successful. Pairwise comparisons were made among genotypes using Tukey HSD test.
For the purpose of illustrating spatial variability in the dataset, inverse distance weighting was used to interpolate the raw NDVI values for each treatment and date by using ArcGIS Version 9.3 (ESRI Inc., Redlands, CA.).
The linear relationship between NDVI and grain yield was determined by using Pearson‟s product-moment correlation coefficient (r) measuring strength of association between NDVI and grain yield. In addition, linear regression between NDVI and grain yield was performed using the following model:
b mx
y , Eq 2.
where y is the grain yield, m is the slope of the line, x is the NDVI and b is the intercept of the line. The coefficient of determination (R2) was used to explain the proportion of variability in grain yield explained by variability in NDVI.
13
In order to create yield productivity classes, three clustering methods were used to classify grain yield: (i) K-means clustering algorithm: (ii) subjective clustering; and (iii) stratification clustering. The mean grain yield was classified into three classes (e.g. low, medium and high) for each clustering method. The NDVI data were also classified to create three classes (e.g. low, medium and high). For NDVI data, two methods were used: K-means clustering algorithm, and stratification clustering. The NDVI classes were generated independently for each of the 11 or 14 dates for site year I or site year II respectively and likewise independently for both dryland and irrigated conditions. The K-means clustering method aims at dividing data into classes or clusters that minimize the within cluster sum of squares (described in detail by Hartigan and Wong, 1979). Stratification clustering was based on the “cumulative square root of the frequency” method described in detail by Scheaffer et al. (1990). The subjective clustering method approach was based on knowledge of researchers or cooperating producers to rank wheat genotypes as high, medium or low yield potential (Khosla et al., 2008, 2010). As opposed to genotype yield potential, no prior information was available to subjectively classify the genotypes by their expected NDVI values. Therefore, yield was classified using three methods (e.g. k-mean, stratification and subjective) while NDVI was classified using only two methods (e.g. k-mean and stratification). The NDVI or grain yield averaged across the three replications was used to classify the 24 wheat genotypes into three classes. In order to verify the performance of the clustering methods, the three clustering grain yield methods and the two NDVI clustering methods were used to build contingency tables (Hornung et al., 2006) using each possible combination of methods (e.g. k-means on yield vs. stratification on NDVI). The overall accuracy of agreement between grain yield and NDVI for 24 wheat genotypes was used to determine which of the six different combinations of methods would perform the best. The
14
best combination of methods would then be used to measure the overall accuracy of NDVI classes against yield classes, which is the main objective of this chapter.
RESULTS AND DISCUSSION
NDVI variations across growth stages
Statistical analysis using ANOVA revealed significant differences among the twenty four wheat genotypes (p < 0.05) based on NDVI readings. Differences were observed for all 11 dates in 2010 and all 14 dates in 2011 under both irrigated and dryland conditions. As expected, the NDVI values were low in early spring for both site years on March 29th and March 21st. At this growth stage early jointing, the mean NDVI value was 0.20 under both dryland (Fig.1.2) and under irrigated conditions (appendix A. Fig A.1) for site year I. For site year II the mean NDVI values were 0.23 and 0.21 under dryland and irrigated conditions, respectively (appendix A. Fig A.2 and 3). The NDVI values gradually increased with crop growth and reached a plateau in season, between jointing and anthesis growth stages. The maximum NDVI values in mid-season were around 0.89 (mean value was 0.83) under dryland (Fig. 1.2) and 0.91 (mean value was 0.89) under irrigated conditions (appendix A. Fig A.1) for site year I. For site year II the maximum NDVI values in mid-season were 0.66 (mean value 0.48) under dryland and 0.85 (mean value 0.83) under irrigated conditions (appendix A. Fig A.2 and 3). The low NDVI values during mid-season in site year II is reflective of the drought conditions the crop was experiencing. As expected, the NDVI values decreased at the end of the season (in June, anthesis to mid-grain filling stages). The mean NDVI values in late season were 0.34 under dryland (Fig.1.2) and 0.58 under irrigated conditions (appendix A. Fig A.1) for site year I. For site year II the mean NDVI values were 0.24 under dryland and 0.62 under irrigated conditions
15
(appendix A. Fig A.2 and 3). Again, lower NDVI values under dryland conditions than in the irrigated conditions at the end of season is reflective of water stress that crop experienced in water limited environment and was translated into NDVI values. Times-series of maximum, minimum and mean NDVI values for site year I in dryland plots are presented in Fig.1.2. Time series graphs for irrigated plots for site year I and for site year II in both dryland and irrigated plots (appendix A) had trends similar to that reported in Fig.1.2.
Figure 1.2 Time-series of maximum, minimum and mean NDVI values for individual winter wheat genotype (CO940610) selected across the growing season under dryland conditions for site I (11 dates for NDVI readings). Crop growth stages are indicated as E=early spring, J= jointing, H= heading, A= anthesis, and MG= mid-grain filling.
Our results indicate that NDVI values accurately characterized the generalized wheat crop growth curve. The NDVI values consistently increased with crop growth stages in early season and it reached a plateau when the ground surface was completely covered by the canopy. The plateau in NDVI values seems to correspond to the saturation of the sensor that loses sensitivity to changes in vegetation amount when LAI is higher than 3 (Aparicio et al., 2000;
16
Carlson and Ripley, 1997; Duchemin et al., 2006). The NDVI decrease at the end of the season is attributed to physiological maturity, change in crop color and senescence leaf, which increases red band reflectance and decreases NIR band reflectance. This phenomenon was observed by Aparicio et al. (2000) and Prasad et al. (2007) on vegetation with lower amount of green biomass due to either water stress or to normal senescence through the mid-grain filling stage. As expected, we observed increasing green biomass from early spring to mid-season and decreasing green biomass from mid-season to late season, which was reflected into NDVI values. Other reflectance based indices such as green NDVI (GNDVI) and SR can also detect seasonal variations in green biomass (Babar et al., 2006a; Prasad et al., 2007).
In-field spatial variability of winter wheat
In-field spatial variability in NDVI across wheat genotypes was observed in both site years and under both dryland and irrigated conditions (appendix A. Fig. A.4, 5 and 6). Visual assessment of NDVI maps indicates that a higher level of spatial variability existed under dryland conditions for site year II (Fig1.3) across 24 wheat genotypes. This may potentially be explained by different water stress responses across genotypes, which could differently affect the chlorophyll content and green biomass from one genotype to the other (Aparicio et al., 2000). Spatial variability of NDVI measurements was also observed by Verhulst and Govaerts (2010) and by Verhulst et al. (2009).
17
Figure 1.3 Maps of spatial variability in NDVI values across 24 winter wheat genotypes collected under dryland conditions for 14 dates across site year II.
18
Grain yield of genotypes
There was no significant difference (p-value < 0.05; Appendix A) in grain yield among the 24 winter wheat genotypes in site year I under either dryland or irrigated conditions. In site year II, there was a significant difference (p-value < 0.05) in grain yield among the 24 winter wheat genotypes under both dryland and irrigated conditions. The grain yield ranged from 1.57 to 6.43 (mean value 3.98) Mg ha-1 under dryland conditions and from 5.34 to 9.49 (mean value 7.11) Mg ha-1 under irrigated conditions for site year I. For site year II, grain yield ranged from 1.41 to 5.54 (mean value 3.51) Mg ha-1 under dryland conditions and from 5.27 to 10.93 (mean value 7.94) Mg ha-1 under irrigated conditions. Under dryland conditions, site year I had significantly (p-value <0.05) higher grain yield (mean yield 3.98 Mg ha-1) than site year II (mean yield 3.51 Mg ha-1) likely due to the amount of precipitation received for site year I. The site year I received approximately 84 mm additional growing season precipitation than that for site year II. On the other hand, site year II had significantly (p-value <0.05) higher grain yield (mean yield 7.94 Mg ha-1) than site year I (7.11 Mg ha-1) under irrigated conditions. The variability in grain yield across the 24 wheat genotypes was high across both site years and under both dryland and irrigated conditions as illustrated by a difference between highest and lowest grain yield. Despite a large range of yield values across genotypes under both conditions, the yield was not significantly different across genotypes in site year I due to a large sum of squares of the residuals as compared to the genotype and replication effect. Conversely, in site year II, the genotype and the replication effect were explaining most of the yield. Genotypic variability for grain yield and NDVI at different stages and between dryland and irrigated conditions was observed for both site years possibly due to different water status between the two conditions. Genotypic variability for yield was observed among 25 durum wheat genotypes within and
19
across dryland and irrigated conditions, with winter wheat and with durum wheat under dryland conditions (Prasad et al., 2007; Royo et al., 2003).
Relationship between NDVI and grain yield
The correlation coefficient (r) between NDVI and grain yield with 72 observations (24 wheat genotypes times 3 replications) was significant for all growth stages (α=0.05). The highest correlation (r = 0.79) was observed at early season stage (March 29th) as well as late in the growing season, at mid-grain filling stage (June 21st) under dryland conditions for site year I (Fig.1.4). Under irrigated conditions, the correlation coefficient between NDVI and grain yield was significant at early spring and anthesis (p-value > 0.05), and not significant at jointing and mid-grain filling stages (p-value < 0.05) for site year I (Fig.1.4). The highest correlation coefficient was observed in early spring stage on March 29th (r=0.47). For site year II, the correlation coefficient between NDVI and grain yield was significant (p-value < 0.05) for all growth stages, increasing from early spring to mid-grain filling stages. The highest correlation coefficient (r=0.91) was observed between anthesis and mid-grain filling stages (Fig.1.4). Under irrigated conditions the correlation coefficient between NDVI and grain yield was significant for all growth stages (p-value < 0.05). The highest correlation coefficients were observed at early spring (r=0.53) and after mid-grain filling (r=0.54) stages. A weak correlation was observed at anthesis stage for site year II as illustrated in Fig.1.4.
20
Figure 1.4 Correlation coefficient (r) between NDVI and grain yield across 24 winter wheat genotypes for site year I and II under dryland (solid line) and irrigated (dashed line) conditions across crop growth stages. E=early spring, J= jointing, A= anthesis, and MG= mid-grain filling. Solid symbols indicate significant correlation between NDVI and yield (p-value <0.05).
21
The correlation coefficient (r) between NDVI and grain yield was the lowest at jointing under dryland conditions for site year I. This could potentially be attributed to normal growth in crop biomass at this growth stage and to the amount of precipitation received (approximately 84 mm more precipitation than for site year II during growing season). Low r square in the mid-season under dryland conditions in site year I was potentially related to a large precipitation event (61.21 mm of rain over eight days at this growth stage) could have led to higher biomass, chlorophyll content and canopy cover which may have resulted in NDVI saturation. This was also observed under irrigated conditions for both site years. Nevertheless, our results suggest thatNDVI could assist in assessing grain yield at early spring and after anthesis to mid-grain filling growth stages under dryland conditions when the NDVI values are below the saturation level of 0.9. Findings of this study are consitent with previous studies. A positive correlation was observed between NDVI and grain yield with durum wheat stages under dryland conditions (Aparicio et al., 2000). Also, a positive correlation between NDVI and grain yield was observed at anthesis and mid-grain filling stage (Marti et al., 2007; Royo et al., 2003).
Figures 1.5 and 1.6 illustrates the relationship between NDVI and yield as assessed by regression analysis. The coefficient of determination (R2) shows the strength of the relationship between NDVI and grain yield for all stages under dryland conditions. The relationship was the weakest at jointing stage (R2=0.16), and the strongest (R2=0.62) at early season and mid-grain filling (Fig. 1.5). The weakest relationship (R2=0.41) was observed after mid-grain filling and the strongest relationship (R2 =0.83) just before mid-grain filling (Fig. 1.5). Under irrigated conditions, the coefficient of determination (R2) was low, indicating a weak relationship between NDVI and grain yield for all growth stages in both site years. The strongest relationship was observed at early spring in both site years (Fig. 1.6).
22
Figure 1.5 Relationship between NDVI and grain yield across 24 winter wheat genotypes under dryland conditions across crop growth stages. Crop growth stages are indicated as E=early spring, J= jointing, A= anthesis, and to MG= mid-grain filling.
23
Figure 1.6 Relationship between NDVI and grain yield across 24 winter wheat genotypes under irrigated conditions across crop growth stages. Crop growth stages are indicated as E=early spring, J= jointing, A= anthesis, and to MG= mid-grain filling.
24
Comparing NDVI and yield classification
The two clustering methods (K-means and stratification clustering) employed in grain yield data classification produced almost the same results under both dryland (Fig. 1.7a) and irrigated conditions (Fig. 1.7b). Based on contingency table analysis, the overall accuracy between NDVI classes (either K-means or stratification clustering) and subjective classification of yield potential was low. For this reason and since the K-means clustering method is widely used by the scientific community, the K-means clustering method results were selected to show agreement of classification between grain yield classes and NDVI classes (Figs. 1.8 and 1.9).
25
Figure 1.7 Overall accuracy results from contingency table comparing mean grain yield classes to mean NDVI classes using K-means clustering (solid line with squares) and stratification clustering (dashed line with circles). The overall accuracy is presented across 14 dates for site year II under (a) dryland conditions and (b) irrigated conditions. E=early spring, J= jointing, A= anthesis, and MG= mid-grain filling.
K-means clustering method
The quantitative clustering approach consisted of using K-means clustering algorithm (three clusters) to classify the 24 wheat genotypes based on the average NDVI values and based
26
on the average grain yield across the three replications for each date. Table 1.2 presents a contingency table that compares grain yield classes to NDVI classes for all dates and both site years in this study.
Table 1.2 Contingency table comparing grain yield classes to NDVI classes for all dates, site years and water regimes (dryland and irrigated conditions) in this study merged together. The overall accuracy is presented in the lower right end of the table.
---NDVI class---
Yield class Low Medium High % accuracy Low 203 168 100 43.1 Medium 137 204 139 42.5 High 28 94 127 51.0 % accuracy 55.2 43.8 34.7 44.5*
*Overall accuracy = Sum of diagonal values x 100 / Sum of the whole table
The diagonal sum of the contingency table gives the overall accuracy of the agreement between grain yield and NDVI classes. The overall accuracy measured over the whole dataset of this study was 44.5 %. For site year I, the overall accuracy between NDVI (all 11 dates together) and grain yield was 50.8% and 43.2% under dryland and irrigated conditions respectively. For site year II, the overall accuracy between NDVI (all 14 dates together) and grain yield was 44.9% and 40.2% under dryland and irrigated conditions respectively. The results show that overall accuracy under dryland conditions was higher than overall accuracy under irrigated conditions for both site years. As per overall accuracy results for dryland conditions, clustering the genotypes as low, medium or high classes did not improve the correlation between yield and NDVI (Fig.1.8 and 1.9). As compared to a correlation coefficient observed between NDVI and grain yield with 72 observations (Figs. 1.4) across two site years. In site year I, under irrigated conditions, the clustering of genotypes into three classes improved the overall accuracy (Fig. 1.8)
27
in general as compared to correlation coefficient over 72 observations (Fig. 1.4). For site year II, there was improvement in correlation only in mid-season using clustering of genotypes (Fig. 1.9) as compared to a correlation coefficient between NDVI and grain yield with 72 observations (Fig. 1.4). We thus believe that clustering the genotypes into classes rather than comparing them independently could be useful when there is canopy closure or high LAI. Indeed, in these circumstances, the sensitivity of NDVI diminishes due to saturation and only substantial variations in yield can be detected using the Grennseeker®.
Figure 1.8 Overall accuracy between grain yield and NDVI classes for site year I (dryland with solid line and irrigated with dashed line). E=early spring, J=jointing, A=anthesis, MG=mid-grain filling stage.
28
Figure 1.9 Overall accuracy between grain yield and NDVI classes for site year II (dryland with solid line and irrigated with dashed line). E=early spring, J= jointing, A= anthesis, and MG= mid-grain filling.
For dryland experiment, based on overall accuracy results comparing grain yield classes to NDVI classes, anthesis to mid-grain filling stages would be the most appropriate stages to classify wheat genotypes. As opposed to dryland conditions, the wheat genotypes grown under irrigated conditions did not respond similarly years. In site year I, the overall accuracy was higher later in the season while in site year II, the overall accuracy was higher early in the season. In general, the decrease in the correlation and overall accuracy results between NDVI and grain yield across 24 wheat genotypes coincided with mid-season, when NDVI saturated. The NDVI index normally reaches a plateau with a LAI of three or more (Aparicio et al., 2002; Carlson and Ripley, 1997). When NDVI plateaus (or saturates), it loses its sensitivity to variations in biomass, LAI or chlorophyll content. It was reported that, with a LAI above 3, canopy closure is reached, and red reflectance decreases to minimum values (around 3 to 4 % of incident light) because 70 to 90 % of incident light is absorbed by chlorophyll in the upper leaves
29
and the rest is transmitted (Aparicio et al., 2002). In contrast, the NIR reflectance increases with canopy closure because chlorophyll reflects NIR more than bare soil (Aparicio et al., 2002). Therefore, NDVI saturates because of low red reflection in crop canopy and not because of Greenseeker® sensitivity.
Our results partially support our hypothesis according to which it is possible to use active sensor based NDVI as a tool to differentiate and classify wheat genotypes. In general the results showed that NDVI differentiates and classifies better after anthesis and in mid-grain filling stages. Also, classification is better under dryland than irrigated conditions. The potential of spectral reflectance indices to differentiate for grain yield was also observed on wheat genotypes under irrigated conditions (Babar et al., 2006a). However, Babar et al. (2006a) did not use Greenseeker® sensor to obtain reflectance, but rather a portable narrow-bandwidth spectroradiometer (Model Field-Spec UV/VNIR, Analytical Spectral Devices, Boulder, CO). Our results indicate that breeders who work on drought resistant traits and grow wheat in dryland may benefit from uses NDVI as a screening tool more than breeders who grow wheat in irrigated condition for other traits such as disease resistance or nitrogen use efficiency for example. The potential of NDVI for screening and ranking genotypes based on their grain yield was also demonstrated on soybean genotypes (Ma et al., 2001). We thus believe that the use of NDVI as a tool to identify high yielding genotypes also has potential with crops other than wheat.
It is important to mention that the Greenseeker®‟s active sensor was developed to detect N stressed plants for variable rate nitrogen management and not necessarily to differentiate healthy genotypes. Therefore, more research could be done to identify wavebands that would be specifically efficient at differentiating genotypes that are not N-stressed and for which reflectance would not tend towards zero in healthy canopy readings, as it is the case for red
30
reflectance. This could allow differentiation of genotypes at any growth stage and water management conditions.
CONCLUSION
Active remote sensing based on NDVI was assessed as a tool to identify and differentiate wheat genotypes. A strong relationship was observed between NDVI and grain yield across 24 wheat genotypes under dryland conditions. Our results suggest that NDVI could assess grain yield under dryland conditions but show limitations under irrigated conditions. The overall accuracy between NDVI and grain yield classes across growth stages indicated that the most appropriate stage to identify and classify wheat genotypes was from anthesis to mid-grain filling stages. Our results also indicate that NDVI readings collected by Greenseeker® successfully classified wheat genotypes across dryland and irrigated cropping systems into grain yield classes. This study demonstrates the potential and limitations of using NDVI readings as a tool to differentiate and identify wheat genotypes based on their productivity potential. More work could be done to identify the best wavebands and indexes to specifically differentiate genotypes.
31
REFERENCES
Aparicio, N., D. Villegas, J. Casadesús, J.L. Araus, and C. Royo. 2000. Spectral vegetation indices as nondestructive tools for determining durum wheat yield. Agron. J. 92:83-91. Aparicio, N., D. Villegas, J. Araus, J. Casadesús, and C. Royo. 2002. Relationship between
growth traits and spectral vegetation indices in durum wheat. Crop Sci. 42:1547-1555. Araus, J., J. Casadesús, and J. Bort. 2001. Recent tools for the screening of physiological traits
determining yield. In: M. P. Reynolds, et al. (Eds.), Application of physiology in wheat breeding. CIMMYT, Mexico, DF. pp. 59-77.
Babar, M., M. Reynolds, M. van Ginkel, A. Klatt, W. Raun, and M. Stone. 2006a. Spectral reflectance indices as a potential indirect selection criteria for wheat yield under irrigation. Crop Sci. 46:578-588.
Babar, M., M. Reynolds, M. Van Ginkel, A. Klatt, W. Raun, and M. Stone. 2006b. Spectral reflectance to estimate genetic variation for in-season biomass, leaf chlorophyll, and canopy temperature in wheat. Crop Sci. 46:1046-1057.
Ball, S.T., and C.F. Konzak. 1993. Relationship between Grain Yield and Remotely‐Sensed Data in Wheat Breeding Experiments. Plant Breeding. 110:277-282.
Cabrera-Bosquet, L., G. Molero, A. Stellacci, J. Bort, S. Nogués, and J. Araus. 2011. NDVI as a potential tool for predicting biomass, plant nitrogen content and growth in wheat genotypes subjected to different water and nitrogen conditions. Cereal Res. Commun. 39:147-159.
Campbell, J.B. 2002. Introduction to remote sensing. 3rd ed. Guilford Press, New York.
Carlson, T.N., and D.A. Ripley. 1997. On the relation between NDVI, fractional vegetation cover, and leaf area index. Remote Sens. Environ. 62:241-252.
Crabb, J.A. 1980. Soil survey of Weld County, Colorado, southern part, USDA, Soil Conserv. Serv, Washington, DC.
32
Duchemin, B., R. Hadria, S. Erraki, G. Boulet, P. Maisongrande, A. Chehbouni, R. Escadafal, J. Ezzahar, J. Hoedjes, M. Kharrou, S. Khabba, B. Mougenot, A. Olioso, J.C. Rodriguez, and V. Simonneaux. 2006. Monitoring wheat phenology and irrigation in Central Morocco: On the use of relationships between evapotranspiration, crops coefficients, leaf area index and remotely-sensed vegetation indices. Agr. Water Manage. 79:1-27.
Elliott, G., and K. Regan. 1993. Use of reflectance measurements to estimate early cereal biomass production on sandplain soils [barley; wheat]. Aust. J. Exp. Agric. 33:179-183. Erdle, K., B. Mistele, and U. Schmidhalter. 2011. Comparison of active and passive spectral
sensors in discriminating biomass parameters and nitrogen status in wheat cultivars. Field Crop Res. 124:74-84.
Evans, J.R. 1989. Photosynthesis and nitrogen relationships in leaves of C3 plants. Oecologia 78:9-19.
Gee, G., and J. Bauder. 1986. Particle-size analysis. In: A. Klute (Ed.), Methods of soil analysis, Part 1. , Agron. Monogr. 9. ASA and SSSA, Madison, WI. pp. 383-411.
Govaerts, B., and N. Verhulst. 2010. The normalized difference vegetation index (NDVI) GreenSeekerTM handheld sensor: Toward the integrated evaluation of crop management. Part A: Concepts and case studies., Mexico, D.F. CIMMYT.
Hartigan, J.A., and M.A. Wong. 1979. Algorithm AS 136: A k-means clustering algorithm. Appl. Statist. 28:100-108.
Heiri, O., A.F. Lotter, and G. Lemcke. 2001. Loss on ignition as a method for estimating organic and carbonate content in sediments: reproducibility and comparability of results. J. Paleolimnol. 25, 101–110.
Hornung, A., R. Khosla, R. Reich, D. Inman, and D. Westfall. 2006. Comparison of site-specific management zones: Soil-color-based and yield-based. Agron. J. 98:407-415.
Inman, D., R. Khosla, and T. Mayfield. 2005. On-the-go active remote sensing for efficient crop nitrogen management. Sensor Rev. 25:209-214.
33
Inman, D., R. Khosla, R. Reich, and D. Westfall. 2007. Active remote sensing and grain yield in irrigated maize. Precision Agric. 8:241-252.
Khosla, R., D. Westfall, R. Reich, J. Mahal, and W. Gangloff. 2010. Spatial variation and site-specific management zones. In: M. A. Oliver (Ed.), Geostatistical Applications for Precision Agriculture. pp. 195-219.
Khosla, R., D. Inman, D. Westfall, R. Reich, M. Frasier, M. Mzuku, B. Koch, and A. Hornung. 2008. A synthesis of multi-disciplinary research in precision agriculture: site-specific management zones in the semi-arid western Great Plains of the USA. Precision Agric. 9:85-100.
Koch, B., and R. Khosla. 2003. The role of precision agriculture in cropping systems. J. Crop Prod. 9:361-381.
Lamb, D., M. Steyn-Ross, P. Schaare, M. Hanna, W. Silvester, and A. Steyn-Ross. 2002. Estimating leaf nitrogen concentration in ryegrass (Lolium spp.) pasture using the chlorophyll red-edge: theoretical modelling and experimental observations. Int. J. Remote Sens. 23:3619-3648.
Large, E.C. 1954. Growth stages in cereals illustration of the Feekes scale. Plant Pathol. 3:128-129.
Ma, B., L.M. Dwyer, C. Costa, E.R. Cober, and M.J. Morrison. 2001. Early prediction of soybean yield from canopy reflectance measurements. Agron. J. 93:1227-1234.
Marti, J., J. Bort, G. Slafer, and J. Araus. 2007. Can wheat yield be assessed by early measurements of Normalized Difference Vegetation Index? Ann. Appl. Biol. 150:253-257.
Mulvaney, R. 1996. Nitrogen-inorganic forms. In: D. Sparks, et al. (Eds.), Methods of soil analysis. Part 3-chemical methods., SSSA Book Ser. No. 5. SSSA and ASA, Madison, WI. pp. 1123-1184.
34
NTech. 2009. NTech Industries Model 500 Series GreenSeeker® Sensor. NTech Industries, Inc., 740 South State Street Ukiah, CA 95482.
http://www.ntechindustries.com/lit/gs/DataSheet_Model_500_GS_Sensor.pdf. (Last visit: October 2nd 2012).
Prasad, B., B. Carver, M. Stone, M. Babar, W. Raun, and A. Klatt. 2007. Potential use of spectral reflectance indices as a selection tool for grain yield in winter wheat under Great Plains conditions. Crop Sci. 47:1426-1440.
Raun, W.R., J.B. Solie, G.V. Johnson, M.L. Stone, E.V. Lukina, W.E. Thomason, and J.S. Schepers. 2001. In-season prediction of potential grain yield in winter wheat using canopy reflectance. Agron. J. 93:131-138.
Regan, K., K. Siddique, N. Turner, and B. Whan. 1992. Potential for increasing early vigour and total biomass in spring wheat, 2. Characteristics associated with early vigour. Aust. J. Agric. Res. 43:541-553.
Reynolds, M., B. Skovmand, R. Trethowan, R. Singh, and M. van Ginkel. 2001. Applying physiological strategies to wheat breeding. Research Highlights of the CIMMYT Wheat Program, 1999-2000. Mexico, D.F. 1:49-56.
Royo, C., N. Aparicio, D. Villegas, J. Casadesus, P. Monneveux, and J. Araus. 2003. Usefulness of spectral reflectance indices as durum wheat yield predictors under contrasting Mediterranean conditions. Int. J. Remote Sens. 24:4403-4419.
Scheaffer, R., W.O. Mendenhall, and L. Ott. 1990. Elementary Survey Sampling, 4th edition, PWS-Kent, Boston.
Schepers, J. 2008. Active sensor tidbits., InfoAg 2005.
Serrano, L., I. Filella, and J. Penuelas. 2000. Remote sensing of biomass and yield of winter wheat under different nitrogen supplies. Crop Sci. 40:723-731.
35
Shaver, T., R. Khosla, and D. Westfall. 2010. Evaluation of two ground-based active crop canopy sensors in maize: growth stage, row spacing, and sensor movement speed. Soil Sci. Soc. Am. J. 74:2101-2108.
Shaver, T., R. Khosla, and D. Westfall. 2011. Evaluation of two crop canopy sensors for nitrogen variability determination in irrigated maize. Precision Agric. 12:892-904.
R Development Core Team. 2010. R: A language and environment for statistical computing, R Foundation for Statistical Computing, Vienna, Austria, ISBN 3-900051-07-0, URL,
http://www.R-project.org. (Last visit: October 2nd 2012).
Thomas, G. 1996. Soil pH and soil acidity. In: D. Sparks, et al. (Eds.), Methods of soil analysis. Part 3-chemical methods., SSSA Book Ser. No. 5. SSSA and ASA, Madison, WI. pp. 475-490.
Tubaña, B., D. Harrell, T. Walker, J. Teboh, J. Lofton, Y. Kanke, and S. Phillips. 2011. Relationships of spectral vegetation indices with rice biomass and grain yield at different sensor view angles. Agron. J. 103:1405-1413.
USDA. CoAgMet Raw Data Access, Greeley and Greeley 4 Stations.
http://climate.colostate.edu/~coagmet/rawdata_form.php. (Last visit: October 2nd 2012). Verhulst, N., and B. Govaerts. 2010. The normalized difference vegetation index (NDVI)
GreenSeekerTM handheld sensor: Toward the integrated evaluation of crop management. Part B: User guide. , Mexico, D. F. CIMMYT.
Verhulst, N., B. Govaerts, K. Sayre, J. Deckers, I. François, and L. Dendooven. 2009. Using NDVI and soil quality analysis to assess influence of agronomic management on within-plot spatial variability and factors limiting production. Plant Soil 317:41-59.
36 CHAPTER II
Characterizing Variation in Nitrogen Use Efficiency for Wheat Genotypes across Dryland and Irrigated Conditions
SUMMARY OF CHAPTER II
Global nitrogen use efficiency (NUE) is estimated to be about 33% for cereal production. Increase in N fertilizer prices and growing environmental concerns are both reinforcing producers to improve NUE. The two main approaches to improve NUE are selecting genotypes for high NUE and improving nitrogen management. Remote sensing tools are helping improve NUE through nitrogen management and could also be useful in identifying high NUE genotypes. The objectives of this study were (i) to identify and quantify the main sources of variation in NUE across winter wheat genotypes (Triticum aestivum L.) and (ii) to determine if normalized difference vegetation index (NDVI) could characterize variability in NUE across wheat genotypes. This study was conducted on twenty-four winter wheat genotypes in north eastern Colorado in 2010 and 2011. The NDVI was measured weekly by Greenseeker®, and NUE was calculated as partial factor productivity and as partial nitrogen balance at the end of the crop growing season. The parameters (N uptake efficiency, N utilization efficiency, biomass production efficiency, and ratio of grain N content to biomass weight) related to NUE were also calculated to measure their relative importance in the variations of NUE. Our results indicate that nitrogen uptake efficiency was the main source of variation of NUE among genotypes. We observed a strong relationship between NDVI and NUE across the 24 wheat genotypes under dryland conditions and a poor association under irrigated conditions. These limitations seem to be linked to NDVI saturation. The results of this study indicate that NDVI is a good vegetative