This is an author produced version of a paper published in Open house
International. This paper has been peer-reviewed but does not include the
final publisher proof-corrections or journal pagination.
Citation for the published paper:
Siggelsten, Simon; Nordquist, Birgitta; Olander, Stefan. (2014). Analysis of
the accuracy of individual heat metering and charging. Open house
International, vol. 39, issue 2, p. null
URL: http://hdl.handle.net/2043/18246
Publisher: Open House International Association
This document has been downloaded from MUEP (https://muep.mah.se) /
DIVA (https://mau.diva-portal.org).
en h ou se in te rn at io na l v ol .3 9 n o. 2, Ju ne 2 01 4. A na ly sis o f t he A cc ur ac y of in di vi du al h ea t M et er in g an d c ha rg in g. 1 i ntro ductio n
individual metering and charging (iMc) allows energy costs to be apportioned among tenants in multi-apartment buildings based on their own ener-gy use. this results in reduced enerener-gy use due to an increased saving behavior by the tenants (schou, 1982; scott, 1991). A 10 to 20 percent reduction is realistic regarding heat use (Berndtsson, 2003; Boverket, 2006). energy savings in the housing sec-tor are encouraged by the european Parliament through the directive 2012/27/eu, which requires iMc of heat to the extent that it is cost-efficient and technically feasible.
several european countries use iMc for heat but only a few countries, e.g. denmark, pre-scribe it by law. the fastest growing development of iMc in recent years has occurred in china. since the 1990s, china has gone from not using iMc at all, to both producing and installing about 2,000,000 sets of meters in 2010 alone (Wang, 2011). due to the possibility to reduce energy use with iMc and the recommendation from the european Parliament, a large increase in iMc
installations is expected in europe. An argument against installation is the inaccuracy of current iMc methods.
in the eu-directive (2012/27/eu) two tech-niques are mentioned for iMc: individual con-sumption meters and individual heat cost alloca-tors. individual consumption meters measure the flow and temperature of water circulated in the radiator system. heat cost allocators measure heat consumption at each radiator in an apartment. either of these two techniques can be used as a method to measure the supplied energy to an apartment. Another method, not mentioned in the eu-directive, is temperature metering which means that the heating cost is based instead on measure-ments of the actual temperatures through sensors in certain locations in the apartment. this method has been chosen primary by municipally-owned real estate companies in sweden, which are overrepre-sented among those few per cent who have installed iMc in sweden (siggelsten & olander, 2013).
the energy supplied to an apartment is not necessarily equal to the actual energy needed or used. Poor thermal insulation between adjacent
Simon Siggelsten, Birgitta Nordquist, Stefan Olander
Abstract
Individual metering and charging (IMC) allows energy costs to be apportioned among tenants in multi-apartment build-ings based on their own energy use. This can result in reduced energy use due to an increased saving behaviour by tenants, which has caught the attention of the European Parliament. In the EU-directive 2012/27/EU there is a require-ment for IMC to be installed by December 31, 2016 in multi-apartrequire-ment buildings.
Two techniques are mentioned in the directive for IMC: individual consumption meters and individual heat cost alloca-tors. Either of these two techniques can be used as a method to measure the supplied energy to an apartment. Another method, not mentioned in the EU-directive, is temperature metering which means that the heating cost is instead based on measurements of the actual temperatures through sensors in certain locations in the apartment. However, some shortcomings have been identified with the aforementioned methods.
The purpose of this study is to investigate how internal heat production, solar radiation, an apartment’s location within the building and local defects in the building envelope affect the accuracy of IMC. The Energy demands of three apart-ments in different locations within the building have been simulated in the computer program VIP-Energy. The results of energy calculations prove that the accuracy of IMC is highly questionable in some of the investigated cases. The impli-cation of the study is that it is difficult to measure the actual heat used for an individual apartment, which obstructs accu-rate and fair apportioning of heating costs among individual tenants.
Keywords: EU-Directive, Energy Use, IMC, Apartment Building.
AnAlysis of the AccurAcy of individuAl heAt
Metering And chArging.
si m on s ig ge lst en , B irg itt a n or dq ui st, s te fa n o la nd er op en h ou se in te rn at io na l v ol .3 9 n o. 2, Ju ne 2 01 4. A na ly sis o f t he A cc ur ac y of in di vi du al h ea t M et er in g an d c ha rg in g.
apartments means that heating energy will be trans-mitted from one apartment to another, which makes it difficult to say which apartment used what amount of energy. gafsi and lefebvre (2003) have conducted a study of this problem and investigated an apartment located in the middle of a building, together with meteorological data of two weeks in december in spain. their results show that it is pos-sible to gain up to about 90 per cent of the heating energy needed from the surrounding neighbors. Andersson (2001) has investigated the even more extreme location of an apartment in an existing building in sweden, a relatively small apartment (55 m2) surrounded by adjacent apartments with the exception of one side only. the results show that it is possible to gain more than 95 per cent of the heating energy needed from the surrounding neighbors.
the problem with heat transmission between adjacent apartments can be partly avoid-ed by measuring the actual temperature in the apartments instead. Measuring the actual tempera-ture in the apartment can also pose problems, e.g. deleterious window ventilation. the problem with window ventilation is that it lowers the indoor tem-perature, which reduces the heating cost for the tenant at the same time as it increases the heat leading in turn to increased heating costs for the landlord.
the main purpose of this study is to investigate how the accuracy of iMc is affected by:
1. internal heat production and solar radiation. 2. An apartment’s location in the building. 3. local defects in the building envelope.
the aim is to investigate the extent to which these parameters affect the result of iMc in combination with different family configurations.
2 research m etho d
the main tool used in this investigation is the com-puter program viP-energy (strusoft®, 2010), which is a series of software modules covering the calcu-lation of the energy balance for an entire building. some of the most important factors influencing the need for energy are the outdoor climate and the building’s exposure to sun and wind together with the building’s ability to store heat. viP-energy is based on a dynamic energy equation using a phys-ical model of the building and real weather data. the program contains calculation methods for heat storage, air infiltration, solar radiation, transmission through the ground, heat pumps etc. (ibid.).
three apartments in different locations in two multi-apartment buildings have been simulat-ed. differently located apartment imply different amounts of exterior area (building envelope) and different exposures to solar radiation. the amount of exterior area together with the u-value will influ-ence the extent of the heat loss due to transmission. the two different multi-apartment buildings have different u-values. the first multi-apartment build-ing is an average modern buildbuild-ing built at the beginning of the 21st century. the second building is representative for the construction intensive peri-od 1961 to 1975 and represents approx. 25 per cent of today’s multi-apartment buildings in sweden (Boverket, 1999).
internal heat production also influences a building’s heat demand. for example, a larger family will contribute a higher amount of body heat and heat from electrical appliances compared to a smaller family. in order to investigate the influence of internal heat production, three different settings for internal heat production are used to represent different family sizes when making the simulations in viP-energy.
3 input data
three different family configurations and three dif-ferent apartment locations in two difdif-ferent building will give 18 different cases in total. All the calcula-tions, which are made with viP-energy, are based on the assumption that all apartments and stairwells are set to the same indoor temperature as in the investigated apartments. this means in practice that heat transmission will only occur through the build-ing envelope and not between adjacent apartments or the stairwell.
the climate input data is for Malmö locat-ed in the south of swlocat-eden. All calculations are based on a time period of six months, from 1st of october to 31st of March, which is the typical sea-son when heating is needed in Malmö. the indoor temperature is set to 22.3 °c, the average indoor temperature for swedish multi-apartment buildings (Boverket, 2009).
3 .1 T wo mult i-ap ar tme nt bu ild ing s wit h t hr ee a par t me nt s
the first multi-apartment building, henceforth referred to as Building 1, is a typical modern apartment building with average figures for multi-apartment buildings built in sweden during the period 1996 to 2005. Building 1 has a loadbear-ing structure of concrete with 195 mm thick walls
en h ou se in te rn at io na l v ol .3 9 n o. 2, Ju ne 2 01 4. A na ly sis o f t he A cc ur ac y of in di vi du al h ea t M et er in g an d c ha rg in g. si m on s ig ge lst en , B irg itt a n or dq ui st, s te fa n o la nd er
between apartments and 250 mm thick floor slabs with 22 mm wooden floors. the u-value for the outer walls is 0.20 W/m2K and that for the ceiling is 0.12 W/m2K. the windows are triple-glazed with a u-value of 2.0 W/m2K.
the second multi-apartment building, henceforth referred to as Building 2, is a typical building from the construction intensive period 1961 to 1975 in sweden. the loadbearing struc-ture of concrete has 150 mm thick walls separating apartments and 160 mm thick floor slabs with 22 mm wooden floor. the u-value for the external walls is 0.37 W/m2K and that for the roof is 0.28 W/m2K. the windows are doubled-glazed with a u-value of 2.7 W/m2K. All of these u-values are representative for their time (eriksson, 1993). All the above figures for Buildings 1 and 2 are set out in table 1.
neither building has been modified with heat recovery from ventilation air. the amount of ventilation in all apartments is set to 0.5 air changes per hour, in compliance with swedish reg-ulations.
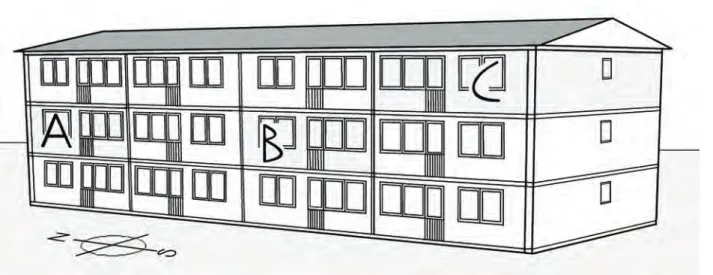
three apartments (A, B and c) have been simulated with different conditions, such as floor, orientation and the area abutting on adjacent apartments, see figures 1 and 2. these conditions together with the apartments’ layouts are used identically for Buildings 1 and 2. the layout is the original for the multi-apartment building which
serves as a model for building 2. Apartment A is located on floor two out of three at the north gable of the building. the apartment is surrounded by apartments below, above and on one side. Apartment B is also located on floor two but in the middle of the building with apartments above, below and on both sides. Apartment c is located on the top floor at the south gable of the building, with apartments below and on one side, resulting in the maximal area of outer walls and roof. the lay-outs of the apartments also affect the amount of area adjacent to other apartments, which can be seen in figure 2. All three apartments have the same window sizes and orientation, except for the additional small windows on the gables for ments A and c. All three are two bedroom apart-ments with 74 square meters of living space. in the following, the apartments are sometimes represent-ed by a number, e.g. apartment A1. this refers to apartment A in Building 1.
All apartments in this study have identical wall areas adjacent to the stairwells. the study assumes that both stairwells in the buildings have the same indoor temperature and for that reason the heat transmissions between the stairwells and the apartments are excluded, i.e. viewed as a non-influencing parameter. therefore all apartments have been simulated individually in viP-energy and not as a complete building unit.
Table 1.Areas and U-values for the building envelope.
si m on s ig ge lst en , B irg itt a n or dq ui st, s te fa n o la nd er op en h ou se in te rn at io na l v ol .3 9 n o. 2, Ju ne 2 01 4. A na ly sis o f t he A cc ur ac y of in di vi du al h ea t M et er in g an d c ha rg in g.
3 .2 Family con ste llat ion s
three different family sizes have been simulated to investigate their effect on the energy balance and, in turn, the consequences for iMc. the intention is to simulate the limit of family sizes that can be expected to be living in a two bedroom apartment with 74 m2 of living space. the body heat gain is estimated according to standard values from fanger (1997) based on the following activities: • resting 46 W/m2 (square meter body surface)
• sitting activity 58 W/m2
• calm standing activity 70 W/m2
• normal standing activity 93 W/m2
• domestic work 116 W/m2
the internal heat production based from lighting and electrical appliances is estimated on the basis of average household electricity usage, compiled by the swedish energy Agency (energimyndigheten, 2007). the starting point for occupancy A is a sin-gle adult who does not spend too much time at home. he or she is away from home 12 hours per day and watches television 1 hour per day. occupancy B consists of two adults spending 14 hours per day at home, representing a normal-sized family for this size of apartment. they watch television 1.5 hour per day. occupancy c consists of two adults and three children. their time spent away from home varies for all family members between 4 to 10 hours per day. their television is on for 3 hours per day. All assumptions about the three different family sizes have resulted in different values for body heat gain and internal heat pro-duction for each family, which are all presented in table 2.
3 .3 En velop e def ec t s
the intention is also to study the significance of two plausible defects in the building envelope, and their influence on the result of iMc. the first defect is a 3 cm gap without insulation wool around the win-dows on the western side of the building. the sec-ond defect is a broken frame in one window, rais-ing the u-value of the window by an estimated 0.3 W/m2K. Both defects can be seen as plausible: the first defect is because of carelessness during con-struction while the second defect can occur when a window is old. All these simulations are also made with viP-energy.
4 results
the energy calculations are isolated to include only the energy usage for heating connected to the spe-cific apartment. this means that the figures cannot be compared with standard energy calculations for an entire building, which include hot water, resi-dential electricity, heating of the stairwells and other common spaces etc. All figures in the following tables are based on a time period of six months, from 1st of october to 31st of March.
Figure 2.An illustration of the layouts.
Table 2.Body heat gain and internal heat production divid-ed by the apartment size.
en h ou se in te rn at io na l v ol .3 9 n o. 2, Ju ne 2 01 4. A na ly sis o f t he A cc ur ac y of in di vi du al h ea t M et er in g an d c ha rg in g. si m on s ig ge lst en , B irg itt a n or dq ui st, s te fa n o la nd er 4 .1 Sup plied h ea t
Supplied heat includes the four categories: supplied
energy, internal heat production, body heat gain and solar radiation. Supplied energy is the need for purchased/delivered energy. these four categories are presented in tables 3 and 4, for Building 1 and Building 2 respectively.
internal heat production, solar radiation and body heat gains have significance for energy supplied to all apartments. in apartment B1, the need for supplied energy increases by 27 per cent for occupancy A compared to occupancy B, and decreases by 39 per cent for occupancy c (see table 3). this high percentage difference in apart-ment B1 is due only to its lesser need for supplied heat. With a larger need for supplied heat, as in apartment c2, the percentage difference is lower as there is an 11 per cent increase for occupancy A compared to occupancy B, and a 17 per cent decrease with occupancy c.
solar radiation varies over the season and is most intense in the summertime when there is no need for heating. Between the first of october and the end of March in sweden, solar radiation will not contribute much heat. however, it is possible to see a small difference in solar radiation depending on the orientation and whether the windows are
dou-ble-glazed or triple-glazed. A larger difference can be seen with a large difference in window area.
4 . 2 T he ap a rt me n t 's loc a tio n in th e b u ild in g
there is a difference in energy use between the three apartments. Apartment B in the middle of the building with surrounding neighbors has a favor-able location because of the limited area of exteri-or walls and ceilings. fexteri-or example, apartments A1 and c1 need 30 and 66 per cent more supplied energy respectively compared to apartment B1, with the normal occupancy B setting (see table 5). in Building 2, which has a lower thermal insulation standard of the building envelope, a comparison between the three apartments will result in a small percentage increase. however, it can be misleading to look at the percentage difference alone. Although there is a 106 per cent difference in need for supplied energy between apartments B1 and c1; in the case of occupancy c, the difference in absolute numbers is only 24.6 kWh/m2 or 1820 kWh (multiplied by 74 m2) for the whole heating season. the same comparison in Building 2 shows a 3175 kWh difference (+121 %).
Table 3.The supplied heat for building 1, from 1st of October to 31st of March.
si m on s ig ge lst en , B irg itt a n or dq ui st, s te fa n o la nd er op en h ou se in te rn at io na l v ol .3 9 n o. 2, Ju ne 2 01 4. A na ly sis o f t he A cc ur ac y of in di vi du al h ea t M et er in g an d c ha rg in g.
4.3 Local defects in the building envelope
the two local defects simulated in this study can both be seen as major defects. despite this, the consequences in extra need for supplied energy can be perceived as quite small. the largest differ-ence in need for supplied energy, 6.5 per cent, appears in apartment B1 where there is lack of insulation wool around some of the windows (see table 6). Building 1 has a building envelope of fair-ly high thermal standard and a defect will therefore be more significant in Building 1 compared to Building 2, which had has less thermal insulation from the beginning.
5 d iscussio n
5.1 internal heat production and solar radiation the large amount of solar radiation and internal heat production will lower the need for supplied energy, which in this case means that the tenant has to pay less for heating the apartment. this is con-sistent with one of the basic thoughts concerning iMc: if someone uses less heat they should also pay less. however, internal heat production in com-bination with compensation for an apartment’s less favorable location in a building can affect the accu-racy of iMc, which will be explained later.
When the indoor temperature is measured, internal heat production significant affects the accu-racy. some of the internal heat production comes from electrical energy for which the tenant normal-ly has to pay. At the same time, internal heat pro-duction lowers the need for supplied energy, which in this case will benefit the landlord or, in some
cases, the energy company. this works in both ways. for example, occupancy A produces less internal heat compared to occupancy B and c. for the same indoor temperature, occupancy A would actually require a higher heat supply than occu-pancy B or c. however, their costs will be the same and it is the landlord who has to stand the extra cost.
the difference in internal heat production between the two extreme occupancies in this study is, in total, 26.0 kWh/m2 or 1924 kWh (multiplied by 74 m2) over the heating season. how much this is in relation to the need for supplied energy differs between the apartments. for example in apartment B1, the supplied energy decreases by 39 per cent for occupancy c compared with occupancy B. in apartment c2, the supplied energy decreases by just 17 per cent for occupancy c compared with occupancy B. this means that the percentage dif-ferences depend on the apartment’s need for sup-plied energy, which in turn depends on the thermal standard of the building envelope together with the apartment’s location in the building.
Another potential shortcoming with internal heat production is that it can temporarily raise the indoor temperature. this could mean higher heat-ing costs, when in reality it should lower costs. if no temperature sensors are placed in rooms where the most internal heat is produced, as in the kitchen and the bathroom, this shortcoming can be mostly avoided. But not including the whole apartment can be perceived as incomplete measurements. solar radiation can also temporarily raise the indoor temperature. however, this study does not reveal much influence from the sun during the six colder months in sweden. it could be sensible to stop the measurements in the spring time well
Table 6.Increase of supplied energy because of a local defect in the building envelope.
en h ou se in te rn at io na l v ol .3 9 n o. 2, Ju ne 2 01 4. A na ly sis o f t he A cc ur ac y of in di vi du al h ea t M et er in g an d c ha rg in g. si m on s ig ge lst en , B irg itt a n or dq ui st, s te fa n o la nd er
before solar radiation begins to affect the indoor temperature too much.
5.2 An apartment’s location in the building the apartment’s location in a building significantly affects its need for supplied energy. Between apart-ments B2 and c2 supplied energy differs by as much as 85 per cent. An interesting observation is that the percentage difference decreases in line with a higher thermal insulation standard for the build-ing envelope. Between apartments B1 and c1 it differs by 66 per cent, a difference of 19 per cent compared to Building 2. in this study’s most extreme case, for occupancy c, the difference between apartment B and c in Building 1 is 1820 kWh for the whole heating season, and in Building 2 the difference is 3175 kWh. this means that the issue of different heating needs, because of the apartment's location in the building, is of less sig-nificance in modern well-insulated buildings. in denmark you have to compensate for an apart-ment’s less favorable location when using iMc (Bygge- og Boligstyrelsen, 1996). in sweden, this is mostly done when installing iMc in an existing building.
With a percentage discount, depending on the apartment’s location, the measured amount of energy is reduced. A larger area of exterior walls and roof will be compensated by a higher percent-age discount. the question is whether this truly rep-resents reality?
the amount of internal heat production from the occupancies is a factor that could influ-ence a percentage discount for an apartment’s less favorable location in a building. this can be shown from a comparison between the two extreme occu-pancies A and c. in apartment c1, which has a less favorable location, occupancy A needs 73.9 kWh/m2 in supplied energy. At the same time occupancy c needs just 47.9 kWh/m2 for the same apartment. the assumption that apartment c is compensated with a 10 per cent discount for the less favorable location in the building, this will result in a discount for occupancy A of 547 kWh (73.9 x 0.10 x 74 m2). for occupancy c the discount will only be 354 kWh, a difference of 193 kWh.
instead of a percentage discount there could be a fixed reduction based on a calculated increased amount of heat transmitted through exte-rior walls and ceilings. this would exclude all exter-nal influence on the discount such as the family size. Another option could be to not give any dis-count at all related to the apartment’s location, as in germany where the common standard is not to compensate for any unfavorable location. it is to be noted that germany has a very different view on
iMc compared to sweden due to various historical events (siggelsten and hansson, 2010). to com-pensate a gable apartment for its greater need for heat does not have to be a matter of course. it may well be the other way around.
L ocal de fe ct s on th e bu ild ing e nve lop e
A potential shortcoming with measuring the sup-plied energy is a local defect in the building enve-lope. But its significance to the need of supplied energy is much less than the apartment’s location in the building. the simulated defects in this study created a small increase in supplied energy, with a slightly higher percentage increase in the well-insu-lated Building 1 compared to Building 2 ( see table 6). in all three apartments in Building 1 the increased amount of supplied energy is 163 kWh (2.2 x 74) due to lack of insulation wool. the main issue is that the tenant has to pay for the increased amount of energy needed because of any local defect, which really should be paid by the landlord. in addition, the landlord loses an economic incen-tive to repair the local defect or, even worse, to inspect the building envelope for any defects.
A local defect in the building envelope will only have a small impact of the need for supplied energy and should not affect the indoor tempera-ture appreciably. however, the perceived (opera-tive) temperature can be affected by downdraughts from defective windows or by cold radiation from surfaces with a poor thermal insulation standard. the effect of having a large difference between the measured indoor temperature and operative tem-perature should not be underestimated, especially if heat is charged by the indoor temperature. 6 co nclu sions
it is important to emphasize that the results from this study may be different when other input data such as the climate and type of building are introduced. for example, the issue of different heating needs because of the apartment’s location in the building was less significant in the modern well-insulated building.
the implication of these shortcomings is that it is very difficult to measure the actual heat used for an individual apartment. this makes is also difficult to apportion heating costs among ten-ants in a way equivalent to the actual energy used for heating. the investigated iMc methods affects, and are affected by, family size, the proportion of heating costs between tenant and landlord, and also between tenants.
si m on s ig ge lst en , B irg itt a n or dq ui st, s te fa n o la nd er op en h ou se in te rn at io na l v ol .3 9 n o. 2, Ju ne 2 01 4. A na ly sis o f t he A cc ur ac y of in di vi du al h ea t M et er in g an d c ha rg in g.
A large family contributes a larger amount of internal heat production compared with a small family, which in turn reduces the need for supplied energy. this means a lower heating cost for the large family if measuring the supplied heat. if instead the heat is charged by the indoor tempera-ture, this results in a higher heating cost.
the location of an apartment in the build-ing has a large influence on the apartment’s heat-ing demand. in this case the choice of iMc method affects apportionment of the heating costs among the tenants. When measuring the supplied energy, a tenant living for example on a gable apartment will have higher heating costs compared to living in an apartment located in the middle of the building. if instead the heat is charged by the indoor temper-ature the location of the apartment should normal-ly not affect the heating costs. the exception of this is if the building envelope has a poor insulation standard which in turn will affect the operative tem-perature indoors.
individual heat metering and charging is needed to involve the tenants and make them con-scious of energy use and cost, with the possible result of reduced energy use in multi-apartment buildings. one way to reduce the significance of the shortcomings is to have a partly fixed and a partly variable cost for the heat. having the heating costs as, for example, 50 per cent fixed and 50 per cent variable should in theory decrease the signifi-cance of this shortcoming by 50 per cent. how it will affect tenants’ saving behavior is difficult to say, more research is needed in this matter. More research is also needed to develop a method for individual heat metering that is more accurate and less vulnerable to shortcomings.
references
Andersson, g. 2001, Kv Jankowitz – Individuell
värmemät-ning och inverkan av värmeövergång mellan lägenheter, Bengt
dahlgren AB, Arbetsnummer: 50-8351101. göteborg. (in swedish)
Berndtsson, l. 2003, Individuell värmemätning i Svenska
flerbostadshus – en lägesrapport, swedish energy Agency,
Project nr. P11835-2, eskilstuna. (in swedish)
BoverKet, 1999, Rekordåren – en epok i svenskt
bostads-byggande, the national Board of housing, Building and
Planning in sweden, isBn: 91-7147-568-0, Karlskrona. (in swedish)
BoverKet, 2006, Individuell mätning av värmeförbrukning i
flerbostadshus i Tyskland – författningar, tekniker och erfaren-heter, the national Board of housing, Building and Planning
in sweden, isBn: 91-7147-945-7, Karlskrona. (in swedish) BoverKet, 2009, Så mår våra hus - Redovisning av
reger-ingsuppdrag beträffande byggnaders tekniska utformning m.m,
the national Board of housing, Building and Planning in sweden, isBn: 978-91-86342-29-6, Karlskrona. (in swedish) Bygge- og Boligstyrelsen, 1996, Bekendtgørelse om
individuel måling af el, gas, vand og varme(* 1), Kapitel 2
individuel måling §9. (in danish)
directive 2002/91/ec of the european Parliament and of the council of 16 december 2002 on the energy performance of buildings. Official Journal of the European Communities, 4.1.2003.
energiMyndigheten, 2007, Hushåll och energibeteende, swedish energy Agency, issn 1403-1892, eskilstuna. (in swedish)
eriKsson, B. 1993, Energisparpotentialer i bostadsbeståndet,
Värmebalansmodell, eliB rapport nr 8. statens institut för
byggnadsforskning, gävle. (in swedish)
fAnger, P.o. 1997, Varme- og klimateknik Grundbog 2.
Udgave – Kapitel 1 Indeklima, danvak, lyngby. (in danish)
gAfsi, A., lefeBvre, g. 2003, Stolen heating or cooling
energy evaluation in collective buildings using model inversion techniques, energy and Buildings, elsevier 35:3, 293-303.
schou, P. 1982, Tillämpad experimentell beteendeanalys vid
energisparande, Pedagogiska institutionen, stockholm
university, stockholm. (in swedish)
scott, W.l. 1991, Energy conservation from individual heat
use monitoring in multifamily properties, AshrAe Winter
en h ou se in te rn at io na l v ol .3 9 n o. 2, Ju ne 2 01 4. A na ly sis o f t he A cc ur ac y of in di vi du al h ea t M et er in g an d c ha rg in g. si m on s ig ge lst en , B irg itt a n or dq ui st, s te fa n o la nd er
siggelsten, s., hAnsson, B. 2010, Incentives for
individ-ual metering and charging, Journal of facilities Management,
emerald, 8:4, 299-307.
siggelsten, s., olAnder, s. 2013, Individual metering and
charging of heat and hot water in Swedish housing coopera-tives, energy Policy, 61 (2013) 874-880.
strusoft® (2010). viP energy version 1.5.6. copyright © structural design software in europe AB.
WAng, s. 2011. Technical Development of Chinese Heat
Meters and market outlook, unpublished conference
presen-tation at The First China Heat Metering Technology &
Management International Symposium & Exhibition, Beijing.
Author(s): simon siggelsten
urban studies, Malmö university 205 06 Malmö, sweden
email: simon.siggelsten@mah.se Birgitta nordquist,
Building service, lund university P.o. Box 118, 221 00 lund, sweden. email: Birgitta.nordquist@hvac.lth.se stefan olander,
construction Management, lund university P.o. Box 118, 221 00 lund, sweden. email: stefan.olander@construction.lth.se