Creating Player Models for Linearity in Level Design
Patrik Flodin
Computer Science
Bachelor’s Thesis
15 ECTS
Spring 2018
Supervisor: Jose Font
Examiner: Steve Dahlskog
Creating Player Models for Linearity in Level Design
Patrik Flodin
Faculty of Technology and Society Malmo University
Malmo, Sweden Email: p.r.flodin@gmail.com
Abstract—This paper aims to answer how accurately we can predict player experience based on level linearity and player characteristics. Level linearity is defined and a method for measuring it is developed. A third-person Action game is de-veloped and the player experience, together with game session data, recorded. An Artificial Neural Network is trained using supervised learning and the results show that to accurately predict player experience with level linearity, more data is needed. However, a useful method for measuring level linearity is provided for future research.
Keywords— Player Modelling, Player Experience, Level Design, Level Linearity, Game Design, Supervised Learn-ing
1. Introduction
In modern day games, Artificial Intelligence(henceforth AI) has many uses. The three most commonly associated methods with AI in games are movement, decision making and strategy. Movement is the decision of the AI character of what path to take, decision making is deciding what to do next and strategy refers to large scale strategic decisions [1]. These can be thought of as game-playing AI area. There are however two more areas of game AI; content generation and Player Modelling (henceforth PM) [2]. Content generation is the creation of new game content using AI and PM is the detection and prediction of human player characteristics. The aim is to to find the mathematical function between players, the players interaction with the game, and the players response to this interaction [3]. By building models of player experience, we can design new content with these models as context.
It is possible to define level design as linear if it only allows for one-to-one transitions between world spaces, and non-linear if it allows for one-to-many transitions [4]. As such, by recording all the paths possible in a space with one-to-any transitions, we have the means of quantifying linearity. In a game, this would conveniently be all the possible paths the player can take from the start point to the end point of a level.
When attempting to build a model the goal is to find a function that, accurately, maps measurable attributes of level linearity and player interaction, to a particular player state.
Research in PM has been applied in platform games [5] [6] [7] [8] [9] [10] and PM that focuses on the exploration of levels of varying linearity seems to be an area where finding previous research is more difficult.
In this paper we aim to create a model of player experi-ence in a test-bed created specifically for this study. Game play data (statistical and controllable features) and player experience will then be gathered from play tests. Using the game play data as input values and player experience as output values, Supervised learning [11] will then applied. Finally, performance is evaluated. Specifically, we ask how accurately we can measure the experience of the player, knowing the linearity of the level and the input of the player, as well which game play data has the greatest impact on the performance of the prediction.
The model provided can be used by either game design-ers to evaluate player experience with linearity in existing level design, or to generate new levels with Procedural Content Generation (henceforth PCG), tailored to the player.
2. Related Research
In this section, key concepts and their related research, as they pertain to this study, are introduced. PM is defined, followed by Player Experience, Gameplay Characteristics and Controllable Features, as these three make up the cre-ation of the model. Lastly, previous works touching on these concepts are introduced.
2.1. Player Experience
It has been showed that by taking the experience of the user into account, user and software interaction can be improved [12]. Further, [12] mentions three different levels of Player Experience; the socio-psychological level (individual experience), the behavioral level and the psycho-logical level. The individual experience, i.e the above socio-psychiological level, is stated to be the main component of player experience [12], and as such will be the focus of this study.
2.2. Player Modelling
In [3], PM is defined as “creating computational models of a player’s behaviour, preferences, or skills... “. In
mod-elling players experience within a game, we use all phases of computational model construction. Signal processing, feature extraction and feature selection are input for the model. As output, experience annotation is used. Lastly, Machine Learning or AI techniques are used for mapping between the two. It is also important to distinguish between based and free approaches to PM. The model-based approach uses a theoretical framework that maps game context and player interaction to player experience. The model-free approach assumes that there is an unknown function between the two, yet to be discovered [3].
2.3. Game play Characteristics
Gameplay characteristics are defined as how the user plays the game [13]. This can include information on move-ment (where and how the player moves), combat (enemies killed, shots fired, deaths) or collection of items (which items, how many). The choice of features to cover should attempt to include as many areas of the gameplay as possi-ble. By logging data from each game session, we can say something about how the user interacted with the game and use this as input when we create our player model.
2.4. Controllable Features
Pedersen, Togelius and Yannakakis [13] defined con-trollable features as the parts of the game that were used for level generation. These are features that say something about the level that is being played rather than how it is being played. In [13] where the study is a platform game, the controllable features focus on the placing and dimensions of gaps between platforms. In this study that pertains to spatial exploration and linearity in level design, the measured linearity and size of the space (number of rooms) will be used as controllable features.
2.5. Previous Research
In [5], player experience was predicted in platform games using player characteristics and level design pa-rameters. They found that using preference learning, some emotions could be predicted with high accuracy. This was then expanded upon in [6] where new content was generated with player models as context.
An approach was made by Pedersen et al. [7] to model the effects of certain level design parameters in platform games, on player experience, using preference learning.
Active learning was used by Shaker et al. [8] to model player experience in platform games. It was discovered that only small portions of data of the original data set was enough to create models of high accuracy.
In [9] an approach was made to personalize levels in a platformer during the play sessions. Here player experience was measured implicitly to create player models. [10] used game event logs and convolutional neural network to model player experience. This approach showed high accuracy in predicting experience in two different platform games.
3. Motivation and Research Questions
3.1. Motivation
The focus of this study is creating PM for linearity in level design. Knowing if the player prefers an open level with exploration or a linear level that leads you directly from start to finish, or something in between, can be beneficial when creating content for a game [13]. In this study we will explore the possibility of creating models of player experience for levels of varying linearity, in our test-bed (section 5).
3.2. Research Questions
The goal of this research is to answer the following questions:
RQ1: How accurately can we predict player experience given the linearity of the level design and the game-play characteristics?
RQ2: What gameplay characteristics have the greatest in-fluence on the predicted player experience?
4. Methodology and Implementation
The methodology chosen is the design research method-ology defined in [14]. It contains the six activities described below.
1. Problem Identification and Motivation: Define the specific research problem and justify the value of a solution.
2. Define the Objectives for a Solution: Infer quanti-tative or qualiquanti-tative objectives of a solution from the problem definition and knowledge of what is possible and feasible.
3. Design and Development: Creation of the artifact. This includes determining the artifact’s desired func-tionality and its architecture and then creating the actual artifact.
4. Demonstration: Demonstrate the use of the artifact to solve one or more instances of the problem. This could involve its use in experimentation, simulation, case study, proof, or other appropriate activity. 5. Evaluation: Observe and measure how well the
arti-fact supports a solution to the problem. This activity involves comparing the objectives of a solution to actual observed results from use of the artifact in the demonstration.
6. Communication: Communicate the problem and its importance, the artifact, its utility and novelty, the rigor of its design, and its effectiveness.
In this study, the method will be implemented in the following way:
1. Problem Identification and Motivation: We need to be able to measure and fully control linearity of
levels and simultaneously gather all possible data from the gameplay session. The data and measured linearity is needed in the creation of the PM. 2. Define the Objectives for a Solution: The goal is to
create a game that will gather any data needed from play sessions and giving us precise control over level creation.
3. Using the Unity Game Engine [15] we will create a game for the PC platform. The game is described in detail in the Solution section (Section 5). 4. The goal is to predict player experience given data
from gameplay. We will use the artefact to gather data and collect player experience.
5. As we evaluate how well we can predict player experience, the artefacts impact will be taken into context and evaluated.
6. The results will be documented and discussed in context of the artefact.
4.1. Methodology discussion
The decision to develop a new game was made to allow for precise control for specifying and measuring level lin-earity in how it is defined by [4] (See Section 5.2 for details on level linearity). In addition, the collecting of player experience is made easy by integrating forms into the game. Since quantity of data is important in supervised learning, streamlining the process of collecting data is beneficial.
5. Solution
Play tests are conducted in a test-bed created for this study (subsection 1), where players play levels of varying linearity and size. The measured linearity and size (sub-section 2) in addition to the statistical input (sub(sub-section 3) from the play session is the input for our model. Each player is asked to compare the levels in pairs, measuring the experience with each level (subsection 4). Lastly, supervised learning is applied to map the function between the input and output (subsection 5).
5.1. The Test-Bed
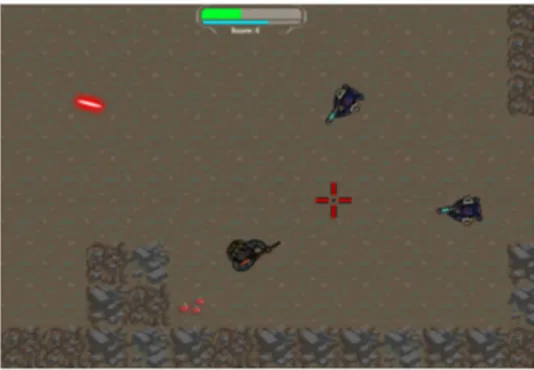
5.1.1. Overview. The game is a top down Action game [16] called Scrap. The goal of the game is for the player to find their way out of several dungeon levels. Simultaneously, players collect scrap electronics for a higher score. The levels are a series of connected rooms containing enemies and collectibles that benefit the player in different ways. To defeat enemies, the player has to aim and fire projectiles, while simultaneously evading the enemies and their projec-tiles. See Figure 1 for what the game looks like.
5.1.2. The Win Condition. The goal of each level is to reach the end of the level. This is done by entering an area titled “Exit” on the map. See Figure 2.
Figure 1. A view of the game featuring the player in lower middle and two enemy soldiers.
Figure 2. The exit the player will try to reach in each level.
5.1.3. The Loss Condition. The player loses if he or she runs out of life or if the time runs out. A player loses life if he or she is hit by enemy projectiles. The player has 180 seconds to finish a level. If the time runs out or the player runs out of life, the level restarts and the player loses 50 score points.
5.1.4. The Player. The player character is controlled with mouse and keyboard. The keyboard moves the player in the game world while the mouse controls a crosshair which the player is aiming towards at all times. See Figure 3 for the player and the crosshair. By pressing the left mouse button, the player shoots a shot in the direction of the crosshair. By pressing left shift, the player can also perform a dash, quickly travelling in the direction of movement.
Figure 3. The player and the crosshair used for aiming.
5.1.5. The HUD. On the top of the game screen, a green health bar, a blue bar showing the time left and the player’s score, is shown. See Figure 4 for how the HUD looks. 5.1.6. Enemies. There are three different enemies in the game. The first is a stationary turret, that fires with a wide spread attack in a cone-like shape, but is fragile and dies in one hit. The second is a moving soldier with an attack
Figure 4. The HUD.
similar to the player’s. It is more sturdy and dies in two hits. Lastly there is a boss enemy of which there is only one per level. It is moving, dies in five hits and has an attack like the turret’s.
5.1.7. Collectibles. There are three different collectibles. A graphics card that gives you a score boost, and fruits and bottles that regenerate your health.
5.1.8. Score. Killing an enemy gives you a score boost. Tur-rets give you 1 point, soldiers give you 2 points and killing a boss gives you 25 points. The graphic cards collectibles give you 5 points. After finishing a level, half of your time remaining, in seconds, is added to your score. If you die or your time runs out, 50 points is removed from your score.
5.2. Defining and Measuring Level Linearity
By viewing each room in our game as a node and assuming the definition by [4] that the world space can be viewed as non-linear if there exists one-to-many transitions, a measurement of Linearity (L) is proposed. By recording all the Simple Paths [17] the player can take from the entry node (level start) to the exit node (level end), we have a way of measuring linearity of the level. In this study we use a Depth First Search [18] to achieve this, due to its ability to find all the simple paths. We also record the number of rooms (N), as this is the effective size of the world space. Each level pair is manually made with the same rooms, placed and connected in a different order to make sure the content of the level stays the same; only the linearity changes. While the placement of enemies and pickups could have an effect on game play experience, each level pair has the same effect, positive or negative. Hence, when players are reporting their experience comparing the levels, the linearity will be the determining factor. Level 1 (Figure 5) is chosen because it represents a completely linear level, N = 7 L=1.
The first level is contrasted by Level 2 (Figure 6) with L = 2, N=7 where players have two ways of getting to the end.
In the second level pair, levels are now slightly larger and more complex. Level 3 (Figure 7) N = 9, L = 4 is chosen as a “traditional” level with the entry point and exit point placed on either sides of the map. Level 4 (Figure 8) N = 9, L = 5 has entry and exit point very close to each other, so it allows for exiting the level quickly.
In the last level pair, a comparison is made between a completely linear level (Figure 9) N=9, L=1 and a com-pletely open level where every room has an open path to the neighbouring rooms, (Figure 10) N=9, L=12.
Figure 5. The first level of the game.
Figure 6. The second level of the game and the first non-linear level.
Figure 7. The third level.
Figure 8. The fourth level.
Figure 9. The fifth level.
5.3. Game play Characteristics
The following statistics are logged during each session and chosen to cover a wide area of game play in the test bed.
Figure 10. The sixth level.
They are divided into five categories; Movement, Combat, Exploration, Collection and General.
• Movement
– Number of Dashes Performed – Time Spent Standing Still • Combat
– Number of Shots Fired
– Number of Shots Hitting Enemies – Number of Deaths
– Number of Times Hit by Enemies – Number of Enemies Killed • Exploration
– Time Spent in Level
– Time Spent in level after Finding Exit – Number of Rooms Visited
– Number of Rooms Visited More Than Once • Collection
– Number of Score Boosts Taken – Number of Health Boosts Taken • General
– Total Score
5.4. Player Experience
In accordance with a proposed experimental protocol [19] players are asked to play and rate levels pair wise. After every two levels completed, players are asked to fill out a 4-alternative forced choice protocol. The affect states players are asked to report are fun, challenge, boredom, frustration and excitement. These are identified by [20] as relevant states when modelling emotion during game play. The following questions are answered after each level pair:
• Level X was more fun than level Y • Level X was more challenging than level Y • Level X was more boring than level Y • Level X was more frustrating than level Y • Level X was more exciting than level Y
Note that this means that all recorded affect states are subjective. No objective physiological affect states are mea-sured; affect states are reported by the player.
5.5. Supervised Learning
After conducting play tests, we will have data sets of level linearity and game play characteristics and the cor-responding reported player experience. In [2] it is stated that supervised learning is perfectly suited for this form of input and output. Using the collected data, we can train an Artificial Neural Network (ANN) [2], which in turn can predict player experience from new input data, as described under Player Modelling in the Related Research section. ’
6. Experimental Setup
6.1. Data Gathering
When a play session is finished, the game generates a text file containing all the game play characteristics and reported player experience. All data values are floating point numbers.
6.2. Distribution
Once the test-bed is finished, the game will be distributed on various internet forums in a compressed file format, accompanied by instructions. An email address is set up where players can submit the generated file containing the data from their session.
6.3. Parser
A parser for all the collected text files will be created. It will generate input and output training sets for the ANN. It has the possibility of extracting all or individually selected data from the collected files. The user is shown a list of data available to select (Figure 11) and can from there enter a set of numbers corresponding to the data which is of interest.
Figure 11. The Parser.
6.4. Artificial Neural Network
An open source ANN will be used and trained with the data generated by the parser. When evaluating using the whole data set, a single hidden layer will be used
and the number of neurons in this layer will be chosen through testing for the best performance. When attempting to evaluate the characteristic with the greatest influence of predicted player experience, no hidden layer will be used. The interface of the ANN is shown in Figure 12.
Figure 12. The ANN interface.
6.5. Evaluation
First a set of play sessions will be evaluated using all available inputs in the training set for the ANN. Evaluation is made by seeing how closely the predicted experience matches the reported experience by the players. This is made by measuring the difference in predicted experiences and reported experiences. It is calculated via (1):
∆E = P E − RE (1)
Where P E is the predicted experience, RE the re-ported experience, and∆E the difference between the two. Since we strive for a minimal difference between predicted and reported experience,∆E values close to 0 are optimal. Following this, evaluations of the ANN will be made while removing inputs, in an attempt to find individual game play characteristics that have great influence over the predicted player experience.
7. Results
A total of 38 files were submitted from the play tests and used as training data for the ANN. After this, another eight play tests were used for evaluating performance.
7.1. Predicting Player Experience
In the first test, the ANN was trained with all game play characteristics as input, together with level linearity and number of rooms. The ANN predicted frustration well. On average, the∆Efor frustration was at a -0.13. However, for other reported experiences, the performance of the ANN was poor. Challenge, Boring, Fun and Excitement were off by -0.3, -0.42, -0.54 and 0.56 respectively. See Figure 13.
Figure 13.∆Efor the ANN.
7.2. Isolating Game play Characteristics
Removing different inputs to the ANN had little impact on performance. Results shifted wildly. Figure 14 shows the performance of the ANN when removing the time it takes to complete levels. Figure 15 shows the performance of the ANN when removing number of enemies killed. These two graphs are representative of the ANNs predictions overall when removing one game play characteristic.
Figure 14.∆Ewhen removing time to complete the game.
Figure 15.∆Ewhen removing enemies killed.
Due to the low quantity of data, another approach made was to train the neural network with the linearity of the levels and one game play characteristic. This due to that the less complex the problem is, the less data is needed for good performance in supervised learning [21].
Each player characteristic was used together with level linearity to train the ANN and then performance was evalu-ated. Two characteristics used for training performed better
than the rest. When training using the Player Score, ∆E
absolute value was within 0.3 for Fun, Challenge and Ex-citement. Performance for Boring and Frustration was still poor. See Figure 16.
Figure 16.∆Ewhen using Level Linearity and Player Score a inputs.
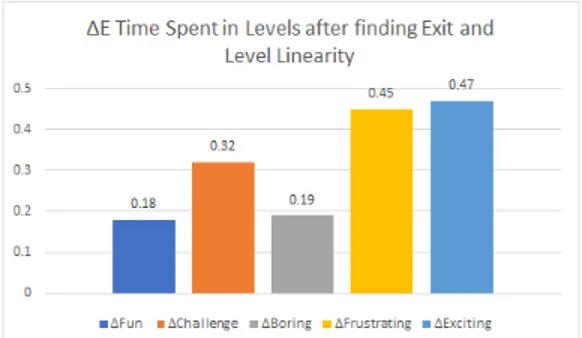
When training using the time players spent in levels after finding the exit, Fun, Challenge and Boring had a low∆E, while Frustration and Excitement performance was poor. See Figure 17 for details.
Figure 17.∆Ewhen using Level Linearity and Time Spent in Levels after finding exit as inputs.
8. Discussion
When evaluating the ANN, its performance was poor. The most likely explanation for this is the low quantity data available for training and evaluation. Studies [21] have shown that for good performance in supervised learning, sample sizes in the ranges of 80-560 are needed. This study managed only half of this. In addition there is no statistical certainty of the results, as a sample size of eight is not enough to draw any conclusions [22]. As such, there is no confidence in the evaluated performance of the ANN.
It is clear from this case that distribution methods are important when attempting to gather any significant amount of data. When setting up the method of gathering data, the expectation was that users would find it convenient when the game and the questionnaire were integrated into one, and then only having to submit a data file. However, participation was low and most users found it very cumbersome to download a file, despite the relatively small file size of 21 MB. Submitting the data file to an email address also proved
to be something that meant decreased participation, with users reporting an unwillingness to go through with this step. The only conclusion is that the artifact failed in its objective of collecting data. Ease of access for users in both playing the game and submitting data would have needed improvement to receive enough data in the time frame of this study. The most logical implementation here would be a browser game where the data is automatically uploaded to a database, without the need for users to manually do this. Naturally, increasing the time period of data gathering would also help.
While establishing that with such a small data set it was unable to accurately predict player experience or gameplay characteristics, the paper also contributes with an effective method for measuring level linearity.
9. Conclusion
This study confirmed that to be able to both train an ANN and evaluate it, the size of the data set is of impor-tance. Without enough data, the performance of the ANN is poor and there is no statistical reliability of its results. As such, great care has to be put into the artifacts ease of access for users and preferably that the data generated is au-tomatically gathered. To be able to draw any conclusions on predicting player experience with linearity in level design, further research will have to be conducted.
One of the problems identified was measuring level lin-earity. This paper proposed a method capable of quantifying linearity in level design, which may be of use in future research where measuring level linearity is of importance.
Acknowledgments
A thank you to all those who participated in the play tests of Scrap. Thank you to Jose Font for supervising and providing valuable guidance. Lastly a thank you to, in no particular order, Nicolina, Martin, Andreas, Jesper, Kristoffer, Sebastian and Nael for input and support.
References
[1] Millington, I. and Funge, J. (2016). Artificial Intelligence for Games. London: CRC Press, pp.8-11.
[2] Yannakakis, G. and Togelius, J. (2018). Artificial intelligence and games. Springer, pp. 9, 59-65, 230-235.
[3] Shaker, N., Togelius, J. and Yannakakis, G. (2016). Procedural Con-tent Generation in Games: A Textbook and an Overview of Current Research. Springer, p.181, 183, 184.
[4] Fabricatore, C., Nussbaum, M. and Rosas, R. (2002). Playability in Action Videogames: A Qualitative Design Model. Human–Computer Interaction, 17(4), pp.311-368.
[5] Pedersen, C., Togelius, J. and Yannakakis, G. (2009). Modeling player experience in Super Mario Bros. 2009 IEEE Symposium on Compu-tational Intelligence and Games.
[6] Shaker, Noor Yannakakis, Georgios Togelius, Julian. (2010). Towards Automatic Personalized Content Generation for Platform Games. Pro-ceedings of the 6th AAAI Conference on Artificial Intelligence and Interactive Digital Entertainment, AIIDE 2010.
[7] Pedersen, C., Togelius, J., Yannakakis, G. N. (2009). Optimization of platform game levels for player experience. Fifth AAAI Conference on Artificial Intelligence and Interactive Digital Entertainment, California. 191-192.
[8] Noor Shaker, Mohamed Abou-Zliekha and Mohammad Shaker. Active Learning for Player Modeling. In Proceedings of the 9th International Conference on Foundations of Digital Games, 2015.
[9] Bakkes, S., & Whiteson, S. (2014). Towards Challenge Balancing for Personalised Game Spaces. In Proceedings of Workshops Colocated with the 9th International Conference on the Foundations of Digital Games Society for the Advancement of the Science of Digital Games [10] Liao, N., Guzdial, M., Riedl, M. (2017). Deep convolutional player modeling on log and level data, In Proceedings of the 12th International Conference on the Foundations of Digital Games
[11] Mohri, M., Rostamizadeh, A. and Talwalkar, A. (2012). Foundations of machine learning. Cambridge, MA: MIT Press, p.7.
[12] Dorner, R., G¨obel, S., Effelsberg, W. and Wiemeyer, J. (2016). Serious Games. 1st ed. [Place of publication not identified]: Springer International Publishing Switzerland.
[13] Pedersen, C., Togelius, J. and Yannakakis, G. (2010). Modeling Player Experience for Content Creation. IEEE Transactions on Computational Intelligence and AI in Games, 2(1), pp.54-67.
[14] Peffers, K., Tuunanen, T., Rothenberger, M.A. and Chatterjee, S., 2007. A design science research methodology for information systems research. Journal of management information systems, 24(3), pp.45-77. [15] Unity Technologies. Unity. https://unity3d.com/, 2005. [Online;
ac-cessed 27-March-2018].
[16] Apperley, T. (2006). Genre and game studies: Toward a critical approach to video game genres. Simulation & Gaming, 37(1), pp.6-23. [17] Chen, Y. (1994). Finding the k quickest simple paths in a network.
Information Processing Letters, 50(2), pp.89-92.
[18] Tarjan, R. (1972). Depth-First Search and Linear Graph Algorithms. SIAM Journal on Computing, 1(2), pp.146-160.
[19] Yannakakis, G. and Hallam, J. (2008). Entertainment modeling through physiology in physical play. International Journal of Human-Computer Studies, 66(10), pp.741-755.
[20] Mandryk, R. and Atkins, M. (2007). A fuzzy physiological approach for continuously modeling emotion during interaction with play tech-nologies. International Journal of Human-Computer Studies, 65(4), pp.329-347.
[21] Figueroa, R., Zeng-Treitler, Q., Kandula, S. and Ngo, L. (2012). Predicting sample size required for classification performance. BMC Medical Informatics and Decision Making, 12(1).
[22] Krejcie, R. and Morgan, D. (1970). Determining Sample Size for Re-search Activities. Educational and Psychological Measurement, 30(3), pp.607-610.