Mechanics of Materials 154 (2021) 103739
Available online 2 January 2021
0167-6636/© 2021 The Authors. Published by Elsevier Ltd. This is an open access article under the CC BY license (http://creativecommons.org/licenses/by/4.0/). Contents lists available atScienceDirect
Mechanics of Materials
journal homepage:www.elsevier.com/locate/mecmatFirst-principle investigation of doping effects on mechanical and
thermodynamic properties of Y
2
SiO
5
Amin Mirzai
a,∗, Aylin Ahadi
a, Solveig Melin
a, P.A.T. Olsson
a,baDepartment of Mechanical Engineering, Lund University, Box 118, SE-22100 Lund, Sweden bMaterials Science and Applied Mathematics, Malmö University, SE-20506 Malmö, Sweden
A R T I C L E
I N F O
Keywords:
Monoclinic
Density functional theory Rare-earth doping Elastic moduli Debye temperature Heat capacity
A B S T R A C T
We investigate the variation of elastic stiffness moduli and the thermodynamic properties of yttrium or-thosilicate (Y2SiO5, YSO) under various doping concentrations of Eu3+ions. The model is based on a low
temperature approximation (T<< 𝜃𝐷) , and the plane-wave density functional theory (DFT) is used to carry out the calculations. The results show that the Eu3+ions primarily occupy the Y
1site of the basic molecule for all
applied concentrations. The overall shear, bulk, and Young’s moduli exhibit a decreasing trend with increasing Eu3+ concentration. The overall anisotropy shows a very small increase with increasing concentration. The
Debye temperature as well as the Grünesien parameter for each concentration are predicted. Lastly, the predicted heat capacity at constant volume is calculated and compared to experimental values. Our study reveals that there is almost linear relationship between concentration and mechanical properties of YSO. The decrease of the Grünesien parameter with concentration increase might decrease the anharmonic effects in YSO, although this effect is small. In addition, the change in heat capacity with concentration rise is negligible.
1. Introduction
There has been substantial interest in the use of rare-earth (RE) ion-doped crystal materials as high-performance luminescent devices, light-emitting diodes, plasma panels, solid-state lasers, and use in laser frequency stabilization (Ricci et al., 2011; Thorpe et al., 2011). In order to improve the performance and efficiency of current devices and to develop new devices with higher brightness and resolution, researchers have been investigating numerous inorganic materials as a host for RE ions. A few candidates such as aluminum garnet (Y3Al5O12),
RE-orthovanadates (REVO4) and yttrium silicates (Y2SiO5) have been
examined in more detail due to their promising intrinsic properties. In particular, Y2SiO
5 (YSO) crystals have been found to have high
chemical and thermal stability that is desirable for cathode luminescent phosphors (Saha et al., 2005). They also have negligible magnetic moment, which has made them appealing for quantum information and laser stabilization applications (Thorpe et al.,2011). YSO doped with RE ions such as Ce3+and Eu3+is used in applications for blue phosphor, Cr-doped YSO is used as a saturable absorber, and Tb-doped YSO is an efficient candidate for UV light-emitting-diodes (Ricci et al.,2011).
Although YSO is doped with RE ions in nearly in all its applications, little is known about the effects of doping on the properties of YSO. A few experimental studies on doping effects have indicated the need for further studies in this regard. For instance,Saha et al.(2005) report that
∗ Corresponding author.
E-mail address: amin.mirzai@mek.lth.se(A. Mirzai).
doping not only has direct effects on the structural and the mechanical properties of YSO, but also affects the luminescent centers ofGhosh et al.(2006) noted that interband transitions depend on the phase of the crystal as well as the doping concentration percentage, which affects the emission intensity at the luminescent centers.
A few experimental and theoretical studies have been focused on the intrinsic properties of YSO crystals. For example,Ching et al.(2003) calculated the dielectric constants and band gap of YSO using the ab initio orthogonalized linear combination of atomic orbitals (OLCAO) method. The physical properties of YSO were later investigated exper-imentally for application as thermal barrier coatings (TBC) (Sun et al., 2009,2008). To examine the selection of YSO as TBC in more detail, Luo et al.(2014) calculated the elastic stiffness and thermal properties of YSO using plane-wave DFT.Mock et al.(2018) also used the plane-wave DFT method to investigate anisotropy and phonon modes of pure YSO crystals by analyzing the dielectric tensor.
However, at present there is a lack of knowledge in the effects of doping on the mechanical and thermodynamic properties of YSO crystals. This knowledge is important in laser materials such as YSO since the residual heat from laser may affects the refractive index. This in turn causes stress-induced birefringence (or, in the case of YSO, trire-fringence). Moreover, mechanical stress, for example from mounting the crystal, may also introduce photoelastic effects in the crystal, which
https://doi.org/10.1016/j.mechmat.2020.103739
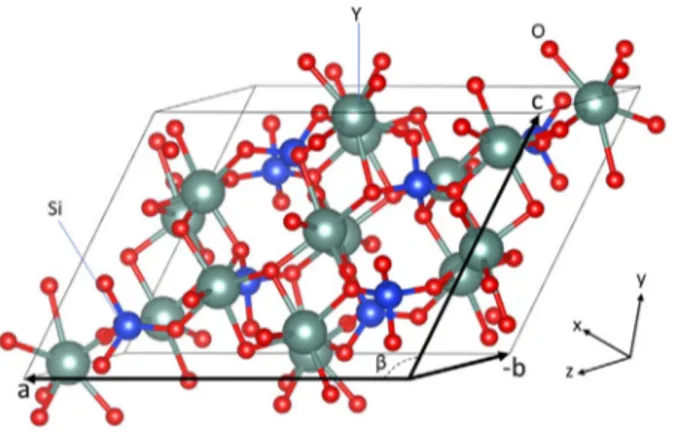
Fig. 1. Schematic of a YSO standard unit cell with 64 atoms and with (𝐵2∕𝑏, 15) crystal
structure. The constituents of basic molecules are Y, Si, and O, that are represented by gray, blue and red spheres, respectively. Lattice parameters are denoted as a, b, and c. (For interpretation of the references to colour in this figure legend, the reader is referred to the web version of this article.)
may slightly alter the polarization of the laser beam (Yoder, 2008). Therefore, it is important to have deeper knowledge about the physical properties of laser materials such as doped YSO so that the performance of practical laser systems can be improved. In this paper, we examine the effect of Eu3+doping on the mechanical and thermodynamic
prop-erties of YSO to provide more accurate information for its application in the field of laser stabilization and luminescence. The main reason for the selection of Eu3+, aside from its well-known coherence time (Thorpe
et al., 2011) is its high sensitivity to crystal symmetry and the bond length of the lattice sites (Ghosh et al.,2006;Saha et al.,2005). The values of thermodynamic properties such as the Debye temperature, heat capacity, and mechanical properties such as bulk modulus, and Young’s modulus as well as their directional components with respect to orientation might be beneficial in minimizing stress-induced trirefrin-gence. We will provide the mechanical and thermodynamic properties of Eu-doped YSO crystal over a doping concentration range from 0% to 25%.
2. Crystal structure of 𝐘𝟐𝐒𝐢𝐎𝟓
YSO is a polymorphic crystal, forming two distinct crystal struc-tures, denoted as X1 and X2. The X1 type is known as the low tem-perature phase since it forms at 1100◦C, whereas the X2 type, known
as the high temperature phase, forms at 1300◦C (Ghosh et al.,2006).
In each phase, two unique C1coordination sites for yttrium ions
ex-ist, which will be referred to as Y1and Y2, with coordination numbers
of seven and nine for X1-YSO, and seven and six in X2-YSO, respec-tively. Both of these phases form a monoclinic crystal system. Fig. 1 shows a schematic of a YSO standard unit cell with basic constituents Y, Si and O. The unit cell has 64 atoms in total, which corresponds to 8 basic molecules of yttrium silicate, Y2SiO5. In standardized monoclinic
crystals, only the b crystallographic axis is an axis of symmetry (Fig. 2). The relation between the Cartesian coordinate axes (x, y, z) and the crystallographic axes (a, b, c) of a monoclinic crystal is seen inFig. 2. There are 18 different groups of structures describing monoclinic systems in tables of crystallography (Mock et al.,2018). The specific group number of YSO is 15. The symmetry of a crystal structure is defined through space groups; X1 holds the space group 𝑃 21∕𝑏whereas X2 holds the 𝐵2∕𝑏 space group according to the international notation system (Sun et al.,2009;Luo et al.,2014).
The standard unit cell with the 𝐵2∕𝑏 space group has been chosen by many researchers along with several other alternatives in experimental as well as in theoretical studies. For example, Mock et al. (2018) used the 𝐼2∕𝑏 space group, while many researchers in the quantum information field (Wen et al., 2014) have focused on the standard
Fig. 2. Relation between the Cartesian coordinate axes (x, y, z) and the crystallographic
axes (a, b, c) of a standard monoclinic YSO crystal.
alternative, that is, the 𝐵2∕𝑏 space group. In this study we will use the space group 𝐵2∕𝑏 too, since it has been found to be a good host for luminescent ions, and has numerous applications within photonics and bio-photonics (Ghosh et al.,2006).
In a monoclinic crystal system, the conventional unit cell is defined by primitive vectors a, b, and c of arbitrary length, with one of the vectors perpendicular to the other two. In addition, 𝐵2∕𝑏 is base-centered, and its unique axis b has a 2-fold rotation symmetry; hence, it is denoted 𝐵2∕𝑏.
3. Theory & method
3.1. Elastic properties
Elastic constants are fundamental properties that determine the response of a crystal to an externally applied load. They provide information on the nature of the chemical bonding as well as mechan-ical and structural stability of the solid. They are not only directly related to the equations of state and the phonon spectra, but also to the thermodynamic properties of solids such as specific heat, thermal conductivity, the Grüneisen parameter, and the Debye temperature. Since in standardized monoclinic crystals the crystallographic axis, b, is an axis of binary symmetry, there are 13 independent elements in the elastic stiffness matrix 𝐶𝑖𝑗, given by Eq.(1)(Nye et al.,1985).
There are two main approaches to determine the elements 𝑐𝑖𝑗. In the first approach, the stiffness matrix is determined by applying six finite distortions of the lattice, from which the elastic constants can be derived using the stress–strain relation. In the second approach, a distortion matrix is applied to find the strain–energy curve in order to obtain the elastic constants through a second-order expansion of the total energy with respect to the lattice strain components. It should be noted that the strain tensor has specific components for each crystal symmetry. The distortion matrix 𝐴 for monoclinic systems is described bySöderlind(2002). The matrices 𝐴𝑖, 𝑖 = 1, 13, are given in Appendix.
𝐶𝑖𝑗= ⎛ ⎜ ⎜ ⎜ ⎜ ⎜ ⎜ ⎝ 𝑐11 𝑐12 𝑐13 0 𝑐15 0 ⋮ 𝑐22 𝑐23 0 𝑐25 0 ⋮ ⋱ 𝑐33 0 𝑐35 0 ⋮ ⋮ ⋱ 𝑐44 0 𝑐46 ⋮ ⋯ ⋯ ⋱ 𝑐55 0 ⋯ ⋯ ⋯ ⋯ ⋱ 𝑐66 ⎞ ⎟ ⎟ ⎟ ⎟ ⎟ ⎟ ⎠ (1)
Next, the elastic constants are checked to assess the stability of the doped crystals. This requires that the strain–energy must be positive for any homogeneous elastic deformation. The set of stability criteria for monoclinic structures are given in Eq.(2)(Nye et al.,1985) 𝑐11>0, 𝑐22>0, 𝑐33>0, 𝑐44>0, 𝑐55>0, 𝑐66>0, [𝑐11+ 𝑐22+ 𝑐33+ 2(𝑐12+ 𝑐13+ 𝑐23)] > 0, (𝑐33𝑐55− 𝑐235) > 0, (𝑐44𝑐66− 𝑐462) > 0, (𝑐22+ 𝑐33− 2𝑐23) > 0, [𝑐22(𝑐33𝑐55− 𝑐352) + 2𝑐23𝑐25𝑐35− 𝑐232𝑐55− 𝑐225𝑐33] > 0, 2[𝑐15𝑐25(𝑐33𝑐12− 𝑐13𝑐23) + 𝑐15𝑐35(𝑐22𝑐13− 𝑐12𝑐23)
+𝑐25𝑐35(𝑐11𝑐23− 𝑐12𝑐13)] − [𝑐215(𝑐22𝑐33− 𝑐232) +𝑐2 25(𝑐11𝑐33− 𝑐132) + 𝑐 2 35(𝑐11𝑐22− 𝑐212) + 𝑐55𝑑] > 0, 𝑑= 𝑐11𝑐22𝑐33− 𝑐11𝑐232 − 𝑐22𝑐132 − 𝑐33𝑐122 + 2𝑐12𝑐13𝑐23. (2)
The values of the elastic moduli of the crystal can also be defined from the elastic constants 𝑐𝑖𝑗, as suggested by Voigt et al. (Voigt et al.,1928),
where 𝐵𝑉 and 𝐺𝑉denote the bulk and the shear modulus, respectively. 𝐵𝑉 =1 9(𝑐11+ 𝑐22+ 𝑐33+ 2(𝑐12+ 𝑐13+ 𝑐23)) (3) 𝐺𝑉 = 1 15(𝑐11+ 𝑐22+ 𝑐33+ 3(𝑐44+ 𝑐55+ 𝑐66)) −1 15(𝑐12+ 𝑐13+ 𝑐23) (4)
Analogously,Reuß(1929) derived the bulk modulus 𝐵𝑅and the shear modulus 𝐺𝑅in terms of the elements of the compliance matrix 𝑆𝑖𝑗 as stated in following relations:
𝐵𝑅= 1 𝑠11+ 𝑠22+ 𝑠33+ 2(𝑠12+ 𝑠13+ 𝑠23) (5) 𝐺𝑅= 15 4(𝑠11+ 𝑠22+ 𝑠33) − 4(𝑠12+ 𝑠13+ 𝑠23) + 3(𝑠44+ 𝑠55+ 𝑠66) (6) where the compliance matrix is the inverse of the stiffness matrix:
𝑆𝑖𝑗= (𝐶−1)𝑖𝑗. (7)
Hill(1952) proved that the Voigt and the Reuss approaches are lower and upper bounds, respectively, of any crystalline structure. Therefore, it is common to use the arithmetic mean of the Voigt and the Reuss approximations to define 𝐵𝐻 and 𝐺𝐻, known as the Voigt–Reuss–Hill
(VRH) approximation or, simply, the Hill approximation. 𝐵= 𝐵𝐻=𝐵𝑉+ 𝐵𝑅
2 , (8)
𝐺= 𝐺𝐻=
𝐺𝑉+ 𝐺𝑅
2 . (9)
Finally Young’s modulus 𝐸 and the Poisson’s ratio 𝜈 are obtained using the following relationships (Hill,1952)
𝐸= 9𝐵𝐺
3𝐵 + 𝐺, (10)
𝜈= 3𝐵 − 2𝐺
2(3𝐵 + 𝐺). (11)
3.2. Thermodynamic properties
The Debye temperature 𝜃𝐷 is one of the fundamental parameters
used to link the physical properties of solids such as specific heat, elas-tic constants, melting temperature, heat capacity, and bond strength. It is also used to distinguish between high and low temperature regimes. At low temperatures (T << 𝜃𝐷), only the acoustic vibrations cause
transverse vibration excitation. Therefore, calculation of the Debye temperature from elastic constants is equivalent to the values obtained using specific heat measurements (Ravindran et al.,1998). The Debye temperature can be calculated from the elastic constants using the Anderson relation (Anderson,1963) given as
𝜃𝐷= ℎ 𝑘𝐵[ 3𝑛 4𝜋( 𝑁𝐴𝜌 𝑀 )] 1∕3𝜈 𝑚 (12)
where ℎ is Planck’s constant, 𝑘𝐵 is Boltzmann’s constant, 𝑛 is the number of atoms per formula unit, 𝑁𝐴 is Avogadro’s number, 𝜌 is the density of the unit cell, and 𝑀 is the molecular weight. The average sound velocity 𝜈𝑚can be obtained from the longitudinal wave
velocity 𝜈𝑙 and the transverse wave velocity 𝜈𝑡 through the following
relationships (Anderson,1963) 𝜈𝑚= [1 3( 2 𝜈3 𝑡 + 1 𝜈3 𝑙 )]−1∕3, (13) 𝜈𝑡= √ 𝐺 𝜌, (14) Table 1
Calculated bond length values of X2-YSO configuration.
Bond Length (Å) Bond Length (Å) Bond Length (Å) Y1-O1 2.239 Y2-O1 2.325 Si-O1 1.641 Y1-O2 2.589 Y2-O2 2.358 Si-O2 1.633 Y1-O3 2.334 Y2-O3 2.392 Si-O3 1.661 Y1-O4 2.379 Y2-O4 2.394 Si-O4 1.645 Y1-O5 2.367 Y2-O5 2.296 – – Y1-O6 2.337 Y2-O6 2.209 – – Y1-O7 2.329 – – – – 𝜈𝑙= √ √ √ √ 𝐵 +4𝐺3 𝜌 . (15)
At temperatures above 𝜃𝐷the thermal conductivity approaches a mini-mum value denoted as the minimini-mum thermal conductivity, 𝜅𝑚𝑖𝑛. The calculated values of the minimum thermal conductivity are derived from the following relation given byClarke(2003)
𝜅𝑚𝑖𝑛→0.87𝐾𝐵𝑁 2∕3 𝐴 𝑛1∕3𝐸1∕2 𝑀1∕3𝜌1∕6→ 𝑘𝐵𝜈𝑚( 𝑀 𝑛𝜌𝑁𝐴) (−2∕3). (16)
The Grüneisen parameter 𝛾 is a dimensionless parameter that links properties such as the expansion coefficient, bulk modulus, and spe-cific heat in solids. The normal thermal expansion of solids due to anharmonicity of interatomic forces is often based on the Grüneisen constant as well. Thus the Grüneisen parameter basically provides a quantitative link between thermal and mechanical properties. It is also used to describe the change in vibration properties with respect to volume variation.Belomestnykh and Tesleva(2004) derived a simpli-fied relation for the Grüneisen parameter using the Poisson ratio 𝜈 as follows:
𝛾= 3 2
1 + 𝜈
2 − 3𝜈. (17)
Although there are several methods such as phonon calculation with DFT, and machine learning analysis of interatomic potentials to obtain the heat capacity, in low temperature cases one can compute the heat capacity, 𝐶𝑣, using the Debye model as follows (Ashcroft et al.,1976),
𝐶𝑣= 3𝑛𝑘𝐵[4𝐷(
𝜃𝐷 𝑇 ) −
3(𝜃𝐷∕𝑇 )
𝑒𝑥𝑝(𝜃𝐷∕𝑇 ) − 1]. (18)
In Eq.(18), 𝑇 is the temperature and 𝐷(𝑥) is the Debye function given as 𝐷(𝑥) = 3 𝑥3∫ 𝑥 0 𝑡3 𝑒𝑡− 1𝑑𝑡. (19) 3.3. Computational details
A standard unit cell of YSO as depicted inFig. 1is chosen for the calculations. The initial atomic positions are taken from the Materials Project. The calculations are carried out by employing pseudopotential plane-wave DFT methodology as implemented in the Vienna Ab-initio Software Package (VASP) (Kresse and Furthmüller, 1996). The Eu: 4𝑓75𝑑06𝑠2, Y: 4𝑠24𝑝64𝑑15𝑠2, Si: 3𝑠23𝑝2, and O: 2𝑠22𝑝4 electrons are
treated as valence electrons, whereas the core electrons and electron– ion interactions are determined using the projected augmented wave (PAW) method (Blöchl,1994). The contribution due to exchange and correlation is expressed by the generalized gradient approximation (GGA) theory as described by Perdew–Burke–Ernzerhof (PBE) (Perdew et al.,1996).
The unit cell was optimized by setting the cut-off energy to 500 eV. The conjugate gradient algorithm is used to relax the system. The sampling of the Brillouin zone was done by implementing an automati-cally generated 𝛤 -centered Monkhorst–Pack grid. In order to minimize the total energy, a 4 × 8 × 6 mesh was adopted for all calculations. A convergence threshold of 1×10⁻⁸eVwas used to reach self-consistency.
Table 2
Volume and lattice parameters for YSO. *:This study.
Material Method Space group V (Å3) a (Å) b (Å) c (Å) 𝛽(◦) 𝑌2𝑆𝑖𝑂∗5 calc. 𝐵2∕𝑏 880.52 14.51 6.81 10.51 122.08 𝑌2𝑆𝑖𝑂5Ching et al.(2003) calc. 𝐵2∕𝑏 895.95 14.09 6.80 10.72 119.46
𝑌2𝑆𝑖𝑂5Luo et al.(2014) calc. 𝐵2∕𝑏 812.51 14.25 6.59 10.23 122.30
𝑌2𝑆𝑖𝑂5SpringerMaterials(2016) exper. 𝐵2∕𝑏 852.00 14.41 6.72 10.41 122.20 𝑌2𝑆𝑖𝑂5 O’Bryan et al.(1988) exper. 𝐵2∕𝑏 848.65 14.37 6.71 10.40 122.19
Table 3
Bond length values of site Y1 as a function of Eu3+ concentration: 6.25%, 12.5%,
18.75%, 25%. Bond Length (Å) Bond 6.25(%) 12.5(%) 18.75(%) 25(%) Eu1-O1 2.263 2.255 2.254 2.377 Eu1-O2 2.672 2.649 2.672 2.383 Eu1-O3 2.336 2.341 2.338 2.435 Eu1-O4 2.434 2.437 2.418 2.418 Eu1-O5 2.434 2.440 2.441 2.338 Eu1-O6 2.386 2.390 2.381 2.668 Eu1-O7 2.369 2.371 2.375 2.255 Aver. 2.414 2.412 2.411 2.411
method with Blöchl corrections. Further convergence criteria were set by restricting the maximum force per atom to below 0.0016 eV/Å and the maximum stress to below 0.034 GPa. Once the relaxed cell is obtained it is used for subsequent elastic constant calculations.
4. Results and discussion
4.1. Crystal structure of YSO
Table 1 shows the bond lengths between constituents of a pure YSO molecule in the X2-YSO configuration. The table shows that Y1
is surrounded by seven oxygen atoms whereas Y2is surrounded by six.
Table 2compares the volume, 𝑉 , the lattice parameters, a, b, c and 𝛽 of a pure YSO unit cell obtained in this study (marked by *), with the theoretical results ofLuo et al.(2014) andChing et al.(2003). The experimental values are also included in the table. As the table shows, the general agreement between the results is good, which confirms the reliability of the present study.
Fig. 3shows that the volume of the crystal increases with percentage doping due to the difference in atomic radii of Y and Eu, which are 2.27 Å and 2.56 Å, respectively.Fig. 3shows there is an almost linear relation between concentration percentage and volume. The same holds for the relative change in the lattice parameters.
It is important to note that the doping process occurs through a substitution in the host crystal, that is, Eu3+ ions replace Y3+ ions.
The substitution of Y3+ is done randomly, that is, any of 16 existing
Y3+in the unit cell can be replaced. The ionic relaxation of the doped structures shown inTable 3shows that substitution occurs primarily at the site of Y1, which agrees with the result obtained byWen et al. (2014). This means that even if Eu3+ is substituted into a Y
2 site,
optimization of the cell rearranges the relaxed cell so that Eu3+ends
up at the Y1 site. This could be due to the larger polyhedron volume
surrounding the Y1 site compared to the Y2 site. The Y1 site also
corresponds to the site where a higher emission can be observed as the concentration of Eu3+increases (Ghosh et al.,2006). It should be noted
that the concentration is defined by the number of the existing Eu3+
ions in a standard unit cell with 16 Y3+ions. As a result, substituting
one, two, three, and four Eu3+ ions corresponds to 6.25%, 12.5%, 18.75%, and 25% concentration values, respectively.
Since the impurity ions occupy the Y1 site, it can be inferred that
the main luminescent activity is associated with the Y1 site.Table 3
compares the average bond lengths at different concentrations. The
Fig. 3. Relative volume, 𝑉 ∕𝑉0, and lattice parameters, 𝑎∕𝑎0, 𝑏∕𝑏0and 𝑐∕𝑐0, with doping
concentration.
Fig. 4. Bond length variation for doping sites Y1 and Y2 as functions of doping
concentration..
table shows that an increase in concentration is associated with a gentle decrease in average bond length at the Y1 site.
Fig. 4 shows the average bond lengths surrounding the possible doping positions Y1 and Y2 for different doping concentrations. For the Y1 case, there is initially a considerable increase in the average
bond length compared to the pure crystal bond length. As the doping concentration further increases, a slight decrease in the average bond length is observed. At the site of Y2, after a slight jump to the first
data point, the curve reaches a plateau and then descends for the 25% concentration. This decrease could be caused by both the larger atomic radius of Eu compared to Y, and by the higher electronegativity of Eu
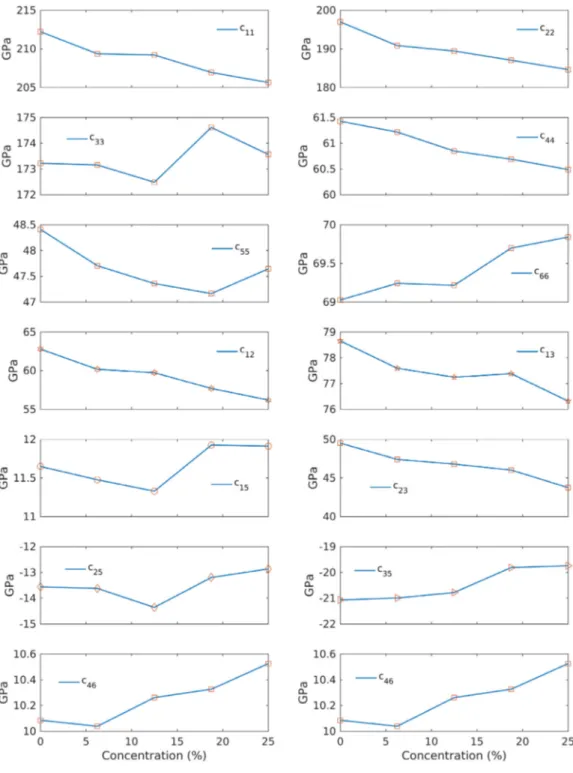
Fig. 5. Components of elastic stiffness matrix for different doping concentrations.
compared to Y which now, due to the higher concentration of Eu, can act more efficiently.
According to Wang et al.(2017), as the bond length of the lumi-nescent center ligand becomes shorter, the emission spectrum shifts to-wards longer wavelengths, and crystal field splitting becomes stronger due to the change in the local crystal field environment. Thus, consider-ingFig. 4, the rise in doping concentration should shift the wavelength of the Y1site towards red, with the exception of first section of the Y1
curve where the sudden jump should be interpreted as a shorter wave-length. In other words, a doped YSO always emits shorter wavelengths for the doping site Y1compared to the host crystal.Fig. 4also suggests
that at doping site Y2, doping increases the average bond length and
consequently shortens the wavelength. The value of the average bond length between 6.25% and 18.75% remains almost constant, with a
small drop at 12.5%. When the doping concentration exceeds 18.75%, the bond length drops dramatically and is less than that of the host crystal. This drop can be related to the higher electronegativity of the Eu3+ion. The reason this phenomenon only occurs at site Y2is probably
due to the lower number of ligands at this site.
4.2. Elastic properties
The elastic constants were calculated using both the stress–strain and the strain–energy relationships. First, a few diagonal elements of the stiffness matrix 𝐶𝑖𝑗, in Eq.(1)were calculated using Eqs. 𝐴1, 𝐴2,
𝐴3 & 𝐴4 given in Appendix. These values were compared to the
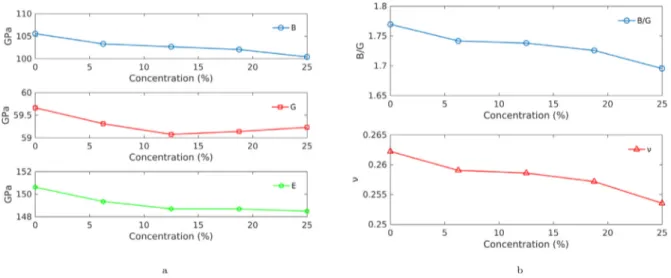
Fig. 6. Elastic moduli and Pugh ratio of the YSO crystal as a function of Eu3+doping concentrations.
Table 4
Elastic constants (GPa). *: This study.
Material Functional 𝑐11 𝑐22 𝑐33 𝑐44 𝑐55 𝑐66 𝑐12 𝑐13 𝑐15 𝑐23 𝑐25 𝑐35 𝑐46 𝑌2𝑆𝑖𝑂∗5 PBE 212.21 197 173.21 61.42 48.41 69.25 62.78 78.65 11.64 49.50 −13.56 −21.07 10.08
𝑌2𝑆𝑖𝑂5Luo et al.(2014) PBE 226 201 156 44 67 63 88 59 5 27 −0.3 −0.2 10
were small, all other elements of 𝐶𝑖𝑗 were calculated using the stress–
strain relation method, which is an automated scheme within the VASP code and requires less computation time than using the strain–energy relation.Table 4shows the resulting elastic constants with the values from this study marked with *. The theoretical results ofLuo et al. (2014) are also included inTable 4.
The stability of the results was checked using Eq.(2)in Section3.1. The stability criteria were met for all concentrations, implying that the 𝐵2∕𝑏structure remains mechanically stable up to at least 25%. Plots of elastic constants as a function of doping concentration are depicted in Fig. 5.
In Eq.(1), 𝑐11, 𝑐22, and 𝑐33represent the stiffness vs. principal strains while 𝑐44, 𝑐55, and 𝑐66correspond to resistance to shear deformations.
Overall, the largest changes occur in the diagonal components, whereas the off-diagonal terms show small changes. To clarify, the largest change occurs at 𝑐22, where the value drops from 197 GPa to 184 GPa. The smallest change takes place at 𝑐46, where the value increases from
10.09 GPa to 10.53 GPa.
The elastic moduli were calculated using the expressions in Sec-tion 3.1. A summary of all elastic moduli for the pure crystal is presented inTable 5, together with previous results for comparison and validation. The variations in 𝐵, 𝐺, 𝐸, and 𝜈 with doping concentration are presented inFig. 6. All elastic moduli show a decreasing trend with increasing doping concentration, where the relative decrease is less in 𝐵and 𝐸 compared to 𝐺 and 𝜈.
The Pugh ratio is included inFig. 6to further investigate the phys-ical properties of the material. The Pugh ratio gauges the ductility of materials based on the simple ratio given as 𝐵∕𝐺. The higher the value of this ratio, the higher the ductility of the material, and vice versa. AsFig. 6demonstrates, the ratio gradually decreases with increasing concentration. The overall drop of the Pugh ratio between pure and 25% doped crystal is 4.2%. Although this drop is small, it shows that there is a decreasing trend in the Pugh ratio which indicates the YSO becomes more brittle with higher impurity concentration.
4.3. Elastic anisotropy
The knowledge of the anisotropic properties of YSO might help to reduce the effects of induced birefrengence by identifying the elastic
Table 5
Calculated elastic moduli for the pure YSO. *: This study.
Type 𝐵(GPa) 𝐺(GPa) 𝐸(GPa) 𝜈 𝑌2𝑆𝑖𝑂∗
5 105.56 59.66 150.61 0.262
𝑌2𝑆𝑖𝑂5Sun et al.(2008) 108 47 124 0.31
𝑌2𝑆𝑖𝑂5Luo et al.(2014) 100 60 150 0.25
moduli in the chosen orientation in applications that are sensitive to thermo-mechanical noise. One such application is laser stabiliza-tion (Thorpe et al.,2011), for which YSO is considered a promising host crystal. However, due to its low symmetry and the misalignment of its crystallographic axes with Cartesian coordinate axes, the crystal suffers from high anisotropy.
Therefore we have determined the anisotropy of this crystal with re-spect to doping concentration. The anisotropy of the moduli are gauged using anisotropy indices defined byChung and Buessem(1967) where, for polycrystalline materials, the bulk modulus anisotropy factor, 𝐴𝐵,
and the shear anisotropy factor, 𝐴𝐺, are defined as 𝐴𝐵=𝐵𝑉− 𝐵𝑅 𝐵𝑉+ 𝐵𝑅 , (20) 𝐴𝐺= 𝐺𝑉 − 𝐺𝑅 𝐺𝑉 + 𝐺𝑅 (21) where 𝑉 and 𝑅 refer to the Voigt and Reuss limiting bounds according to Eqs. (8)–(11). The anisotropy factors for both moduli are zero for elastic isotropy when 𝐵𝑉 = 𝐵𝑅 and 𝐺𝑉 = 𝐺𝑅, and +1 at the
largest possible anisotropy, when the upper bounds of 𝐵𝑅 and 𝐺𝑅
both approach zero.Fig. 7 shows 𝐴𝐵 and 𝐴𝐺 as functions of doping concentration. Although the change is minuscule for both 𝐴𝐵and 𝐴𝐺, there is a downward trend in both 𝐴𝐵and 𝐴𝐺that indicates that higher
concentrations will lead to lower anisotropy of the material.
Another tool that can assist in measuring the overall anisotropy of crystals is the universal anisotropy index 𝐴𝑈 defined byRanganathan
and Ostoja-Starzewski (2008). This index is ‘‘universal’’ since it is applicable to all crystal symmetries and defined as
𝐴𝑈 = 5 𝐺𝑉
𝐺𝑅+ 𝐵𝑉
Table 6
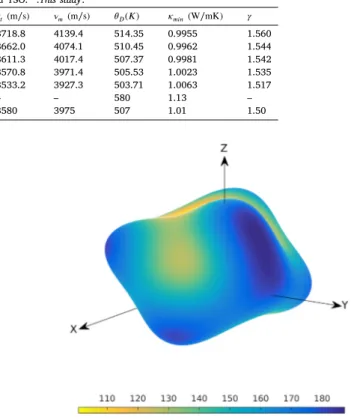
Thermodynamic values predicted for pure YSO and Eu-doped YSO. *:This study. Compound 𝜌(g∕cm3) 𝜈 𝑙(m∕s) 𝜈𝑡(m∕s) 𝜈𝑚(m∕s) 𝜃𝐷(𝐾) 𝜅𝑚𝑖𝑛(W∕mK) 𝛾 𝑌2𝑆𝑖𝑂∗5 4.3142 9583.8 3718.8 4139.4 514.35 0.9955 1.560 𝐸𝑢6.25%∶ 𝑌 2𝑆𝑖𝑂∗5 4.4228 9378.0 3662.0 4074.1 510.45 0.9962 1.544 𝐸𝑢12.5%∶ 𝑌 2𝑆𝑖𝑂∗5 4.5298 9240.2 3611.3 4017.4 507.37 0.9981 1.542 𝐸𝑢18.75%∶ 𝑌 2𝑆𝑖𝑂∗5 4.6381 9111.0 3570.8 3971.4 505.53 1.0023 1.535 𝐸𝑢25%∶ 𝑌 2𝑆𝑖𝑂∗5 4.7448 8951.8 3533.2 3927.3 503.71 1.0063 1.517 𝑌2𝑆𝑖𝑂5Sun et al.(2009) – – – – 580 1.13 – 𝑌2𝑆𝑖𝑂5Luo et al.(2014) 4.680 6196 3580 3975 507 1.01 1.50
Fig. 7. Elastic anisotropy indices of YSO versus doping concentration.
The value of anisotropy using the universal index 𝐴𝑈 starts at zero,
meaning isotropy, and increases towards +∞ as the anisotropy in-creases. The universal anisotropy index is also included in Fig. 7. As can be seen, the minimum value of 𝐴𝑈is obtained for pure YSO (𝐴𝑈 =
0.4138), and the maximum is obtained for 𝐸𝑢12.25%∶ 𝑌 𝑆𝑂. The largest
difference in 𝐴𝑈 is 𝛥𝐴𝑈= 0.0112. The overall trend also agrees with 𝐴 𝐵
and 𝐴𝐺. The same discrepancy at 𝐸𝑢12.25%∶ 𝑌 𝑆𝑂, where there is jump
in value of anisotropy, occurs in 𝐴𝑈. So in general, 𝐴𝑈 reveals that
increasing concentration of impurity increases the overall anisotropy of the crystal.
A convenient way to illustrate the elastic anisotropy is through a three-dimensional surface representation showing the variation of the Young’s modulus with crystallographic direction. The direction-dependence of the YSO Young’s modulus is determined as follows (Nye et al.,1985): 1 𝐸 = 𝑙 4 1𝑠11+ 2𝑙21𝑙 2 2𝑠12+ 2𝑙21𝑙 2 3𝑠13+ 2𝑙31𝑙 2 3𝑠15+ 𝑙42𝑠22 +2𝑙22𝑙2 3𝑠23+ 2𝑙1𝑙22𝑙3𝑠25+ 𝑙34𝑠33+ 2𝑙1𝑙33𝑠35+ 𝑙22𝑙 2 3𝑠44 +2𝑙1𝑙22𝑙3𝑠46+ 𝑙21𝑙 2 3𝑠55+ 𝑙21𝑙 2 2𝑠66 (23)
where 𝑙1, 𝑙2, and 𝑙3are the direction cosines in relation to the Cartesian
(x, y, z) system.Figs. 8–9(c)show the directional dependence of the Young’s modulus of pure YSO in Cartesian coordinates (x, y, z), where the 𝑧-axis coincides with the crystallographic direction b. As the shape of the 3D representation of Young’s modulus for an isotropic material would be a perfect sphere, the degree of deviation from a sphere indicates the degree of anisotropy in the system.
Figs. 9(a)–9(c)show 2D projections of the surface. In the 2D image, the deviation from a circular shape is an indicator of anisotropy. As Fig. 9(c) shows, the yz plane exhibits the highest level of deviation. The anisotropy can be explained by the low symmetry of the crys-tal, as well as misalignment between the crystallographic axes and the Cartesian coordinates. Nevertheless, the figures show that YSO is highly anisotropic and, consequently, the resulting Young’s modulus depends strongly on orientation. The directional dependence of Young’s
Fig. 8. 3D representation of Young’s modulus (GPa) in Cartesian coordinates..
modulus in corresponding orientations as a function of concentration is calculated and plotted in Fig. 10. The values along the Cartesian axes and their variations with doping concentration are denoted as 𝐸𝑖, 𝑖= 𝑥, 𝑦, 𝑧. As the figure shows, while both 𝐸𝑥and 𝐸𝑧almost remain the same, 𝐸𝑦decreases slightly with an increase in concentration.
4.4. Thermodynamic properties
Table 6 shows the Debye temperatures and velocities for each concentration based on Eqs.(12)–(15). There is a slight decrease in the Debye temperature as the concentration of dopants increases in the host material. All other properties listed in the table follow the same trend, which also follows the same descending trend as the elastic moduli shown inFig. 6.
The Debye temperature is a suitable parameter to compare the micro-hardness of materials because it increases with the hardness of the material. There is also a correlation between the Debye temperature and bond strength; the higher the Debye temperature, the stronger the bond. The table shows that the increase in doping concentration reduces the bond strength, which may be caused by an increase in interatomic bonding. This may stem from the larger atomic radius of Eu3+in comparison with Y3+.
The minimum thermal conductivities, 𝜅𝑚𝑖𝑛, and the Grüneisen
pa-rameters, 𝛾, were calculated for different concentrations and inserted inTable 6to further investigate the thermodynamic effects stemming from impurities. The thermal conductivity of a material describes the diffusivity of heat flow on the temperature gradient through phonon transport. In this context, it can be interpreted as an index to measure how well a material conducts heat. Thus, a higher value of 𝜅𝑚𝑖𝑛can be directly interpreted as a higher conductivity, and vice versa. In Table 6, YSO with 𝜅𝑚𝑖𝑛 = 0.995 is categorized as having very low
thermal conductivity.
The calculated values of 𝛾 with respect to different concentra-tions are listed in Table 6, which suggests a gradual decrease in 𝛾
Fig. 9. 2D projections of the Young’s modulus (GPa) surface in the xy (a), the xz (b),
and the yz (c) planes.
with increasing Eu3+ concentration. This means a higher degree of
impurity would cause less anharmonic phonon scattering in the YSO crystal (Ashcroft et al.,1976). As anharmonic scattering of phonons is the reason for finite thermal expansion, a lower degree of anharmonic scattering should decrease thermal expansion (Ashcroft et al.,1976).
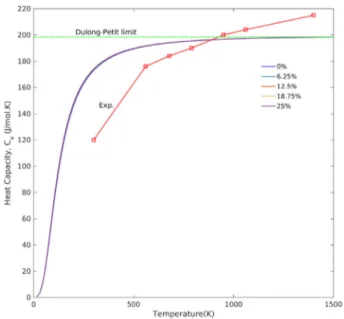
The predicted heat capacities in a constant volume based on the Debye model as described in Eq.(18) are presented in Fig. 11. The
Fig. 10. The components of the Young’s modulus 𝐸𝑖, 𝑖 = x, y, z.
Fig. 11. Heat capacity, 𝐶𝑣, based on Debye model for various Eu
3+concentrations.
The red line with squares indicates experimental data for the molar heat capacity, 𝐶𝑝,
of pure YSO obtained bySun et al.(2009). (For interpretation of the references to colour in this figure legend, the reader is referred to the web version of this article.)
figure shows that the change in heat capacity due to concentration is negligible. This interpretation is based on the fact that all 𝐶𝑣 curves
coincide, and no deviation between different concentrations is visible. In addition, the predicted curves approach the Dulong–Petit limit at high temperatures (T >> 𝜃𝐷). According to this law, the heat capacity at constant volume, 𝐶𝑣, for each atom approaches 3R for temperature
values above the Debye temperature (calculated 𝜃𝐷for YSO is 514.35
K). Here R is the gas constant (Kittel et al.,1976), whereas for temper-atures below 𝜃𝐷, quantum effects gain importance and 𝐶𝑣approaches zero.
To evaluate the predicted heat capacity, the experimental values of heat capacity, 𝐶𝑝, obtained bySun et al.(2009) are superimposed on the predicted curve. As can be seen, except at the two extremes (300 K and 1400 K), the predicted model agrees with the experimental
data points. If corrections to 𝐶𝑝and 𝐶𝑣were taken into consideration, the predicted curve would be in better agreement with experiment on the left-hand side. The correction values range between 1 and 8 K at room temperature and reach a maximum at melting point, where the correction value would be equal to 10% of 𝐶𝑣(Sun et al.,2009).
5. Conclusions
In this study the DFT plane-waves method is used to investigate the effect of doping on the mechanical and thermodynamic properties of the YSO crystal, which is a popular host for photonic and laser stabilization applications. The results show that the impurity ions prefer to occupy the Y1 site over the Y2 site of X2-Y2SiO5. The resulting
emission spectrum of this site would initially be shifted towards shorter wavelengths, and then towards longer wavelengths as the doping con-centration gradually increases. The overall trend of the mechanical properties decreases due to doping. Thus the bulk, Young’s, and shear moduli of the host drop with increasing doping concentration. The crystal becomes more brittle as a consequence of the decrease in the Pugh ratio. The overall anisotropy of the crystal increases with increasing concentration.
Lastly, the thermodynamic parameters reveal that increasing dop-ing concentration weakens the bond strength, and reduces the anhar-monic effects in the crystal, which may in turn decrease the thermal expansion.
Declaration of competing interest
The authors declare that they have no known competing finan-cial interests or personal relationships that could have appeared to influence the work reported in this paper.
Acknowledgments
This work is supported by the Knut and Alice Wallenberg Founda-tion, Sweden through grant no.: KAW-2016.0081. The simulations were performed using computational resources provided by the Swedish National Infrastructure for Computing (SNIC) at LUNARC, Lund Uni-versity, and at the National Supercomputer Centre (NSC), Linköping University.
Appendix
The matrix A for monoclinic systems is described by Söderlind (2002). The applied strain is denoted by 𝛿.
𝐴1= ⎛ ⎜ ⎜ ⎝ 1 + 𝛿 0 0 0 1 0 0 0 1 ⎞ ⎟ ⎟ ⎠ 𝐴2= ⎛ ⎜ ⎜ ⎝ 1 0 0 0 𝛿+ 1 0 0 0 1 ⎞ ⎟ ⎟ ⎠ 𝐴3= ⎛ ⎜ ⎜ ⎝ 1 0 0 0 1 0 0 0 1 + 𝛿 ⎞ ⎟ ⎟ ⎠ 𝐴4= 1 1 − 𝛿2 ⎛ ⎜ ⎜ ⎝ 1 0 0 0 1 𝛿 0 𝛿 1 ⎞ ⎟ ⎟ ⎠ 𝐴5= 1 1 − 𝛿2 ⎛ ⎜ ⎜ ⎝ 1 0 𝛿 0 1 0 𝛿 0 1 ⎞ ⎟ ⎟ ⎠ 𝐴6= 1 1 − 𝛿2 ⎛ ⎜ ⎜ ⎝ 1 𝛿 0 𝛿 1 0 0 0 1 ⎞ ⎟ ⎟ ⎠ 𝐴7= 1 1 − 𝛿2 ⎛ ⎜ ⎜ ⎝ 1 + 𝛿 0 0 0 1 − 𝛿 0 0 0 1 ⎞ ⎟ ⎟ ⎠ 𝐴8= 1 1 − 𝛿2 ⎛ ⎜ ⎜ ⎝ 1 + 𝛿 0 0 0 1 0 0 0 1 − 𝛿 ⎞ ⎟ ⎟ ⎠ 𝐴9= 1 1 − 𝛿2 ⎛ ⎜ ⎜ ⎝ 1 0 0 0 1 + 𝛿 0 0 0 1 − 𝛿 ⎞ ⎟ ⎟ ⎠ 𝐴10= 1 1 − 𝛿2 ⎛ ⎜ ⎜ ⎝ 1 + 𝛿 0 𝛿 0 1 − 𝛿 0 0 0 1 ⎞ ⎟ ⎟ ⎠ 𝐴11= 1 1 − 𝛿2 ⎛ ⎜ ⎜ ⎝ 1 + 𝛿 0 𝛿 0 1 0 0 0 1 − 𝛿 ⎞ ⎟ ⎟ ⎠ 𝐴12= ⎛ ⎜ ⎜ ⎝ 1 𝛿 0 0 1 𝛿 0 0 1 ⎞ ⎟ ⎟ ⎠ 𝐴13= 1 1 + 𝛿 ⎛ ⎜ ⎜ ⎝ 1 + 𝛿 0 𝛿 0 1 0 0 0 1 ⎞ ⎟ ⎟ ⎠ References
Anderson, O.L., 1963. A simplified method for calculating the Debye temperature from elastic constants. J. Phys. Chem. Solids 24 (7), 909–917.
Ashcroft, N., Mermin, N., et al., 1976. Solid State Physics. In: HRW International Editions, Holt, Rinehart and Winston.
Belomestnykh, V.N., Tesleva, E.P., 2004. Interrelation between anharmonicity and lateral strain in Quasi-isotropic polycrystalline solids. Tech. Phys. 49 (8). Blöchl, P.E., 1994. Projector augmented-wave method. Phys. Rev. B 50 (24), 17953. Ching, W., Ouyang, L., Xu, Y.-N., 2003. Electronic and optical properties of Y2SiO5and
Y2Si2O7with comparisons to 𝛼-SiO2and Y2O3. Phys. Rev. B 67 (24), 245108. Chung, D., Buessem, W., 1967. The elastic anisotropy of crystals. J. Appl. Phys. 38 (5),
2010–2012.
Clarke, D.R., 2003. Materials selection guidelines for low thermal conductivity thermal barrier coatings. Surface Coat. Technol. 163, 67–74.
Ghosh, P., Sadhu, S., Patra, A., 2006. Preparation and photoluminescence properties of Y2SiO5: Eu3+nanocrystals. Phys. Chem. Chem. Phys. 8 (28), 3342–3348. Hill, R., 1952. The elastic behaviour of a crystalline aggregate. Proc. Phys. Soc. Sect.
A 65 (5), 349.
Kittel, C., et al., 1976. Introduction to Solid State Physics, Vol. 8. Wiley New York. Kresse, G., Furthmüller, J., 1996. Efficiency of ab-initio total energy calculations for
metals and semiconductors using a plane-wave basis set. Comput. Mater. Sci. 6 (1), 15–50.
Luo, Y., Wang, J., Wang, J., Li, J., Hu, Z., 2014. Theoretical predictions on elastic stiffness and intrinsic thermal conductivities of yttrium silicates. J. Am. Ceram. Soc. 97 (3), 945–951.
Mock, A., Korlacki, R., Knight, S., Schubert, M., 2018. Anisotropy and phonon modes from analysis of the dielectric function tensor and the inverse dielectric function tensor of monoclinic yttrium orthosilicate. Phys. Rev. B 97 (16), 165203. Nye, J.F., et al., 1985. Physical Properties of Crystals: Their Representation by Tensors
and Matrices. Oxford University Press.
O’Bryan, H.M., Gallagher, P.K., Berkstresser, G., 1988. Thermal expansion of Y2SiO5 single crystals. J. Am. Ceram. Soc. 71 (1), C–42.
Perdew, J.P., Burke, K., Ernzerhof, M., 1996. Generalized gradient approximation made simple. Phys. Rev. Lett. 77 (18), 3865.
Ranganathan, S.I., Ostoja-Starzewski, M., 2008. Universal elastic anisotropy index. Phys. Rev. Lett. 101 (5), 055504.
Ravindran, P., Fast, L., Korzhavyi, P.A., Johansson, B., Wills, J., Eriksson, O., 1998. Density functional theory for calculation of elastic properties of orthorhombic crystals: Application to TiSi2. J. Appl. Phys. 84 (9), 4891–4904.
Reuß, A., 1929. Berechnung der fließgrenze von mischkristallen auf grund der plastiz-itätsbedingung für einkristalle. ZAMM-J. Appl. Math. Mech./Z. Angew. Math. Mech. 9 (1), 49–58.
Ricci, P., Carbonaro, C., Corpino, R., Cannas, C., Salis, M., 2011. Optical and structural characterization of terbium-doped Y2SiO5phosphor particles. J. Phys. Chem. C 115 (33), 16630–16636.
Saha, S., Chowdhury, P.S., Patra, A., 2005. Luminescence of Ce3+in Y
2SiO5 nanocrys-tals: Role of crystal structure and crystal size. J. Phys. Chem. B 109 (7), 2699–2702.
Söderlind, P., 2002. First-principles elastic and structural properties of uranium metal. Phys. Rev. B 66 (8), 085113.
SpringerMaterials, 2016. In: Villars, P., Cenzual, K. (Eds.), X2-Y2SiO5Crystal Structure: Datasheet from ‘‘Pauling file Multinaries Edition—2012’’. (sd_1210584), Springer, Berlin.
Sun, Z., Li, M., Zhou, Y., 2009. Thermal properties of single-phase Y2SiO5. J. Eur. Ceram. Soc. 29 (4), 551–557.
Sun, Z., Wang, J., Li, M., Zhou, Y., 2008. Mechanical properties and damage tolerance of Y2SiO5. J. Eur. Ceram. Soc. 28 (15), 2895–2901.
Thorpe, M.J., Rippe, L., Fortier, T.M., Kirchner, M.S., Rosenband, T., 2011. Frequency stabilization to 6 × 10-16 via spectral-hole burning. Nat. Photonics 5 (11), 688.
Voigt, W., et al., 1928. Lehrbuch der kristallphysik, Vol. 962. Teubner Leipzig. Wang, C., Wang, Z., Li, P., Cheng, J., Li, Z., Tian, M., Sun, Y., Yang, Z., 2017.
Relationships between luminescence properties and polyhedron distortion in Ca9-x-y-zMgxSryBazCe(PO4)7: Eu2+, Mn2+. J. Mater. Chem. C 5 (41), 10839–10846. Wen, J., Duan, C.-K., Ning, L., Huang, Y., Zhan, S., Zhang, J., Yin, M., 2014.
Spec-troscopic distinctions between two types of Ce3+ions in X2-Y
2SiO5: A theoretical investigation. J. Phys. Chem. A 118 (27), 4988–4994.