Department of Construction Sciences
Solid Mechanics
ISRN LUTFD2/TFHF-10/1041-SE(1-77)
On initiation of chemically assisted
crack growth and crack propagation paths
of branching cracks in polycarbonate
Licentiate Dissertation by
Ulf Hejman
Copyright c 2009 by Ulf Hejman Printed by Media-Tryck AB, Lund, Sweden ISBN: 978-91-633-6462-4 For information, adress: Div. Material science, Malm¨o University, SE-205 06 Malm¨o, Sweden Homepage: http://www2.mah.se/mumat
School of Technology Malm¨o University
Preface
The present work is a product of the part of my PhD studies conducted to the end of 2009 at the Division of Materials science at Malm¨o University. This work would not have been possible without the invaluable input and support concerning the experi-mental work as well as the academic upbringing. To that end, I would especially like to thank my supervisors Professor Per St˚ahle and Dr. Christina Bjerk´en for all their enthusiasm and inspiration. Also, appreciated consultation with Dr. Zoltan Blum de-serves a special attention here. During my time at Malm¨o University I have also had the great pleasure of associating with Ph. D. colleagues at the Faculty of Odontology and Health and Society who have made the time here very enjoyable and memorable. In addition, I would also like to mention all of the helpful and encouraging coworkers at the School of Technology who have helped directly or indirectly when I was in need of advice or support. Especially everyone in the B-corridor is very well appreciated, all mentioned and thought of. Finally, I would like to thank my parents for all en-couragement and support at all times, and my two grandmothers who, so generously, has invited me for dinner from time to time. Thank you all!
The financial support from the Knowledge Foundation for the profile “Biofilms - Research centre for Biointerfaces” and The Swedish Research Council Proj. No. 2007-5317 is acknowledged.
Malm¨o, Januari 2010 Ulf Hejman
Abstract
Stress corrosion, SC, in some cases gives rise to stress corrosion cracking, SCC, which differs from purely stress intensity driven cracks in many aspects. They initiate and grow under the influence of an aggressive environment in a stressed substrate. They grow at low load and may branch. The phenomenon of SCC is very complex, both the initiation phase and crack extension itself of SCC is seemingly associated with arbitrariness due to the many unknown factors controlling the process. Such factors could be concentration of species in the environment, stress, stress concentration, electrical conditions, mass transport, and so on.
In the present thesis, chemically assisted crack initiation and growth is studied with special focus on the initiation and branching of cracks. Polycarbonate plates are used as substrates subjected to an acetone environment. Experimental procedures for examining initiation and branching in polycarbonate are presented. An optical microscope is employed to study the substrate.
The attack at initiation is quantified from pits found on the surface, and pits that act as origin for cracks is identified and the distribution is analysed. A growth criterion for surface cracks is formulated from the observations, and it is used to numerically simulate crack growth. The cracks are seen to coalesce, and this phenomenon is studied in detail. Branching sites of cracks growing in the bulk of polycarbonate are inspected at the sample surface. It is found that the total width of the crack branches are approximately the same as the width of the original crack. Also, angles of the branches are studied. Further, for comparison the crack growth in the bulk is simulated using a moving boundary problem based algorithm and similar behaviour of crack branching is found.
List of papers
The following papers are included in the thesis: Paper A
U. Hejman, C. Bjerk´en
Environmentally assisted initiation and growth of multiple surface cracks. Submitted for publication.
Paper B
U. Hejman, C. Bjerk´en
Branching cracks in a layered material - Dissolution driven crack growth in polycar-bonate.
Contents
Preface i
Abstract iii
List of papers v
1 Introduction 1
2 Stress corrosion cracking 2
3 Experimental methods 5
4 Numerical simulation methods 7
4.1 Surface crack simulation . . . 7 4.2 Crack growth simulation of branching stress corrosion cracks . . . 8
5 Results and discussion 9
5.1 SCC initiation and growth . . . 9 5.2 Crack branching . . . 13
Summary of appended papers 16
1. Introduction
Over the past century and more, engineering skills have emerged in order to be able to make constructions as stable and efficient as possible in the sense of load bearing capabilities, manufacturing and material consumption. In recent years, the aid of computers has made the hunt for the optimal configuration even easier. However, still many failures do happen despite the rigorous computational effort. Constructions may fail despite that they are not fatally loaded, often when subjected to a certain environment. This phenomenon is called stress corrosion or SC and when this leads to crack growth, it is called stress corrosion cracking or SCC. This happens under the influence of an external load or from residual stresses and an aggressive specie to help assist crack growth by driving a chemical reaction, often anodic or cathodic, leading to dissolution. Usually, the reaction involved is an oxidation, as is the case for metals. Other materials, such as polymers like polycarbonate used in the experiments presented in this thesis, may experience SCC from other types of chemical reactions driven by the surrounding environment. An other cause for SCC is hydrogen cracking in some susceptible metals. Here hydrogen diffuses in the material making it brittle and susceptible to crack growth. All mechanisms are referred to with the common term SCC. All phenomena have the same characteristic feature as fatigue crack growth in that sense that a crack may propagate despite that the stress intensity factor is much lower than the fracture toughness if certain conditions are met. In the following, no distinction between the phenomena will be made; the term stress corrosion cracking, SCC, will be exclusively used irrespective of the underlying decay. In this thesis, the material under consideration is polycarbonate, that is a polymer. SCC is liable for costly failures due to its nature and the field has been an active research area for the last five decades and involves many disciplines such as fracture mechanics, material science, physics and chemistry. A brief introduction to stress corrosion is given in Section 2.
The present thesis presents both experimental work as well as numerical sim-ulations. The material chosen in the experimental work is commercially available polycarbonate, PC. This polymer is chosen because it allows for rapid results, com-pared to e.g. metals and an aim is to make it a model material for similar studies in other materials. When investigating SCC, it is vital to be able to perform many experiments in order to establish a statistical significance and SCC experiments in polycarbonate can be done within a few minutes, which allows for many experiments for better statistical foundation. The phenomenon is intrinsically non deterministic, a result derived from this investigation. Even if e.g. branching is known to take place, the crack path differs from one experiment to another, but it always shows the same characteristics. The variations may depend on factors such as impurities in the material or shape of the crack tip. The experimental activity has been performed in connection to both appended papers and is described in more detail in Section 3. The experiments are evaluated with numerical simulations or stress field distribution calculations. An introduction to the numerical schemes is given in Section 4.
The most important results are summarized and discussed in Section 5. Finally, the two papers appended in this thesis are outlined in Section 5.2.
Faster
Slower
Faster
σ
σ
1
2
3
Figure 1: Diffusion of species in the initiation phase of SCC may take place in the environment 1) and at the surface 2) and in the bulk of the substrate 3). The surface evolution is illustrated by a dashed line. If the surface is stretched, the stress here indicated with σ, influence the diffusion rates.
2. Stress corrosion cracking
The ability of a stress corrosion cracks to grow at low loads makes them dangerous. They are also small and hard to detect and distinguish from general corrosion on an attacked surface. Stress corrosion can take place if a loaded construction element is in contact with an environment containing aggressive species, cf. Davis [1]. A closely related phenomenon is chemically assisted crack growth. Here, the material needs not corrode, which may imply an electrical transition as is the case for e.g. metals. It may also be some other type of chemical reaction causing dissolution of the substrate making it possible for cracks to advance. This is usually the case for e.g. polymers such as polycarbonate used here. In this thesis, SCC refers to chemically assisted crack growth.
It takes some time to initiate stress corrosion after the contact with an aggressive specie is engaged. During this time, the surface is roughened by general corrosion, cf. Jones [2]. If it is also stressed, as in this case, the flat surface is also thermo dynamically unstable to perturbations and the surface roughness is dependent of the stress level, cf. Asaro and Tiller [3], Grinfeld [4]. The surface roughens and eventually the deepest pits will evolve and may turn into cracks due to stress concentrations at the bottom of the pit. This is illustrated in Fig. 1. The amount of time needed in the initiation phase is dependent not only on the concentration of the species in the environment but just as important is the diffusion of active species and waste products and chemical reaction rates between the substrate and the environment and the magnitude of the load. Geometry is not negligible if stress concentrations are created. If there is some groove or notch that can act as stress concentrator, a stress corrosion crack may initiate here in less time since no pit needs to be formed, cf. Yu [5].
There have been a number of linear and non linear solutions published describing the evolution of a surface. Possible evolution laws have been proposed by e.g. Yang and Srolovitz [6], Yu [5], Spencer and Meiron [7]. The surface evolution is seen to
1
2
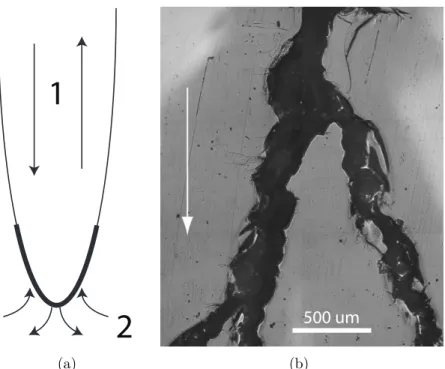
(a) (b)
Figure 2: (a) Schematic view of a stress corrosion crack. Diffusion of species 1) in the environment and 2) in the bulk. The bold line marks the active zone. (b) A real stress corrosion crack. In this case it has branched. The arrow shows the direction of crack growth. Also, the direction of load is indicated in both figures.
be stress dependent, Kim et al. [8] and Yu and Sou [9] presented an unambiguous solution making it possible to calculate the stress from the shape of an etched surface. The initiation of stress corrosion cracks is investigated in paper A.
The next stage, the crack propagation stage, where pits have grown deep enough to be cracks follows if the stress concentration is high enough. If a threshold or activation stress for SCC is exceeded, cracks propagate. There has been many models published on the crack growth mechanism. Some of which are summarised in Jones [2]. The activation energy needed for crack growth is not an intrinsic material parameter, it depends on the combination of material and environment and corresponds to a level of stress where chemical reactions commence leading to dissolution of materiel. Cracks grow when and where the dissolution of material occurs somewhere on a surface. This happens in regions with sufficiently high stress usually at the bottom of a deep enough pit. This is indicated in Fig. 2(a) with a bold line and the finite area in the vicinity of, what will be the crack tip, is the active region where dissolution occurs. Here, stress exceeds the activation energy for dissolution. The size of the active region is stress dependent due to the stress concentration. Higher levels of stress will lead to an increase in size of the active region around the crack tip. The crack will widen to adapt to the new load, the growth rate will be unaffected and constant. From this it can be understood why stress corrosion cracks are blunt, have a finite width and consequently has no singular stress field close to the crack tip. In practice, the cracks can be seen as a deep and narrow pits and the sides of the crack can be considered
as part of the body surface. Instead of using the stress, the strain may be more easily calculated so a strain threshold value for crack growth may be used instead. A commonly used model employed in computations of stress corrosion crack growth is the film breakage model described in Section 4.2 developed and used by e.g. Jivkov [10], Jivkov and St˚ahle [11], St˚ahle et al. [12].
Once again consider the schematic sketch of a deep pit depicted in Fig. 2(a). It is shown how the active species and waste products need time to diffuse to and from the crack tip in both the substrate and in the surrounding environment in order to maintain the chemical reactions that lead to material dissolution and crack advance-ment in the active region. Mass transport is evidently a delimiting factor and as the crack grows deeper, the distance to the surface increases and the diffusion rate will be an even more prominent controlling factor. Usually it is expected to find another chemical composition in the environment close to the crack tip where reactions are taking place than compared to the environment outside of the crack. This is the rea-son why a stress corrosion crack may not continue to grow if a specimen is cleaned and re immersed in the active solution, see e.g. Jones [2].
A stress corrosion crack may grow transgranularly or intergranularly depending on the material properties and the active species in the environment. The grain boundaries are often the preferred path for SCC. It is generally assumed that sharp cracks are prone to grow in a direction so that the stresses acting at the crack tip will open it in mode I, cf. Broberg [13]. The same assumption is made for stress corrosion cracks.
Stress corrosion cracks are often, but not always, seen to branch. For sharp cracks, this is frequently observed at dynamic crack growth but scarcely observed otherwise. In the case of SCC, it is facilitated by the influence of the environment and the dissolution process. The branching is thought to occur when the crack tip is blunted enough to mimic a free edge where two pits or depressions are formed. From the blunted tip, these two initially interacting depressions can grow into two separate cracks from the corroding surface, in this case the bottom of the original crack or pit. A typical stress corrosion crack with branching sites, studied in paper B, is shown in Fig. 2(b). Branching of sharp cracks have been considered and analytical calculations of the stress intensity factor, KI, have been laid forward. See e.g. P¨arletun
[14], Viteck [15], Zhang et al. [16], Suresh and Shih [17] for mode I and by Theocaris [18, 19], Theocaris et al. [20] for mixed mode loading. In paper B, it is investigated if these results are applicable also to SCC and their special growth mechanism. Also, the angle dividing two branches of a crack after branching are investigated experimentally and the result is compared with result found in the literature.
The third and last stage is a rapid mechanical failure due to overload of the re-maining load bearing material, cf. Jones [2]. The crack mechanisms operating in the different stages are reflected as clearly distinguishable crack surfaces in a fractograph. The corrosion active in the first two stages renders a rough surface, often covered with corrosion products. The final fracture may be brittle or ductile, with corresponding characteristic features. Even if it is easy to analyse a fracture surface after failure has happened, it is desirable to identify a growing crack before a collapse.
l=100 mm 3 mm
Specimen Rig
x l’
Figure 3: The loading arrangement for the SC initiation experiment.
3. Experimental methods
The experimental activity conducted within the scope of the present thesis involves the investigation of SC initiation and SCC with branching. These experiments differ in objective and experimental arrangements, but the same material and environment parameters have been used. To investigate crack initiation, specimens are machined from a 4 mm thick, extruded plate to a rectangular test piece with the length 100 mm and width 30 mm. To avoid unintentional crack initiation at the edges of the specimens, they are covered with a protective, elastic layer of an epoxy glue. The specimens are mounted in a three point bend rig, inert to the environment. The configuration, shown in Fig. 3, is submerged into an acetone solution diluted with 10% of water. The concentration is chosen to get an appropriate reaction rate so that it may be controlled and practically handled. The three point bending gives a linearly varying stress on the surface of the specimens. After an exposure of approximately five to ten seconds, the specimen is rinsed with distilled water to stop the attack. An optical microscope is used to analyse the surface for pits and cracks after exposure. Fig. 4(a) shows how a pattern of randomly distributed pits form on the surface. On a larger length scale some of the pits grow into cracks on the surface. These cracks grow and coalesce, as shown in Fig. 4(b), and a close up of the coalescence is shown in Fig. 4(c). Coalescence of cracks is studied in paper A, where initiation of SCC is considered.
The crack growth with branching is studied using slightly larger specimens. These are also cut out from an extruded plate of polycarbonate but with the thickness of 10 mm, a width of 100 mm and a height of 50 mm. A short and narrow notch is made at the middle of the long edge on each sample and two holes, one on each side of the notch are drilled to facilitate application of the load opening the notch in mode I. The side opposite to the notch, the plate is glues to an aluminum bar considered to be rigid compared to the polycarbonate. The setup is shown in Fig. 5(a). An undiluted, commercial grade of acetone is carefully suspended to the tip of the notch to start the chemically assisted crack growth. The acetone must be continuously supplied to the crack for growth and the load is applied by means of a spring system so that the load is approximately constant during one experiment. The crack and the branching sites are studied from the side of the plate with an optical microscope. Crack width and crack angles at the branching sites are measured from the images captured with a digital camera connected to the microscope and presented in paper B. A typical crack pattern is shown in Fig. 5(b) and a close up of a branching site is shown in Fig. 2(b).
(a)
(b) (c)
Figure 4: (a) Typical SCC initiation pattern of small pits. (b) Typical SCC initiation pattern of surface cracks. (c) Typical pattern of surface cracks coalescing. The arrows indicate the direction of crack growth from the center of the crack, marked with a white dot.
F F
(a) (b)
Figure 5: (a) The loading arrangements for the crack branching experiment. (b) Typical stress corrosion crack pattern. The arrow shows the direction of crack growth.
4. Numerical simulation methods 4.1. Surface crack simulation
On the surface of exposed specimens, cracks shown in Fig. 4(c) start to grow. In paper A, a simulation of this crack growth is performed. Observations from the experiments and SCC phenomenological arguments lead to a crack growth scheme. First, one point is determined for every crack as its site of initiation. Normally, multiple cracks emerge on the surface so that a pattern of initiation sites is initially established. Calculations are then based on the following plausible assumptions of crack growth
i) Crack growth occurs in both directions perpendicular to the load. ii) Crack growth rate is constant in both directions.
iii) Coalescence takes place when two meeting tips come into a certain range from each other and reach the same lateral position. This distance is dependent on the length of the cracks.
iv) After coalescence, the two cracks become one with double length and only two growing ends.
v) No new initiation points are created during the simulation.
A quadratic area with the side l0 are populated with initiation sites having an
identical distribution as found in an experiment. The surface studied is considered small enough to represent an area where the nominal stress is constant. The growth occurs so that all cracks are straight and parallel until coalescence takes place and
σ σ i) ii) iii) iv) v)
Figure 6: Schematic sketch of the assumed surface crack growth rules found in Section 4.1.
the crack growth rate is assumed to be constant and equal to v0. The total time of a
simulation is denoted t0, and is divided into constant time increments, ∆t. Here, ∆t
is chosen to equal t0/500. This corresponds to that the crack extension at a tip ∆l
equals l0/500 during one time step.
When the distance perpendicular to the crack growth direction between two meet-ing cracks is less than 1/10 of the length of the sum of the two cracks and the tip have reached the same lateral position, coalescence occur. The distance between the cracks is a parameter chosen to fit experimental data. If the conditions for coalescence is fulfilled, the two meeting cracks grow towards each other at an assumed angle of 45◦ by growing one length unit in the direction of the original crack and one in the
direction of the meeting crack until they encounter each other. No stress analysis is performed during this type of simulation. The growth direction is governed solely by geometrical considerations. The result of the simulations are used to verify the growth rules. The code is written in the commercially available software Matlab [21].
4.2. Crack growth simulation of branching stress corrosion cracks
The bluntness of a stress corrosion crack implies the absence of a stress singularity at the crack tip and that the concept of linear fracture mechanics may not be applicable. As a remedy, a number of other models describing SCC have been formulated. The model used in the simulation of stress corrosion crack growth is similar to the model for SCC described in Section 2. Here, the extrenal load is static, and no rupture of am oxide film is considered. Instead, surface strains are assumed to influence the chemical reactions of the corrosion. The crack grows by dissolution of material on the surface of a stretched body where a strain threshold value is reached. The amount of crack extension depends on the level of strain exceeding the threshold strain. This happens in the active region, see Fig. 2(b). With this method, the crack will have the ability to grow, choose direction and decide its width and branch autonomously without any need for any criterion for growth direction and branching. Finite element calculations is used to find the strain on the surface. To do this, the commercially available computer program Abaqus [22] is used. The mesh used to simulate the crack growth shown in Fig. 5 is shown in Fig. 7. This model is used in paper B
where branched cracks are considered and in the conference proceedings Hejman and Bjerk´en [23, 24].
(a) (b)
Figure 7: (a) Overview of the mesh used to simulate the stress corrosion crack growth from the experimental configuration shown in Fig. 5. (b) Close up of the mesh at the crack tips of a branched crack.
5. Results and discussion 5.1. SCC initiation and growth
In paper A, the surface during SCC initiation is studied. Two signs of attack are found, on different length scales. A large number of pits appear on the surface. They are depicted in Fig. 4(a) and are seen to form on the polycarbonate surface at contact with acetone. The pits form without a need for stress. The occurrence of pits is seen to increase with stress but only a weak stress dependence is found, as can be seen from Fig. 8(a). The distribution of the pits is analysed by means of a two dimensional Fourier transform. It is seen that they are randomly distributed, and sometimes even overlap. No regularity or preferred frequency can be found. It is believed that some of these pits grow into surface cracks, the other sign of attack.
The cracks appear on the surface, perpendicular to the applied load. They are seen to grow and coalesce when a minimum load is applied. Exceeding this load threshold, the occurrence of initiation sites grows approximately linear with stress so that more cracks are formed. This is shown in Fig. 8(b). The appearance of these cracks are shown in Fig. 9(a). From Section 4.2 it is assumed that stress corrosion cracks grow independent of the load, the cracks are assumed to grow at both ends, at constant rate. This means that a point of origin, an initiation point, for each crack can be defined at every cracks mid point. The distribution of the initiation sites are analysed in the same way as the pits. It is seen that they are random uniformly distributed, meaning that they have a random nature, but never come too close or too far from each other. This is not surprising, since stress relief can be assumed in the vicinity of a growing crack, arresting the smaller cracks when in the neighborhood of a larger.
0 0.2 0.4 0.6 0.8 1 0 0.2 0.4 0.6 0.8 1 σ/σ 0 N/N 0 N/N 0 − Experiments Linear fit (a) 0 0.2 0.4 0.6 0.8 1 0 0.2 0.4 0.6 0.8 1 σ/σ 0 N/N 0 N/N 0 − Experiments Linear fit (b)
Figure 8: Normalised occurrence of pits (a) and length of cracks (b) along a spec-imens surface. D and N are the number of pits and cracks respectively. The load varies linearly and is normalised for convenience.
The crack growth is simulated using an actual and typical pattern of initiation sites obtained from an experiment. Fig. 9(b) shows the original experimental distribution and the simulation from the initiation sites to a point where coalescence has taken place at some locations. This simulation is made in accordance with the growth rules i)-v) in Section 4. Some of the characteristics of the actual crack pattern can be found in the simulations by comparing Fig. 9(a) and Fig. 9(f). For example, in Fig. 9(f) it is seen that the distance between a crack tip and the location at its flank where the other crack meet increases with the distance where the two cracks started to interact. However, the tendency to line up and create stripes of cracks is not so pronounced, but can be imagined in some areas. Since two meeting crack ends must have reached the same lateral position before coalescence can take place, the tips will always miss each other creating a rhomboidal piece between the cracks when they finally approach each other. This feature is a simple approximation that corresponds to the hook like shape that is seen experimentally.
Hitherto, the studied area is considered to represent the same spot on a sample, and the evolution of crack pattern is followed with time. However, it may be possi-ble to regard the result of the simulation to reflect a single moment in time for areas experiencing different nominal stress. The density of initiation spots increases approx-imately linear with stress, as observed from the experiments. Consider the pattern in Fig. 9(d) to represent a part of the sample where stresses are large, and Fig. 9(b) smaller stresses. Since the patterns reflect the situation at one moment, the cracks that have not coalesced must be equally long for both areas. This means that the different figures represent different length scales, equivalent to different time steps. In accordance to the experimental findings, crack coalescence is more probable at larger
(a) (b)
(c) (d)
(e) (f)
Figure 9: (a) A typical SCC initiation pattern of surface cracks. The initiation points have been indicated. (b) The pattern of initiation sites. (c) A part of the initiation sites used in the simulation. (d)-(f) The numerical simulation of the crack growth.
Figure 10: Overview of a specimen covered with surface cracks. The number of cracks increase with load to the left in the figure.
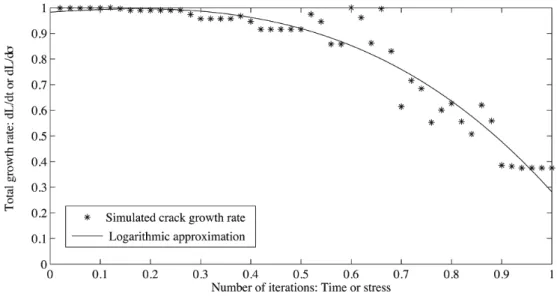
Figure 11: The total crack growth rate depends on the number of free crack ends and is seen to decreases when coalesces takes place.
stress levels simply due to more initiation sites. Thus, Fig. 11 also may represent the total crack length change, L, with nominal stress. While comparing with the results from the experiments, see Fig. 8(b), an expected decrease in L/σ0, is not observed.
Since no new initiation points are created during the simulation, as one of the assumptions, it is not surprising that the mean total crack growth rate is constant until crack coalescence takes place and as the more and more cracks coalesce, the slower the crack growth. The decrease is assumed to be logarithmic since the longer time that elapses, the number of free crack ends should decrease exponentially. An assumed logarithmic approximation to the decay is shown in Fig. 11. Crack coalescence, in this case, begins at approximately t = 0.1t0.
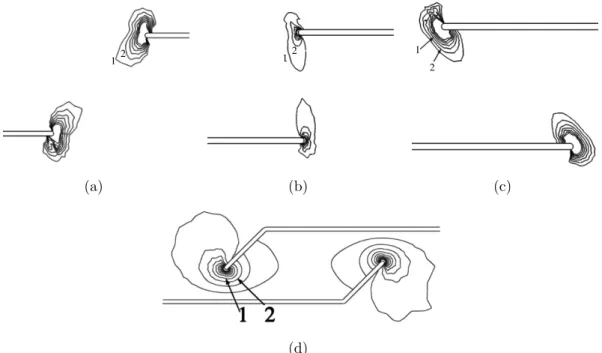
The stress field around two meeting cracks is further analysed using a finite element model with two meeting cracks in an infinite plate seen in Fig. 12. Abaqus [22] is used for the finite element analysis. The loading is also shown in the figure. The coalescence is divided in three steps, with different crack advances. The stress field distribution of the von Mises effective stress is plotted at the vicinity of the crack tips.
h
a
d
ξ
Figure 12: Overview of the finite element configuration used to analyse the crack path during coalescence. In the figure d << a << h. The dimensions have not been reproduced with correct aspect ratio for clarity.
The series are shown in Fig. 13. Assuming that the preferred crack path is mode I so that a crack grows symmetric in respect to the stress field, a propagating crack will be attracted by a meeting crack when they reach the same lateral position. From that position, the two tips will approach the other crack in some way, with a straight or bent crack path as seen in the experiment. This behaviour is also in line with an analytical investigation of co linear cracks by Melin [25]. To investigate the crack path more accurately, the cracks need to be more closely followed.
5.2. Crack branching
In paper B, the width of cracks at branching of stress corrosion cracks is investigated and is is seen that symmetry is not always preferred by the cracks. Results from experiment are compared with results from a numerical simulation, both described in Section 4. When a crack branches in two, it would be reasonable to assume the branching to be symmetric and that the two branches become equally wide. In the case of symmetric branching, it is plausible to assume that the the energy driving the crack before branching is equally divided between its two branches. In that case, the stress intensity factor should decrease a factor of 1/√2 for the branches. Even if the two branches do not split the energy equally, the sum should still be the same as before. The change in stress intensity factor affects the width of the cracks, since a smaller part of the crack tip will exceed the threshold for stress corrosion if the energy is less, corresponding to lower stress at the crack tip. Figure 14 shows that symmetric branching is not the common case and that it is not uncommon to have one crack larger than the other. A ratio up to 5 is seen in the figure. A reason for the might be a non symmetric and non trivial shape of the stress field ahead of the stress corrosion crack tip. The results are very scattered. From Fig. 14 it is also seen that the sum of the widths of the branches is slightly larger than the width of the original crack. The increase is seen to be 24± 37% for the experiment and 6 ± 24% for the simulations and is larger for small l1/l2 ratios. For symmetric branching, this
(a) (b) (c)
(d)
Figure 13: Von Mises effective stress field around two meeting cracks. The numbers refers to corresponding stress levels.
for the experiments and by 73± 9% for the numerical simulations. This corresponds well to results for sharp cracks where , e.g. Suresh [26], Theocaris [18, 19], Kitagawa et al. [27] calculated a drop in stress intensity factor by 70-90% depending on the crack configuration. It is seen that both branches continue to grow, is contrast to purely stress intensity driven cracks where only the wider crack can propagate under static or quasi static conditions.
The angles at branching sites are also studied to see what direction the crack turns when branching takes place. The angles are defined according to Fig. 15. The angle to the widest crack branch is denoted α, the angle dividing the two branches is denoted β. A mean crack path is defined by α + β/2 and this angle indicates in what direction the crack grows in average. A value of 180◦ indicates that the crack in
average would continue straight forward, and this is expected for a symmetric branch, see Fig. 15. Figure 16 depicts the results from the experiments and simulations from the measurements of the different branching angles and the result is linked to the ratio of the crack branch widths. From Fig. 16(a) it is seen that the α angle has a mean value with the standard deviation of 161◦± 13◦ for the experiments and slightly
larger for the simulations 168◦± 11◦. The corresponding mean values for the β angle
is 32◦± 12◦ and 46◦ ± 14◦. From both figures it is seen that the scatter is significant
and worse in the measurements of the β angle. The scatter makes it hard to see any trend in the dependance on crack widths. It is seen that for all ratios found, from 1 to 5, there is a possibility to get almost any angle in the interval from 140◦-185◦ for the α angle and between 10◦-70◦ for the β angle. The mean crack path is shown in Fig. 16(c) for the same interval of width ratios and it is seen that even if there is considerable scatter in the α and β angles, the sum α + β/2 is close to 180◦ in the
0 1 2 3 4 5 6 0 0.5 1 1.5 2 2.5 3 l 1 / l2 (l 2 + l 1 ) / L Experiment (1) Mean = 2.21 (2) Mean = 1.24 Simulation (3) Mean = 1.77 (4) Mean = 1.06 (3) (1) (2) (4)
Figure 14: The crack width ratio versus the normalised sum of the crack branch widths. L l2 l1 α β
whole interval. This means that even if the stress corrosion cracks studied here branch asymmetrically, there is still an over all tendency to continue forward in the original direction, the crack branches do not turn around, see Fig. 5(b) for an example.
The crack branching characteristics including the crack width and crack angles are reflected in the simulations. The width of the cracks are also seen to widen or be more narrow to adapt to new load conditions when the remote load changes. The propagation rate is seen to be constant. However, the exact location of a branch is, due to all factors affecting the branching, hard to determine in the simulations and an exact crack path is not possible to calculate.
The general perception of stress corrosion cracks is that they are ductile and always are associated with a plastic zone in front of them Jones [2]. From the observations made in this thesis, this is not necessarily true. The chemical activity at the crack tip may very well help extending the crack, as described above, without the need of stresses above the yield limit of the material. The threshold value for stress corrosion is not axiomatically connected to the plastic properties of the material but rather to the chemistry of the material and active species in the environment.
Summary of appended papers
In paper A, attention is given to the initiation stage and the distribution of crack initiation sites is investigated. An attempt to find a connection between all the sites of attack and which one of them that actually develops into a crack and thereby is an initiation site is made. It is found that the sites of attack are randomly distributed over the surface, but the initiation sites are uniformly randomly distributed. Also, the growth of surface cracks after initiation are studied. They are seen to propagate perpendicular to the load and they meet and coalesce forming a hook like shape. The stress field at the crack tips is analysed by a finite element method. The growth behavior is broken down into a few basic rules that are tested in a numerical simulation. A good agreement is achieved and from this investigation, it is likely that the cracks grow at constant rate, they coalesce when the tips come within a certain relative position of each other.
The characteristics of crack branching are treated in Paper B. As described in Section 2. Two characteristic features of a growing SC crack is found. It is blunt and in some cases are seen to branch. Branching is a feature seen normally only in dynamic crack growth. Here, a quasi static stress situation is assumed, but there is an influence of an aggressive environment at the crack tip. The shape of a blunt crack tip is seen to cause an unstable crack front, which may lead to branching of the crack, sometimes at multiple locations. The width of the crack is measured before and after branching. It is seen that the width of each branch narrows after branching but that the total width of the two branches are approximately the same or slightly larger that the width prior to branching. An increase in width indicates that energy at least is preserved during the branching process. In addition, the angle between the branches is studied and it is found that, as an average, the main crack propagation direction is unchanged by branching.
1200 130 140 150 160 170 180 190 200 210 220 1 2 3 4 5 6 7 α (deg.) l1 / l 2 Experiment (1) Mean = 161 Simulation (3) Mean = 168 (2) Pärletun = 166 (1) (2)(3)
(a) The ratio of the widest and the narrowest crack branch after branching versus the angle α defined in Fig. 15.
0 10 20 30 40 50 60 70 80 90 100 110 0 1 2 3 4 5 6 7 β (deg.) l1 / l 2 Experiment (2) Mean = 32° Simulation (3) Mean = 46° (1) Pärletun = 28° (1) (2) (3)
(b) The ratio of the widest and the narrowest crack branch after branching versus the angle β defined in Fig. 15.
0 1 2 3 4 5 6 0 50 100 150 200 250 l1 / l2 α + β /2 (deg.) Experimen (2) Mean = 177° Simulering (1) Mean = 192° Reference = 180° (1) (2)
(c) The crack path angle defined in Fig. 15 versus the ratio of the branch widths after branching.
Figure 16: Normalised results from the measurements of branching properties of a stress corrosion crack.
Paper A
U. Hejman and Christina Bjerk´en
Environmentally assisted initiation and growth of
multiple surface cracks
Submitted for publication.
Environmentally assisted initiation and growth of
multiple surface cracks
Ulf Hejman∗,a, Christina Bjerk´ena,b
aDiv. Mat. Sci., Malm¨o University, SE-205 06 Malm¨o, Sweden
bDiv. Mat. Engng, Lund University, SE-211 00 Lund, Sweden
Abstract
The initial stages of stress corrosion on an amorphous polymer is investigated. This is done by exposing stressed specimens of polycarbonate to an acetone and water solution. The surface develops two distinct features of degradation that appear on different length scales when subjected to tensile stress. Small pits form on the surface and make it rough. These pits are in the order of micrometers, and are found to be randomly distributed. They occur even without load and seem to slightly increase in number with increasing stress. In the millimeter domain, visible to the bare eye, surface cracks are formed transverse to the direction of loading. The occurrence of cracks is seen to have a positive stress threshold value, exceeding which, a linear increase of number of cracks with stress is found. The manners in which the cracks grow and coalesce on the surface are examined. It is seen that they do not meet crack tip to crack tip. Instead, they avoid each other initially and coalesce crack tip to crack side. The results are discussed in the light of mechanical considerations. A stress analysis for a few configurations of meeting cracks supports the experimental observations. With assumptions of stress corrosion crack growth and coalescence, a simulation of cracks growing from randomly distributed initiation sites is performed. Similar crack patterns as obtained in the experiments are found.
Key words: stress corrosion, crack initiation, multiple cracking, polycarbonate, three point bending
∗Corresponding author.
Email address: ulf.hejman@mah.se (Ulf Hejman)
1. Introduction
The phenomenon of stress corrosion, SC, has been studied intensively for the last five decades. When subjected to aggressive species in the surround-ing environment, stress corrosion cracksurround-ing, SCC, may occur in many kind of materials. The mechanisms differ for metals, ceramics and polymers, but all materials experience similar signs of attack and cracking. For a list of material and environment combinations, see e.g. Davis [1]. Stress corrosion of metals and associated crack growth due to oxidation is perhaps the most common SCC process where electrochemical processes cause the degrada-tion. A well accepted model to describe the process is by formation of an oxide film that may or may not be protective to the underlying substrate. Repeated breakage of the film makes the crack advance in metals. Often, hydrogen induced cracking is also considered as SCC. In polymers, stress in-duced degradation is caused by dissolution of material or weakening by bond breakage in the polymer structure. Usually, SCC is divided into three phases with characteristic crack growth mechanisms and crack growth velocities. The initiation phase, followed by a steady state crack growth stage where the crack growth rate is controlled by chemical kinetics and mass transport in the crack and at the crack tip. Crack growth from these mechanisms may occur at low loads, compared with the material’s fracture toughness. Finally, an accelerating crack growth, leading to final fracture occurs due to mechan-ical overload. Over the last fifty years research efforts have been conducted to increase the understanding of the underlying processes. The initiation phase is, however, not as well investigated. Also, it has proven hard to build a theory describing the transition between the different stages. For a general review of the SCC phenomenon, see e.g. Jones [2, Ch. 1].
One of the first attempts to describe the evolution of a stressed surface was made by Asaro and Tiller [3] and perhaps the most famous extension to this work was made by Grinfeld [4, 5, 6]. They have theoretically shown that a stressed flat surface is thermodynamically unstable, and surface and bulk diffusion as well as dissolution and deposition of material will inevitably lead to roughening of a stressed surface. This process is counteracted by the surface energy that tends to flatten a surface. This leads to a surface roughness with a stress dependent characteristic wavelength spectrum. The phenomenon may appear at interfaces subjected to SCC or etching as Asaro, Tiller and Grinfeld considered. It may also be observed at crystal growth, treated theoretically by e.g. Spencer et al. [7] and at the interface between a
solid and its melt by e.g. Grinfeld [8].
An extension of the theoretical analysis of the developing surface rough-ness was developed by Yang and Srolovitz [9]. They found that if the surface was allowed to continue to evolve, the initial perturbations of the surface grow into cusp like pits and concluded that this may be a connection between the initiation of cracks and crack growth. In an analysis, Yu [10] found that a flat surface will develop a roughness and cracks as long as the stress can destabi-lize the surface. At first the surface roughens and blunt pits, that eventually may sharpen into cracks, grow. This implies that the process does not have a stress threshold value. However, the time for a development to a crack can be significant, and they defined a stress threshold value over which a notch would immediately form and grow into a crack. Sou and Yu [11] made cal-culations on a stressed cycloid shaped surface and found that small grooves would grow into a shape where the surface evolve invariantly if the stress is small and, if the stress is large enough, the grooves will instead form sharp cracks. Spencer and Meiron [12] continued this approach with a nonlinear evolution law and found that singular grooves, cusps, form as a direct re-sult from the nonlinear part. The more irregular the initial surface is, the more pronounced the non linearity contribution would be. The solution they found is unambiguous which makes it possible to reverse the approach and get a measure of the stress on the surface by examining the surface rough-ness wavelength distribution. An experimental procedure for calculating the stress from the wavelength distribution was developed by Kim et al. [13] and Yu and Sou [14]. Grilh´e [15], on the other hand, found the solution to be multi valued when applying a different technique calculating the energetic driving force for roughness appearance on a free surfaces under stress. See also Grilh´e [16] and Colin and Grilh´e [17]. Finally, Song et al. [18], Yang [19] calculated the surface evolution in a thin elastic layer and found the frequency of the surface roughness to be dependent not only on the stress and material properties, such as the modulus of elasticity or surface energy, but also on geometrical factors such as the thickness of the layer.
Simulations of surface evolution using different numerical methods, based on e.g. the finite element (FE) analysis, have been conducted to evaluate the phenomenon. Prevost et al. [20] developed a numerical technique to analyse and simulate the dissolution and mass transport processes. This procedure can be used for simulating crack initiation under various conditions, e.g. at grain boundaries. However, crack growth is not at all considered. The situation with a growing SC crack has been considered by Jivkov and St˚ahle
[21], Jivkov [22]. In this case, the growing crack is driven by dissolution of material due to breakage of a protective oxide film on the body boundary where strain exceeds a threshold value. According to this model, the width of the crack may not be finite, as is found by others mentioned above, and the crack cannot be sharp unless the growth mechanism is changed. This is also seen with SC cracks found in nature. Another interesting result is that the cracks grow in a self similar manner. St˚ahle et al. [23] have used numerical methods for simulation of crack growth from energetic relations and come to the similar results as Jivkov has.
Shreter et al. [24, 25] performed etching experiments on mechanically loaded silicon plates. It was found that on a nanometre scale the surface was roughened due to oxidation induced stacking faults. On a micrometer scale, small cracks appeared transverse to the direction of loading. Only compressive load gave signs of attack. The number and length of the visible cracks were found to be increasing with increasing load and no threshold value was found in the experimental results.
This work is concerned with the initiation of SCC in polycarbonate, PC, exposed to an acetone solution. Section 2 describes the polycarbonate and acetone properties and the next section 3 describes the experimental setup. In Section 4, results are presented and discussed. Two different signs of attack are found on the surface; these are pits and cracks. The distribution of pits and crack patterns are analysed. The way the cracks coalesce, tip to side, is investigated and the finding is supported by stress analysis. A simulation of the growth of multiple cracks is also presented in this section. Last, a few remarks on the present study, followed by the conclusions, are found.
2. Material and preparation
The material used in this investigation is an industrial grade of MACRO-CLEAR polycarbonate, PC, (Arla plast AB, Sweden), which is a transpar-ent, amorphous and isotropic thermoelastic polymer with Young’s modulus E = 2.3 GPa, Poisson ratio ν = 0.38, tensile yield stress σy = 63 GPa. The
material is used in the as received state, no measures is undertaken to the surface but rinsing with ethanol that is known to react very slowly with PC. During manufacturing, the material is extruded to a plate, and thus a certain degree of anisotropy can not be ruled out, but is not likely. In this study, all specimens are cut in the same direction and no investigation is made for
ferent directions in the material. Residual stresses present in a material due to e.g. manufacturing and preparation can be significant and influence the result. A polariscope is used to determine if any residual stresses are present from the manufacturing and cutting processes. Only specimens without any sign of residual stresses are chosen.
Polycarbonate is chosen due to it’s comparably high fracture toughness of K = 3.7MPa m1/2, Sardinha et al. [26], compared to other polymers. It is easily machined and prepared. Polycarbonate is also know to be resistant to many chemicals and can in many cases be suitable as substitution to glass in chemical containers. However, a few agents are known to attack and dissolve it. Among the most aggressive is acetone which diffuses easily in PC and dissolves it in a hydrolysis process. Acetone is used in the polymerisation of polycarbonate. The exposure to acetone forces the polymerisation processes to be reversed leading to a defined dissolution of the material. The acetone is supplied by VWR International, Stockholm, Sweden, and is an industrial grade with a purity of at least 99.5%.
The load used in this study is insignificant compared with the toughness of PC and the specimens are only stretched in the elastic region. Without the addition of acetone, no damage can be seen. Polycarbonate is also cho-sen because it has proven usable in similar studies. Gunnars et al. [27, 28] used this material combination to study non branching crack propagation directions, and Hejman and Bjerk´en [29] studied crack paths for branching cracks.
3. Experimental setup and procedure
A rectangular test specimen with a length of 100 mm and a width of 20 mm is cut out from a PC plate with the thickness 3 mm using a hacksaw. To avoid crack initiation at the edges, they are polished to a reasonable smoothness and then covered with a protective layer of epoxy glue.
The test specimen is subjected to three point bending. An illustration of a specimen mounted in the test rig is shown in Fig. 1. With this fixation, the effective test length of the specimen, l′, is not the same as the geometrical length, l = 100mm. If nothing else is stated, from now on the meaning of the specimen’s length is always referring to the effective length. The whole configuration is submerged into an acetone and water solution. This setup allows study of both sides of the specimen with the exception for the small distance covered by the middle support. The rig is considered as stiff as
compared to the specimens, it is made of stainless steel and is not affected by the test solution.
The concentration of acetone and the exposure time is correlated so that the specimens would not break immediately. In the hydrolysis, the acetone solution dissolves the PC, and carbon dioxide and water is produced. Some investigations of this phenomenon have been made by Ghorbel et al. [30] and for water by Akele and Thominette [31]. It has been shown that static stresses in the PC drastically accelerates the hydrolysis, cf. Liu et al. [32] and Ghorbel et al. [33]. Using the acetone in the received purity of 99.5%, the reaction was too fast to be easily controlled. To this end, the acetone is diluted with distilled water in various proportions to slow the process down and thereby gain better control of the process. A solution with less than 90 weight % acetone renders no visible reaction for times suitable for repeated experiments. In this study, the test pieces are exposed for a time of a few seconds. Solutions with 92 weight % acetone is found to be the most appropriate for this case. This concentration is used merely on empirical basis.
Images of the specimen’s surface are collected and examined with an optical microscope. Both sides of a specimen is studied for cracks and pits. The surface is divided into equally sized regions representing all magnitudes of the linearly varying stress on the surface, see Fig. 2. The number of pits is counted in square shaped areas in every region, marked with the number 1, and the number of cracks crossing a straight line, marked with the number 2, is counted in every region. Finally, the total length of the cracks present in every interval is measured. An area density of pits and linear density of cracks can then be calculated at regular intervals along the surface to get a measure of the attack at different stress levels in both compression and tension. The regions are so narrow that the stress can considered to be constant within them.
The micrographs are also used in an attempt to investigate the possibility for the pits to act as crack initiation sites. To this end, the distribution of the cracks is examined and a numerical simulation of the crack growth is performed. It is also noted that the cracks coalesce to form stripes over the sample surface, and the nature of the meetings are looked upon by a FE analysis of the geometry at hand.
l=100 mm 3 mm
Specimen Rig
x l’
Figure 1: A side view of a specimen mounted in the three point bend rig. The width of the specimen is 20 mm.
Figure 2: Overview of a sample surface showing the cracks, and how they are quantified.
4. Results and discussion 4.1. Stress distribution
The type of loading used makes it easy to calculate the stresses on the surface of the specimens. For long slender beams and ideally sharp supports, three point bending gives a linearly varying plane stress state along the surface. The maximum is positioned at the middle of the specimen and zero stress at the outer supports. A FE analysis of the problem at hand confirms that this is true also for a beam of the present dimensions except the parts resting on the middle support. Due to symmetry, only half the beam is shown, the centre part of the beam corresponds to the right hand side of the figures. The FE analysis has been performed using ABAQUS [34]. The result is shown in Fig. 3. The variable x is defined in Fig. 1. In all figures and text, σ, refers to the stress component at the surface parallel to the load. The maximum value is denoted σ0 and is chosen to be the highest value found at the middle of the
beam. The small dip found in Fig. 3 is an artifact due to the finite width and rigidity of the boundary conditions chosen. In reality, the middle support is not so firmly attached. This small effect is neglected and the maximum used
Figure 3: The stress along the surface in three point bending from FE analysis.
is found a small distance away from the geometrical center of the beam, as can be seen in Fig. 3. The normalised stress σ/σ0 is used in the following.
4.2. Pit occurrence
Figure 4(a) shows a representative part of the surface prior to exposure. On the exposed specimens surface, there is evidence of attack on two differ-ent length scales. Figure 4(b) shows a micrograph of the surface, revealing a roughness in the micrometer domain. At higher magnification, it becomes apparent that the roughness is in fact pits that can be seen as dots on the micrograph. Due to limitations in the optical microscope and the size dis-tribution of the pits, it is hard to determine their size. A typical order of magnitude is a few micrometers but only the number is taken into account, not their size. These pits are assumed to be plausible crack initiation sites. As described in Section 3, the area density, D, of the dots is counted and used as a measure of the severeness of the attack. The normalised dot den-sity, D/D0versus σ/σ0, is shown in Fig. 5. D0 is the maximum dot density
found on the samples. From the figure, it is possible to speculate of a posi-tive stress threshold value of approximately σth/σ0 ≈ 0.5, under which only
general attack takes place irrespective of load and is also true for negative stress. Above this stress, the PC-acetone interaction seems to have a stress
(a) (b)
Figure 4: Typical micrographs of the polycarbonate surface. (a) Before and, (b) after test. The roughness consists of pits seen as dots.
dependent part also.
The pattern of pits can be depicted as a pattern of dots. To find any correlation between the pits, Fourier analysis is employed to search for any characteristic distribution. No preferred distance between the pits can be found. The pits appear to be completely randomly distributed and, at least in areas small enough that the the stress may be considered as constant, no correlation with the ATG phenomenon can be found. This may be inter-preted as a simultaneous initiation of the pits so they do not have any chance to influence each other and is also an indication that the distribution of pits, in this case, is not an ATG instability phenomena.
4.3. Crack occurrence
On a larger scale, visible to the bare eye, cracks form perpendicular to the load. Figure 6(a) shows one of these surface cracks. Due to polarization of the light and the stress optical properties of polycarbonate, light or shadow like artifacts in the vicinity of the cracks is visible. At this low magnification, no dots are clearly seen. The number of cracks formed at the surface is counted as a linear density, denoted with N, parallel to the orientation of the load, as described in Section 3. If nothing else is stated, the meaning of a crack is always referring to cracks appearing on the specimen’s surface and can be seen as furrows on the specimen transverse to the direction of loading. The length of these furrows is measured, but the penetration depth is not considered. On the surface, many cracks form and grow towards each other. This is seen in Fig. 6(b). Fig. 6(c) shows the corresponding map of
0 0.2 0.4 0.6 0.8 1 0 0.2 0.4 0.6 0.8 1 σ/σ 0 D/D 0
Figure 5: The area density of dots along the stressed surface.
crack initiation sites. This will be discussed in the next paragraph. Figure 7 presents an average of the normalised linear density, N/N0 along all the
specimens’ surfaces. N0 is the maximum crack density. Here, a positive
stress threshold value at σth/σ0 ≈ 0.3 is found for the formation of cracks.
For stress exceeding this value, the density is seen to increase approximately linearly with the stress and no cracks are found for lower and negative stress. The total crack length, L, in each region is measured, cf. Section 3. Figure 8 shows the relationship of the normalised length L/L0 and the normalised
stress. It is seen that the length of surface cracks increase linearly with the stress after the stress threshold value is exceeded. Using all data points for N/N0 and L/L0 larger than zero, a linear fit of the relationships can
be computed for the crack density N(σ) ≈ 0.78N0(σ/σ0 − 0.27) and crack
length L(σ)≈ 1.1L0(σ/σ0−0.21), respectively. The threshold values for crack
formation can be identified in the relationships as 0.21 and 0.27 respectively. It is expected to find these two values to be the same since no crack length can be measured without crack formation. A common threshold value could be found to be approximately 0.25.
It is now of interest to find the origin of the cracks. Here it is assumed 11
(a) (b) (c)
Figure 6: (a) One crack on a specimens surface. (b) An area used to analyze the distribu-tion of initiadistribu-tion sites. The corresponding map of the initiadistribu-tion sites are indicated in (b) and explicitly shown in (c).
that the pits described in Section 4.2 act as initiation sites. Only a fraction of all available pits will grow into cracks and the distribution of these pits is investigated. To find a reasonable location for a initiation point of a crack the following assumptions are made: The cracks are taken to extend with the same rate at both ends, which is a plausible situation not contradicted by any of the experimental results. The crack growth rate is assumed to be constant and independent of stress. Since this is a stress corrosion phenomenon, the rate is controlled by chemical reactions at the crack tips, and these are not influenced by the load but rather by the diffusion rate of spices to and from the crack tip region Jones [2]. These assumption will be addressed and used later in Section 4.5. Ostensible conclusions from the given postulates are the choice of taking the centre point of a crack as its origin and define the middle point of a crack as its initiation site. An example of this can be seen in Fig. 6(c) where a map of crack mid points, corresponding to the crack pattern in Fig. 6(b) is depicted. It is seen that a similar random pattern of initiation sites is found as for the pit distribution in general described in Section 4.2. However, a significant difference can be noted in the randomness. A Fourier analysis of the crack initiation site distribution reveals that the pattern is random in nature but the initiation sites are also uniformly distributed and is never seen to be very close together. This is not surprising, since a region around a growing crack exhibits stress relaxation and this indicates some dependence between pits that grow into cracks.
0 0.2 0.4 0.6 0.8 1 0 0.2 0.4 0.6 0.8 1 σ/σ 0 N/N 0 N/N 0 − Experiments Linear fit
Figure 7: The linear density of cracks along the stressed surface.
0 0.2 0.4 0.6 0.8 1 0 0.2 0.4 0.6 0.8 1 σ/σ 0 L/L 0 L/L 0 − Experiments Linear fit
Figure 8: The total length of cracks along the stressed surface.
4.4. Crack coalescence
If the cracks are allowed to grow, they will eventually encounter each other. When this happens, they are seen to coalesce to form stripes of cracks across the specimen’s surface. The specimen will finally break along these stripes if the exposure is not aborted. In this investigation, the test is always termi-nated long before that happens. This Section presents experimental results and a finite element stress investigation of the direction of crack growth of two meeting cracks. A special feature can be observed at the point of coa-lescence. From Fig. 9, it is seen that the crack tips avoid each other. They attract each other first at a point where crack tips from two parallel and meeting crack are approximately at the same position in the direction of crack growth, but they need not necessarily be exactly approaching each other as long as the tips meet close enough to influence each other. The distance between two meeting cracks, for this to happen, is dependent on the crack lengths. The resulting coalescence is formed crack tip to crack side, not tip to tip. This observation is in line with results for co-linear cracks by Melin [35], who showed that meeting crack tips avoid each other. How-ever, Melin did not consider coalescence. From Fig 9(b) it is also apparent that the cracks never coalesce completely, at least not at the surface. A FE analysis of two meeting cracks in a large plate is performed. Figure 10 shows an illustration of the geometry, but where the distance, d, between the two crack planes is exaggerated compared to the height, h. The crack length a = h/2, and d = a/100. An external load is applied perpendicular to the crack planes. The symmetry of the stress field in the crack tip region is investigated. Most cracks, irrespective of process, grow in mode I. This assumption is adopted also in this case so that the cracks are assumed to grow in the direction where the gradient of the effective stress is largest, see e.g. Broberg [36]. Figure 11 shows contour plots of the effective stress (von Mises) for three different crack configurations. The three steps are chosen to represent the meeting of two cracks. The crack tips are rounded, since the assumed crack growth mechanism is dissolution, which was discussed earlier. In the first case, where the cracks are approaching each other, ξ =−d/2, the stress distribution may indicate that the cracks during continuous growth will turn outwards, avoiding each other. When the crack tips are located at the same horizontal position, ξ = 0, the stress field seems quite symmetric around the tips. In the next situation, where the crack tips have passed each other, ξ = d/2, the stress distribution is clearly tilted inwards, and thus the cracks are assumed to continue to growth towards each other. This
(b)
Figure 9: Close up of the crack tips showing how they are believed to initiate at the center and grow to approach each other and coalesce.
reflects the observed crack pattern, except that no initial outward deviation is observed. To further explore the position where the cracks start to at-tract each other, that is when the shearing of the crack tip is changing sign, a displacement ratio between nodes at the crack flanks for the three crack advances shown in Fig. 11, are calculated from the FE analysis according to the difference in displacement in the x-direction divided with the difference in the y-direction. The horizontal distance between the cracks are ξ = d/2, 0 and d/2, respectively, cf. Fig. 10. The displacement ratios are obtained for the nodes at the crack flanks that are closest to the rounded crack tip, cf. Fig. 12(a). The result is shown in Fig. 12(b), and the shear displacement is found to change sign at approximately ξ = 0, as expected. Figure 13 shows a situation for crack growth when the cracks have started to attract each other and they are approaching one another at an angle, chosen to be 45◦. It can be seen from the stress distribution that the cracks may continue to gradually turn towards each other.
4.5. Multiple crack initiation and crack growth simulation
A simulation of the growth of multiple cracks is performed, based on the observations and assumptions discussed in previous sections. A set of crack initiation points are randomly distributed over a surface, see Fig. 15(a). The side length of the surface is denoted l0. No new cracks initiate during
a simulation. The surface studied is considered small enough to represent 15
h
a d
ξ
Figure 10: Geometry and loading used in the FE analysis, h >> d.
ξ =−d/2 ξ = 0 ξ = d/2
Figure 11: Contour plot (von Mises) from the FE analysis of two meeting cracks. The variable ξ is defined in Fig. 10. The contours correspond to the same stress level, the numbering indicates where to find the same level of stress, between all sub figures.
(a) (b)
Figure 12: (a) Nodes used to calculate the displacement ratio. (b) Displacement ratio (x) of nodes marked in (a) at different stages of crack advance, and a linear fit(-).
Figure 13: Contour plot (von Mises) from the FE analysis of two meeting cracks after they have started to attracted each other. The stress levels indicated with 1 and 2 correspond to the same stress level in Fig. 11
σ
σ
Figure 14: Schematic view over the crack growth scheme used to simulate the surface crack growth.
an area where the nominal stress is constant. The crack growth rate, v0, is
assumed to be constant during a simulation. The total time of a simulation is denoted t0, and is divided into constant time increments, ∆t. Here, Dt is
chosen to equal t0/500. This corresponds to that the crack extension at a tip
∆l equals l0/500 during one time step.
Before coalescence starts, a crack grows perpendicular to applied load, cf. Fig. 15(b). As soon as two meeting crack tips are perpendicular to or have passed each other, and the distance between them is less than a certain fraction of the sum of crack lengths, each crack turns 45◦ towards the other.
Thereafter, the path of the cracks is straight again, as illustrated in Fig. 15(c). No stress analysis is performed during this type of simulation. The growth direction is governed solely by geometrical considerations. The choice of a deviation angle of 45◦ seems reasonable with regard to the experimental
observations and the results from FE analysis, cf. Fig. 9 and Figs. 11 to 13. As two cracks coalesce, they are combining into a single crack, whose outer tips are now the only growing crack tips. From Fig. 9, it is can be seen that two meeting cracks do not grow together completely. In the analysis, this effect is neglected since the method is not based an analysis of the stresses, as mentioned above, and thus does not change the outcome of the simulation.
The simulated surface crack pattern evolution is shown in Fig. 15(b)-(d). When comparing the crack pattern found in Fig. 6(b) and the simulated pattern in Fig. 15(d), the same characteristics can be found. For example, in Fig. 6(b) it is seen that the distance between a crack tip and the location at
(a)
(c)
(b)
(d)
Figure 15: ((a) Initiation sites at the beginning of simulation. (b)-(d) Advancing simulated crack pattern.
its flank, where the other crack meet, increases with the distance for which the two cracks started to interact. However, the tendency to line up and create stripes of cracks is not so pronounced, but can be imagined in some areas. Two meeting crack ends must have reached the same lateral position to be alongside before coalescence can take place, therefore the tips will always miss each other and creat a rhomboidal piece between the cracks when they finally approach each other. This feature is a simple approximation that corresponds to the hook like shape that is seen experimentally.
A consequence of the assumption that the crack growth rate is constant is a decreasing total extension rate, dL/dt, where L is the sum of crack lengths. As more and more cracks coalesce, the number of free ends decreases. According to the assumption of simultaneous initiation, no new cracks initiate to compensate for this decrease. Figure 16 shows that the total crack growth rate first is constant, and then decreases as more and more coalescence takes place. Crack coalescence, in this case, begins at approximately t = 0.1t0.
The decrease is assumed to be logarithmic, and such a curve fitted to the data points is also included in the figure.
Hitherto, the studied area is considered to represent the same spot on a sample, and the evolution of crack pattern is followed with time. However, it may be possible to regard the result of the simulation to reflect a single moment in time for areas experiencing different nominal stress. The density of initiation spots increases approximately linear with stress, as observed from the experiments. Consider the pattern in Fig. 15(d) to represent a part of the sample where stresses are large, and Fig. 15(b) smaller stresses. Since the patterns reflect the situation at one moment, the cracks that have not coalesced must be equally long for both areas. This means that the different figures represent different length scales, equivalent to different time steps. In accordance to the experimental findings, crack coalescence is more probable at larger stress levels simply due to more initiation sites. Thus, Figure 16 also may represent the total crack length change, L, with nominal stress. However, comparing with the results from the experiments, see Fig. 8, a decrease in L/σ0, is not observed.
5. Further remarks
On the PC surface, two signs of attack are discovered. A surface roughness, seen as dots, that appears without a threshold stress and also in compression but is seen to have a slight dependence on positive stress. This may mean