Västerås, Sweden
Thesis for the Degree of Bachelor of Science in Engineering
-Computer Network Engineering
Impact of using cloud-based SDN
controllers on the network
performance
Authors:
Alexander Magnusson
amn16006@student.mdh.seJohannes Henriksson
jhn16010@student.mdh.seExaminer: Mats Björkman
mats.bjorkman@mdh.se
Mälardalen University, Västerås, Sweden
Supervisor: Mohammad Ashjaei
mohammad.ashjaei@mdh.seMälardalen University, Västerås, Sweden
Supervisor: Svetlana Girs
svetlana.girs@mdh.seMälardalen University, Västerås, Sweden
network planes. SDN has tree layers: infrastructure, controller, and application. The goal of SDN is to simplify management of larger networks by centralizing control into the controller layer instead of having it in the infrastructure. Given the known advantages of SDN networks, and the flexibility of cloud computing. We are interested if this combination of SDN and cloud services affects network performance, and what affect the cloud providers physical location have on the network performance. These points are important when SDN becomes more popular in enterprise networks. This seems like a logical next step in SDN, centralizing branch networks into one cloud-based SDN controller. These questions were created with a literature studies and answered with an experimentation method. The experiments consist of two network topologies both locally hosted SDN (baseline) and cloud hosted SDN. The topology used Zodiac FX switches and Linux hosts. The following metrics was measured: throughput, latency, jitter, packet loss, and time to add new hosts. The conclusion is that SDN as a cloud service is possible and does not significantly affect network performance. One limitation with this thesis was the hardware, resulting in big fluctuation in throughput and packet loss.
Table of Contents
1 Introduction 1 2 Background 2 2.1 Software-Defined Networking (SDN) . . . 2 2.1.1 OpenFlow . . . 3 2.2 SDN controller . . . 3 2.2.1 FloodLight . . . 3 2.2.2 OpenDayLight . . . 3 2.3 Cloud . . . 42.4 Network performance metrics . . . 4
2.4.1 Network performance tools . . . 4
2.4.1.1 Ping . . . 4
2.4.1.2 iperf . . . 4
3 Related Work 5 4 Problem Formulation 6 5 Method 7 6 Ethical and Societal Considerations 8 7 Experimental Setup 9 7.1 Hardware, software and topology . . . 9
7.2 Measurement script . . . 10 7.3 Performance metrics . . . 11 7.3.1 Latency . . . 11 7.3.2 Jitter . . . 11 7.3.3 Packet loss . . . 11 7.3.4 Throughput . . . 12
7.3.5 SDN Flow Table Update Rate (SDN-FTUR) . . . 12
8 Results 13 8.1 Baseline one switch Locally hosted SDN . . . 14
8.2 Baseline two switches Locally hosted SDN . . . 17
8.3 Microsoft Azure EU-West one switch Cloud hosted SDN . . . 20
8.4 Microsoft Azure EU-West two switches Cloud hosted SDN . . . 23
8.5 Microsoft Azure US-East one switch Cloud hosted SDN . . . 26
8.6 Microsoft Azure US-East two switches Cloud hosted SDN . . . 29
9 Discussion 32
10 Conclusions 35
11 Future Work 36
References 37
Appendix B Python SDN-FTUR script 40
Listings
A.1 Flags and attributes of the performance commands . . . 39
B.1 SDN-FTUR script . . . 40
B.2 Commands for setting interface to down and changing MAC address . . . . 40
List of Figures
2.1 SDN layers and API communications for the layers . . . 25.1 Diagram of the research method used in this thesis . . . 8
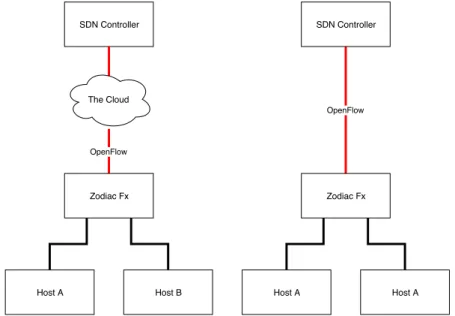
7.1 Topology with one SDN switch, both local and cloud . . . 9
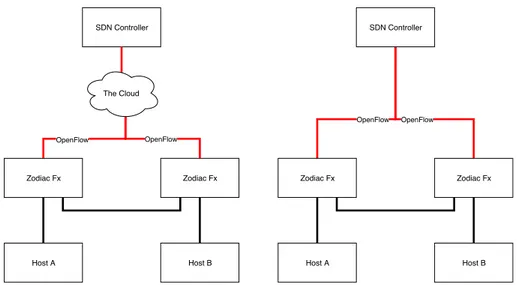
7.2 Topology with two SDN switches, both local and cloud . . . 10
8.1 Baseline one switch topology: SDN-FTUR . . . 15
8.2 Baseline one switch topology: Latency (One way) . . . 15
8.3 Baseline one switch topology: UDP jitter . . . 15
8.4 Baseline one switch topology: Throughput (TCP) . . . 16
8.5 Baseline one switch topology: Packet loss . . . 16
8.6 Baseline two switches topology: SDN-FTUR . . . 18
8.7 Baseline two switches topology: Latency (One way) . . . 18
8.8 Baseline two switches topology: UDP jitter . . . 18
8.9 Baseline two switches topology: Throughput (TCP) . . . 19
8.10 Baseline two switches topology: Packet loss . . . 19
8.11 Microsoft Azure EU-West one switch topology: Latency to server (RTT) . . 20
8.12 Microsoft Azure EU-West one switch topology: SDN-FTUR . . . 21
8.13 Microsoft Azure EU-West one switch topology: Latency (One way) . . . 21
8.14 Microsoft Azure EU-West one switch topology: UDP jitter . . . 21
8.15 Microsoft Azure EU-West one switch topology: Throughput (TCP) . . . 22
8.16 Microsoft Azure EU-West one switch topology: Packet loss . . . 22
8.17 Microsoft Azure EU-West two switches topology: Latency to server (RTT) 23 8.18 Microsoft Azure EU-West two switches topology: SDN-FTUR . . . 24
8.19 Microsoft Azure EU-West two switches topology: Latency (One way) . . . . 24
8.20 Microsoft Azure EU-West two switches topology: UDP jitter . . . 24
8.21 Microsoft Azure EU-West two switches topology: Throughput (TCP) . . . 25
8.22 Microsoft Azure EU-West two switches topology: Packet loss . . . 25
8.23 Microsoft Azure US-East one switch topology: Latency to server (RTT) . . 26
8.24 Microsoft Azure US-East one switch topology: SDN-FTUR . . . 27
8.25 Microsoft Azure US-East one switch topology: Latency (One way) . . . 27
8.26 Microsoft Azure US-East one switch topology: UDP jitter . . . 27
8.27 Microsoft Azure US-East one switch topology: Throughput (TCP) . . . 28
8.28 Microsoft Azure US-East one switch topology: Packet loss . . . 28
8.29 Microsoft Azure US-East two switches topology: Latency to server (RTT) . 29 8.30 Microsoft Azure US-East two switches topology: SDN-FTUR . . . 30
9.1 Microsoft Azure US-East one switch topology: UDP Throughput compered to packet loss . . . 33
1
Introduction
Requirements of modern networks have changed drastically over the last 10 years. Modern production networks require higher speeds, better flexibility, and higher uptime. Network administration in enterprises becomes more scalable and more flexible. To administrate large networks, several protocols, technologies, and redundancies must be implemented. This complexity can be handled by not having to manage separate network equipment and instead manage the entire network with a central controller. This is one of the purposes in Software-Defined Network (SDN). In an SDN network, the entire topology can be configured and managed with a flexible software solution. The next step in an SDN network is to simplify the deployment of SDN controllers and move them up in the cloud. The cloud is becoming the future of enterprise networks. With more and more services becoming available as cloud services for businesses. The cloud services tend to have a better scalable payment options, and payment scaling from small businesses to large enterprises with the same level of services.
The cloud-based SDN makes it in a way that every branch of the enterprise can be controlled and configured in one place. This can drastically simplify complex network management. Especially as the goal of SDN is to create an open source flexible solution that will work independently of the hardware vendor [1].
This thesis focuses on evaluating the deployment of cloud-based SDN. The main goal of the thesis is to evaluate whether it is feasible to have a cloud-hosted SDN controller and evaluate how the centralized cloud-hosted SDN controller impacts network performance.
2
Background
In traditional networks, the network functions can be divided into three planes: Data plane, Control plane, and Management plane. The Data plane handles data that is flowing through a device with another device as the destination [2]. The Control plane handles the function that relates to determining the path to the destination of the data. The Control plane populates the routing table with all known route. The Data plane can use the best path to reach the destination based on the longest specific prefix and administrative distance. The Management plane handles function related to the monitoring and administration of the device.
2.1 Software-Defined Networking (SDN)
SDN is an important network architecture for managing large and complex networks [3]. SDN has support for re-policing and re-configurations during runtime. SDN network traffic is controlled by a central software-based controller that lays in the Control layer [3], [4]. The SDN controller can re-program the flow of the network which is done by chaining to routes for different network traffic.
SDN is built on three layers, which include Application layer, Control layer, and Infras-tructure layer [4], [5]. These layers communicate using different Application Programmable Interfaces (API), These layers and API communication can be seen in Figure2.1. North-bound API is used between the Application and the Controller Layers. While the Control Layer and Infrastructure Layers communicates via Southbound API. There are different controller software for SDN, some examples are NOX, POX, and FloodLight, all these controllers use OpenFlow as the Southbound API [3].
Application Layer
Northbound API
Controller Layer
Southbound API
Infrastructure Layer
2.1.1 OpenFlow
OpenFlow began its development at Stanford University and considered to be one of the first and the most popular SDN standards [3], [6]. OpenFlow enables the SDN controller to directly interact with the forwarding plane of the infrastructure, e.g., switches and routers. The SDN controller gets instructions from the Application Layer via the Northbound API. These instructions tell the controller how the infrastructure should be controlled, which is done by the Southbound API, know as OpenFlow. The infrastructure can both be physical and logical hardware. OpenFlow is a flow-oriented protocol, which means that the OpenFlow hardware has one or more Flow Tables, Group Tables, and one OpenFlow channel to enable communications. OpenFlow and SDN enable easier separation and abstraction of the infrastructure to manage large networks.
2.2 SDN controller
In an SDN Network, the controller handles the decision making. The controller is a software running remotely. There are several SDN controller to choose from. This thesis focuses on FloodLight and OpenDayLight, which both of them are popular for there network performance and unique features.
The controller handles decision making for routing and switching of all the devices connected to the controller. Having a centralized controller means that administration and configuration are also centralized to the controller instead of every network device needing to be configured separately to be able to make decisions. The controller software also runs the Northbound and Southbound API to communicate with the Application and Infrastructure layer.
2.2.1 FloodLight
FloodLight is an SDN controller build for the protocol OpenFlow. Floodlight is an Apache-licensed, open source controller built in Java, with contributions from Big Switch Networks and a community [7]. FloodLight is built with modules, where different modules have a specific task in the controller software. Some of the tasks handled by modules are link-discovery, topology management and forwarding but also security features like a firewall.
2.2.2 OpenDayLight
There is a lot of different controllers using OpenFlow as the Southbound API, one of the more popular controllers is OpenDayLight for its support of multiple different Northbound and Southbound API. OpenDayLight is a Java based SDN controller developed as a Linux Foundation project [8]. OpenDayLight is built to support multiple different Southbound API protocols. This is done by building a standardized Northbound API and using different modules to support protocol like OpenFlow. By using modules for the Southbound API, OpenDayLight can support other Southbound protocols than just OpenFlow and with these modules, OpenDayLight can support: Open vSwitch Database (OVSDB), NETCONF, Interface to the Routing System (I2RS) and many more [9]. Having support for multiple different Southbound protocols makes OpenDayLight flexible and adaptable to different
2.3 Cloud
The cloud is an on-demand data service over the Internet [10], [11]. The cloud is often more scalable than having a locally hosted infrastructure and tends to be a ”pay what you use” model. The cloud services can be separated in a couple of categories, Software as a Service (SaaS), Platform as a Service (PaaS) and Infrastructure as a Service (IaaS).
2.4 Network performance metrics
Network performance metrics are useful statistics when troubleshooting networks or when assessing network functionality. [12].
Latency is a delay of packet transmission from one host to another. The latency can be measured in different ways where round-trip time (RTT) measurement is the most common way [12], [13]. Throughput is the effective network capacity and is measured in the amount of data sent or received in a unit of time. Packet loss or packet delivery ratio is the number of packets delivered successfully compared to the number of total packets sent [13]. Jitter is the variation of network latencies i.e. the difference between the maximum and minimum latency [14].
2.4.1 Network performance tools
With the importance of network performance metrics and the usefulness of these metrics, some tools are required. In the following sections, two tools are presented that can accomplish measuring the above network performance metrics.
2.4.1.1 Ping
Ping is a standard tool in most operating systems (OS). In Linux it is included in the following packages inetutils and iputils, which are included in the standard OS toolset [15]. Ping uses Internet Control Message Protocol (ICMP)-Echo to check connectivity to an interface or a remote host. ICMP-Echo is built on replies from a remote host and measuring statistic from these replies, like latency and packet loss. Ping can be modified to change packet size, number of packets and maximum response time before a packet is assumed to be lost.
2.4.1.2 iperf
iperf is a network performance tool to measure bandwidth [16]. iperf can use both Transmission Control Protocol (TCP) and User Datagram Protocol (UDP) in a client-server model. The client generates traffic to the client-server. iperf can give statistics on throughput in both TCP and UDP, jitter with UDP, and packet loss with UDP and if packets were received out of order. iperf can be implemented to work in both IPv4 and IPv6 networks with different packet sizes. iperf exists as a Unix and Linux program.
3
Related Work
Asadollahi and Goswami [17] simulated SDN performance with a FloodLight 1.2 SDN controller. The simulation was done with mininet which is a network virtualization tool. The simulated network contained six switches, one SDN controller and 50, 150 or 300 network hosts in various experiments. In these three experiments an even number of hosts where placed on every switch except on one which only connected to the other switches. The switches were connected in a full mesh topology to minimize delays in the transmission. The reason for leaving one switch empty of hosts was to make a realistic bottleneck in the network. The network performance was measured with iperf in TCP and UDP mode. The results show that the more host connected, the lower the network throughput. The biggest jump in throughput was from 50 to 150 host where 150 to 300 did not give an as significant difference in network throughput. The results of the network latency were similar and in all cases. latency was below or around 0.01ms to 0.02ms. Only in 300 hosts latency was high (0.3ms to 0.5ms) in the beginning, then dropped to the same 0.01ms to the 0.02ms range.
Basu et al. [5] tested network performance with SDN as a cloud service. The main point of the experiment was to see the difference in performance between three different SDN controller software, POX, NOX, and FloodLight. The experiment was set up as follows. A simulated network on mininet and a remote host as the SDN controller on an external Virtual Machine (VM). The results show relative performance between the controller software. The performance measured in the experiment was throughput and latency using the tool Cbench from OFlops. The results show that NOX and FloodLight were similar compared to POX which had the worst performance with a big variation. Were NOX and FloodLight behaved similarly with a low variation in performance. The conclusion was that POX is suitable for experimentation, while the other controllers can be used for real network administration.
Rowshanrad et al. [18] tested performance of different SDN controller. The main point of the experiment was to see the difference between the two popular SDN controllers FloodLight and OpenDayLight. The experiment was done with a simulated network on mininet with three different topologies. The first topology is one switch with eight hosts, the second topology has eight switches connected in series with one host per switch, and the third topology is a tree structure with three tiers with eight host connected to the lowest tire. The test of network performance was done with latency, jitter, packet loss, and throughput. The results show that for low to medium load networks OpenDayLight outperforms FloodLight and only in high load networks FlodLight outperforms OpenDayLight. The conclusion is that there is no significant network performance difference in other cases between OpneDayLight and FloodLight.
In this thesis, we use real implementation and experiments instead of using mininet, in contrast to the above works. Moreover, we deploy the SDN controller in various cloud providers to evaluate the performance of each provider with multiple different network performance metrics.
4
Problem Formulation
SDN allows a single controller to manage an entire complex network. This is a huge advantage for network administration as the networks grows and become more complex. This centralization can make a complex network easier to configure and maintain. As the enterprise grows usually comes more branch offices, these branches can be connected using the cloud and new network management capabilities can emerge. But with having a cloud-based SDN controller problems with latency can occur. If the controller is further away, southbound API communication will take longer, and this can cause loss of network functionality. With this it is important to make sure that the network functions properly and that the network has an acceptable network performance.
Moving features of the Control plane from the hardware to software, one of the logical next steps is to offload the computing of that software to a cloud environment. Making use of available computing in the cloud, we remove the need for hardware for the SDN controller on the physical location of the SDN network. By use of a cloud SDN controller, multiple SDN networks can be run from the same controller making it more resource efficient. This opens for administration and management of multiple networks from the same centralized SDN controller. This thesis aims at deploying the SDN controller to the cloud and evaluating the network performance. What is the difference in network performance between implanting SDN as a cloud service instead of locally hosted. The performance metrics in this thesis are throughput, jitter, packet loss, latency of traffic transmission, and time to add a new host to the network.
In this thesis we use real implementation instead of network virtualization which could be done e.g. using mininet or other similar platforms. With limited amount of lab equipment, a smaller topology is chosen. Although the network topology is small and limited, the results are beneficial in assessing the feasibility of using SDN on the cloud. Based on the above discussion, the research questions are as follow:
• How much does the performance of the SDN network differ if the SDN controller is placed on a cloud provider instead of locally?
• How does the use of different cloud locations affect the network performance of an SDN network?
5
Method
This thesis is going to use a literature study and an experimentation method on real lab equipment. The literature study is needed to look at related work, sharpen the problem formulation and get hints for possible solutions. The literature study is performed to learn how the hardware and software work and communicate. It is also needed to figure out what SDN software should be used for this thesis. With the knowledge from the literature study, we can now design the experiments to answer our research questions. If we can not answer the question we can go back to the literature study to gain more knowledge to be able to make an experiment to answer the question. The experimentation method builds on a baseline result of network performance. This baseline will be a locally hosted SDN controller on a topology. This topology will be used in all other experiments. This baseline should give the best-case scenario and the other experiments will be numerically compared to the baseline. The cloud-based SDN experiment will be done on the same topology but the controller will be hosted on different cloud providers and different cloud locations. The network performance of the SDN network will be measured in the same way as the baseline. For all the test and experiments, the same network performance metrics will be used: throughput, packet loss, latency, jitter, and time to add a new host to the network. These metrics will give a good indication if the network is working properly. With these experiments done the results can be numerically evaluated against the baseline to answer our research questions. This process can be seen in Figure5.1.
Literature study Design of lab Lab Measure baseline Measure Cloud Conclution
Figure 5.1: Diagram of the research method used in this thesis
6
Ethical and Societal Considerations
This thesis is an observation of network performance, the measurements of network performance metrics are all done by tools and scripts and no actual network traffic. This implies that no human test is going to be involved in the performance test and the tests are not going to involve even ourselves as factors. No production network is going to be used, i.e., the test network will be set up by us and we are going to be the only ones on this network. All of this is to make the test results more even and mitigate the human factors in these tests and experiments.
The result of this thesis must be taken relative and can not be taken absolutely. This is because the lab equipment is not meant to be in production networks and the software is not fully completed as is SDN. This will imply that our results are going to be a bit worse than if real production hardware and finalized software would be used.
7
Experimental Setup
In this section, we are going to decide what hardware, software, and measurement techniques should be used to answer the research questions.
7.1 Hardware, software and topology
The choice of the SDN controller was between OpenDayLight and FloodLight as they seem to have the best network performance. To make the best decision we installed both controllers and did a local network performance test with both topologies seen in Figure7.1
and7.2. After the experiment, we could see that FloodLight was more difficult to install (java version needed was not supported anymore) and to troubleshoot, while OpenDayLight could be deployed faster. However, OpenDayLight had one problem, in case of a switch disconnecting from the network. The controller did not auto-negotiate it back and a reboot of the controller was needed to fix this. Looking at the performance results, OpenDayLight performed much better getting link speed of almost 70 MBits/sec to 95 MBits/sec and a latency of around 1ms to 8ms and a packet loss of around 2% (per switch), for both topologies. FloodLight, on the other hand, did not work with OpenFlow 1.3, all floodlight experiments had to be done with OpenFlow 1.0 and in the topology 7.1. FloodLight’s latency was comparable with OpenDayLight of around 1ms to 20ms and throughput of 20 MBits/sec to 50 MBits/sec packet loss of around 2% (per switch). FloodLight in topology
7.2 was unusable with a latency of 100ms to 3000ms and max speed of 2kbps, a proper test of packet loss could not be done.
OpenFlow Zodiac Fx Host A SDN Controller The Cloud OpenFlow Zodiac Fx Host A SDN Controller Host B Host A
OpenFlow Zodiac Fx OpenFlow Zodiac Fx Host A Host B SDN Controller The Cloud OpenFlow Zodiac Fx OpenFlow Zodiac Fx Host A Host B SDN Controller
Figure 7.2: Topology with two SDN switches, both local and cloud
With all this information and testing we have decided to use OpenDayLight as our SDN controller. FloodLight’s inferior performance was probably a combination of incomplete configuration of FloodLight and our research hardware the Zodiac FX. This conclusion was based on the Flow table of the switch. OpenDayLight requires only 5 entries, while with FloodLigh the number of needed entries quickly raised up to 128 and after that the performance decreased. The SDN controller needed a different version of OpenFlow to work at all with the switch. The Zodiac FX officially supports OpenFlow 1.0 and 1.3, this should theoretically work with both controllers, but this was not the case. FloodLight needed OpenFlow 1.0 to even connect to the switch. OpenDayLight needed OpenFlow version 1.3 to get any flows to the switch.
The hardware and software that will be used are the Zodiac FX switches with OpenFlow 1.3 and the SDN controller software OpedDayLight. The SDN controller OpenDayLight is going to be on version 0.8.4 Oxygen-SR4 and the following recommended packages and features [19]: odl-restconf, odl-mdsal-apidocs, odl-l2switch-switch, delux, feature-openflow, and feature-openflowplugin. Restconf is used to communicate with the controller and mdsal-apidocs gives restconf a Graphical tree structure, usable for navigation of configuration files on the controller [19]. l2switch-switch is a packet handler, host tracker and more, that installs flows on switches based on the given network traffic [20]. The L2Switch feature makes the SDN Flow Table Update Rate (SDN-FTUR) experiment possible since it adds the flows for the random mac address as soon as the host is detected. Delux is a web hosted Graphical User Interface (GUI) [19]. Feature-openflow and feature-openflowplugin adds support for the OpenFlow protocol to the controller. The two topologies that are being used can be seen in Figure7.1 and 7.2. This combination gives the best network performance and most reliable results from the experiments tested above.
7.2 Measurement script
A python script was made to automate performance measurements with ping and iperf. The script uses ping to get latency to a host. iperf is used in two ways, TCP and UDP. iperf TCP is used to get the max network throughput between hosts and iperf UDP is used to get the amount of packet loss between hosts. The exact attributes and flags of the commands and script can be seen in AppendixA.
(SDN-FTUR). This script can be seen in Appendix B. The script uses two functions and a stopwatch, the first function is enabling the interface logically, then pinging in a loop until a successful ping has arrived. The script prints the time it took between these two events.
7.3 Performance metrics
The metrics that are used to evaluate the performance include latency, jitter, packet loss, throughput, and SDN-FTUR between network hosts in an SDN network. These metrics give a good overview of how the network performs and for which applications can be used. Latency and throughput have been chosen for measuring performance metrics related to office network use, e.g., email, web browsing and file sharing. Latency, jitter, and packet loss have been chosen as parameters that are crucial for more critical applications, e.g., real-time applications, streaming video, and Voice over IP (VoIP). SDN-FTUR has been chosen to see how long it takes to add a new host to the network. These metrics will be presenting a good overview of how usable a network is. The metrics that we are going to use are explained below.
7.3.1 Latency
Latency will be measured by the ping program. The ping program measures a RTT, thus dividing the measured value into two gives approximately the one-way latency. As the measurement in the RTT, the one-way latency is not accurate as each way may not be the same as the return way. Moreover, the Network Time Protocol (NTP) or Precision Time Protocol (PTP) are not used to make the experiments simpler, and to eliminate extra overhead traffic that must be made to keep accurate clocks. This decision is also done because of the Zodiac FX switch, as this switch is only meant for research and not commercial networks. The Zodiac FX have some small problems, especially with packet loss which will make the more accurate PTP not work optimally.
7.3.2 Jitter
Jitter will be measured in two ways, the first way is to measure from the latency results, a maximum and minimum ”one-way” latency will be used to calculate the difference and that will be the jitter measurement. The second way will be performed by using iperf UDP test. This test gives out UDP jitter. This calculation is done by the RFC 1889 [21] specification. This jitter measurement is done by the server receiving a 64bit timestamp in the UDP packet. The server computes the relative transmit time as the server receives the clients time stamp. This jitter measurement can be done with the server and client not having synced clocks.
7.3.3 Packet loss
Packet loss will be measured from the iperf UDP test. 100mb of UDP data roughly contains 81200 packets that will be sent over a 10 second period and a lost/total received datagrams get reported from iperf. This data is then used to calculate the packet loss. The raw data is going to be used, this means lost/total datagrams, this is because of iperf only prints packet loss with no decimals.
7.3.4 Throughput
Throughput will be measured with iperf TCP test. To measure the throughput a long enough time needs to be selected, this is because of how TCP works. These results will be presented as MBits/sec, this prefix was chosen because the switch ports on the Zodiac FX switch are 100 MBits/sec.
7.3.5 SDN Flow Table Update Rate (SDN-FTUR)
SDN-FTUR is the time that it takes a new host to enter the SDN network and have communications with another host on the network. This will be measured with a script that enables the network interface on a host (will be turned off logically when physically connected to the switch), starts a stopwatch and measures until a successful ping has been made. This measurement will be done on a functioning SDN network but with a host that has zero flows. For doing multiple test in a row, the host will change its MAC addresses between test.
8
Results
In this section, we present the results from the experiments conducted during the thesis work. The experimental results are presented in a series of graphs and their descriptions showing the measured values of SDN-FTUR, latency, jitter, throughput, and packet loss. The graphs show minimum, maximum, and average of the results. The graphs will be two-dimensional graphs with, test samples being shown on the axis of abscissas (y-axis) and the axis of ordinates (x-axis) presents the measured values, e.g., latency, for each of the samples on the axis.
The first experiment is the baseline, with both topologies depicted in Figure7.1 and
7.2. The one switch experiment is described in Section8.1, and the two switch experiment is described in Section8.2.
The second experiment is cloud-based SDN, hosted on Microsoft Azure in EU-West while the test equipment is in Sweden. This experiment is also conducted with both topologies seen in Figure7.1 and7.2. The one switch experiment is described in Section
8.3, and the two switch experiment is described in Section 8.4.
The third experiment is cloud-based SDN, hosted on Microsoft Azure in US-East where again the test equipment is in Sweden. This experiment is also with both topologies seen in Figure7.1and 7.2. The one switch experiment is described in Section 8.5, and the two switch experiment is described in Section8.6.
8.1 Baseline one switch Locally hosted SDN
This section presents the results of the locally hosted SDN controller with the topology shown in Figure7.1. The SDN-FTUR of locally hosted SDN for a new host had an average time of 1.005293s. The results can be seen in Figure 8.1. The graph has a function of latency in seconds over the number of samples, depicted in its y- and x-axis, respectively. The results from this experiment had a low variation resulting in a relatively consistent graph. A small variation in the results is expected due to the way the script measured the time. With this, the average of the graph represents the majority in the SDN-FTUR. The SDN-FTUR had a minimum time of 1.005293s and a maximum time of 1.026648s. Which is a low variation.
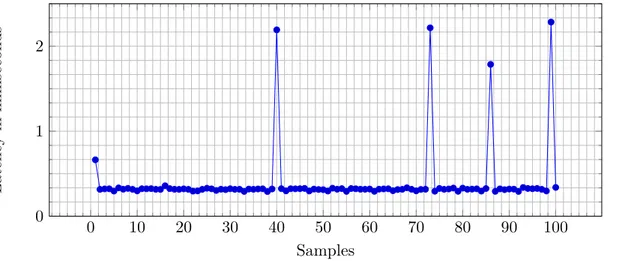
The results of the latency experiment gave an average latency of 0.80552ms. The results can be seen in Figure8.2. The graph has a function of latency in milliseconds over the number of samples, depicted in its y- and x-axis, respectively. The results from the latency experiment gave a few numbers of spikes with an otherwise relatively consistent graph. A small number of spikes are normal behaviour on real networking equipment. The latency experiment had a minimum latency of 0.263ms and a maximum latency of 11.884ms.
The jitter can be calculated from the latency experiment with the result of 11.621ms. The results of the UDP jitter experiment gave an average jitter of 0.5497ms. The results can be seen in Figure8.3. The graph has a function of jitter in milliseconds over the number of samples, depicted in its y- and x-axis, respectively. The results from the UDP jitter has a similar looking graph as the latency, with a few numbers of spikes and otherwise even jitter value. This is also normal behaviour on a real network. The UDP Jitter experiment had a minimum jitter of 0.357ms and a maximum jitter of 4.868ms.
The results of the TCP throughput experiment gave an average bandwidth of 85.119 MBits/sec. The results can be seen in Figure8.4. The graph has a function of bandwidth in megabits per seconds over the number of samples, depicted in its y- and x-axis, respectively. The results from the TCP throughput gave a quite big variation, which is due to the hardware and the same issue can be seen in the packet loss experiment see Figure8.5. The Zodiac FX is not designed for high switching speeds and low error rates like commercial switches. The Zodiac FX is only a research and learning oriented switch. With these results, we are only going to look at the variation gap of throughput and packet loss, to evaluate if the performance is getting better or worse. The TCP throughput experiment had a minimum bandwidth of 60 MBits/sec and a maximum bandwidth of 94.1 MBits/sec.
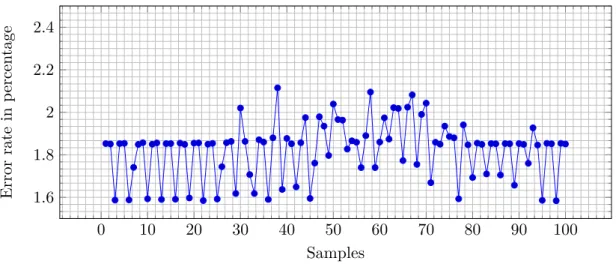
Finally, the packet loss results of the UDP packet loss experiment gave an average packet loss of 1.821866%. The results can be seen in Figure8.5. The graph has a function of packet loss in percentage over the number of samples, depicted in its y- and x-axis, respectively. The UDP packet loss experiment had a minimum packet loss of 1.584% and a maximum packet loss of 2.115%.
0 10 20 30 40 50 60 70 80 90 100 1 1.01 1.02 1.03 1.04 Samples SDN-FTUR in seconds
Figure 8.1: Baseline one switch topology: SDN-FTUR
0 10 20 30 40 50 60 70 80 90 100 0 5 10 Samples Latency in milliseconds
Figure 8.2: Baseline one switch topology: Latency (One way)
0 10 20 30 40 50 60 70 80 90 100 0 2 4 6 Samples UDP Jitter in milliseconds
0 10 20 30 40 50 60 70 80 90 100 60 80 100 Samples Throughput in MBits/sec
Figure 8.4: Baseline one switch topology: Throughput (TCP)
0 10 20 30 40 50 60 70 80 90 100 1.6 1.8 2 2.2 2.4 Samples Error rate in p ercen tage
8.2 Baseline two switches Locally hosted SDN
This section presents the results of the locally hosted SDN controller with the topology shown in Figure7.2. The SDN-FTUR of locally hosted SDN for a new host had an average time of 1.011706s. The results can be seen in Figure 8.6. The graph has a function of latency in seconds over the number of samples, depicted in its y- and x-axis, respectively. The results from this experiment had a low variation resulting in a relatively consistent graph. It also had a slight increase in latency over baseline with one switch, these results can be seen in Figure8.1, this is due to another switch needing to acquire flows from the SDN controller. The small variation in the results is expected due to the way the script measured the time. With this, the average of the graph represents the majority in the SDN-FTUR. The SDN-FTUR had a minimum time of 1.005198s and a maximum time of 1.038466s. Which is a low variation.
The results of the latency experiment gave an average latency of 0.39161ms. The results can be seen in Figure8.7. The graph has a function of latency in milliseconds over the number of samples, depicted in its y- and x-axis, respectively. The results from the latency experiment gave a few numbers of spikes with an otherwise relatively consistent graph. But these results were better than baseline one switch results seen in Figure8.2. This is most likely due to the test being done not on VM. A small number of spikes are normal behavior on real networking equipment. The latency experiment had a minimum latency of 0.29ms and a maximum latency of 2.284ms.
The jitter can be calculated from the latency experiment with the result of 1.994ms. This is much lower than baseline one switch because of lower latency spikes. The results of the UDP jitter experiment gave an average jitter of 0.56734ms. The results can be seen in Figure8.8. The graph has a function of jitter in milliseconds over the number of samples, depicted in its y- and x-axis, respectively. The results from the UDP jitter has a similar looking graph as the latency, with a few numbers of spikes and otherwise even jitter value. These results are similar to the one switch baseline seen in Figure8.3. This is also normal behaviour on a real network. The UDP Jitter experiment had a minimum jitter of 0.378ms and a maximum jitter of 5.51ms.
The results of the TCP throughput experiment gave an average bandwidth of 80.793 MBits/sec. The results can be seen in Figure8.9. The graph has a function of bandwidth in megabits per seconds over the number of samples, depicted in its y- and x-axis, respectively. The results look similar to the baseline one switch seen in Figure8.4, with a quite large variation in throughput. But the results have a similar maximum, minimum and average values to the one switch baseline. The TCP throughput experiment had a minimum bandwidth of 55.5 MBits/sec and a maximum bandwidth of 87.9 MBits/sec.
Finally, the packet loss results of the UDP packet loss experiment gave an average packet loss of 3.528932%. The results can be seen in Figure8.10. The graph has a function of packet loss in percentage over the number of samples, depicted in its y- and x-axis, respectively. These results are almost double of the baseline one switch seen in Figure8.5. This was expected from this hardware and is likely the reason for the roughly 5MBits/sec lower throughput of the TCP throughput test. The UDP packet loss experiment had a minimum packet loss of 3.173% and a maximum packet loss of 3.747%.
0 10 20 30 40 50 60 70 80 90 100 1 1.01 1.02 1.03 1.04 Samples SDN-FTUR in seconds
Figure 8.6: Baseline two switches topology: SDN-FTUR
0 10 20 30 40 50 60 70 80 90 100 0 1 2 Samples Latency in milliseconds
Figure 8.7: Baseline two switches topology: Latency (One way)
0 10 20 30 40 50 60 70 80 90 100 0 2 4 6 Samples UDP Jitter in milliseconds
0 10 20 30 40 50 60 70 80 90 100 60 80 100 Samples Throughput in MBits/sec
Figure 8.9: Baseline two switches topology: Throughput (TCP)
0 10 20 30 40 50 60 70 80 90 100 3 3.2 3.4 3.6 3.8 4 Samples Error rate in p ercen tage
8.3 Microsoft Azure EU-West one switch Cloud hosted SDN
This section presents the results of the cloud-based SDN on Microsoft Azure EU-West with the topology shown in Figure7.1. Latency from the client to controller was an average of 36.917ms RTT. The full results of latency to Azure for this experiment can be seen in Figure8.11.
The SDN-FTUR of cloud-hosted SDN for a new host had an average time of 1.010916s. The results can be seen in Figure8.12. The results from this experiment had a low variation resulting in a relatively consistent graph. A small variation in the results is expected due to the way the script measured the time. With this, the average of the graph represents the majority in the SDN-FTUR. The SDN-FTUR had a minimum time of 1.005815s and a maximum time of 1.037404s.
The results of the latency experiment gave an average latency of 0.257582ms. The results can be seen in Figure8.13. The results from the latency experiment did not have any spikes during the run time of the experiment resulting in a lower average then baseline with one switch. The minimum latency seen was 0.229ms and a maximum latency of 0.2815ms.
The jitter can be calculated from the latency experiment with the result of 0.0525ms. This is lower than the baseline because this latency experiment did not have any big spikes in latency like the baseline had seen in Figure8.2 compared to this latency seen Figure
8.13. The results of the UDP jitter experiment gave an average jitter of 0.51865ms. The results can be seen in Figure8.14. The UDP jitter experiment looks similar to the baseline with a few numbers of spikes and an otherwise even jitter across the experiment. The UDP Jitter experiment had a minimum jitter of 0.208ms and a maximum jitter of 5.408ms.
The results of the TCP throughput experiment gave an average bandwidth of 87.2 MBits/sec. The results can be seen in Figure 8.15. During the run time of the TCP throughput experiment we had higher minimum throughput of 68.9 MBits/sec but lower max throughput at 91.8 MBits/sec then during baseline one switch. The results show an overall higher average compered to baseline one switch.
The packet loss results of the UDP packet loss experiment gave an average packet loss of 1.766%. The packet loss experiment had the same style of the graph with a lot of fluctuation in a pattern. This pattern is likely a hardware related function. This pattern and the full results can be seen in Figure8.16. The UDP packet loss experiment had a minimum packet loss of 1.588% and a maximum packet loss of 1.862%.
0 10 20 30 40 50 60 70 80 90 100 40 50 60 Samples Dela y to serv er in millisec on ds
0 10 20 30 40 50 60 70 80 90 100 1 1.01 1.02 1.03 1.04 Samples SDN-FTUR in seconds
Figure 8.12: Microsoft Azure EU-West one switch topology: SDN-FTUR
0 10 20 30 40 50 60 70 80 90 100 0.2 0.25 0.3 0.35 0.4 Test results Latency in milliseconds
Figure 8.13: Microsoft Azure EU-West one switch topology: Latency (One way)
0 10 20 30 40 50 60 70 80 90 100 0 2 4 6 UDP Jitter in milliseconds
0 10 20 30 40 50 60 70 80 90 100 60 80 100 Test results Throughput in MBits/sec
Figure 8.15: Microsoft Azure EU-West one switch topology: Throughput (TCP)
0 10 20 30 40 50 60 70 80 90 100 1.6 1.8 2 2.2 2.4 Test result Error rate in p ercen tage
8.4 Microsoft Azure EU-West two switches Cloud hosted SDN
This section presents the results of the cloud-based SDN on Microsoft Azure EU-West with the topology shown in Figure7.2. Latency from the client to controller was an average of 28.453ms RTT. The full results of latency to Azure for this experiment can be seen in Figure8.17.
The SDN-FTUR of cloud-hosted SDN for a new host had an average time of 1.01442619s. The results can be seen in Figure8.18. The results from this experiment had more spikes than the baseline. A small variation in the results is expected due to the way the script measured the time. With this, the average of the graph represents the majority in the SDN-FTUR. The SDN-FTUR had a minimum time of 1.007056s and a maximum time of 1.038098s.
The results of the latency experiment gave an average latency of 0.496715 ms. The results can be seen in Figure8.19. The results from the latency experiment did have some spikes but a consistent latency. The minimum latency seen was 0.29 ms and a maximum latency of 9.3585 ms.
The jitter can be calculated from the latency experiment with the result of 9.0685ms. The results of the UDP jitter experiment gave an average jitter of 0.5579ms. The results can be seen in Figure8.20. The UDP jitter experiment looks similar to the baseline with a few numbers of spikes and an otherwise even jitter across the experiment. The UDP Jitter experiment had a minimum jitter of 0.436ms and a maximum jitter of 5.211ms.
The results of the TCP throughput experiment gave an average bandwidth of 77.4 MBits/sec. The results can be seen in Figure 8.21. During the run time of the TCP throughput experiment had a minimum throughput of 57.4 MBits/sec and a maximum throughput of 88.1 MBits/sec.
The packet loss results of the UDP packet loss experiment gave an average packet loss of 3.534%. The packet loss experiment had the same style of the graph with a lot of fluctuation in a pattern. This pattern is likely a hardware related function. This pattern and the full results can be seen in Figure8.22. The UDP packet loss experiment had a minimum packet loss of 3.433% and a maximum packet loss of 3.712%.
0 10 20 30 40 50 60 70 80 90 100 28 29 30 31 Samples Dela y to serv er in millisec on ds
0 10 20 30 40 50 60 70 80 90 100 1 1.01 1.02 1.03 1.04 Samples SDN-FTUR in seconds
Figure 8.18: Microsoft Azure EU-West two switches topology: SDN-FTUR
0 10 20 30 40 50 60 70 80 90 100 0 2 4 6 8 10 Test results Latency in milliseconds
Figure 8.19: Microsoft Azure EU-West two switches topology: Latency (One way)
0 10 20 30 40 50 60 70 80 90 100 0 2 4 6 Samples UDP Jitter in milliseconds
0 10 20 30 40 50 60 70 80 90 100 60 80 100 Samples Throughput in MBits/sec
Figure 8.21: Microsoft Azure EU-West two switches topology: Throughput (TCP)
0 10 20 30 40 50 60 70 80 90 100 3.4 3.6 3.8 Samples Error rate in p ercen tage
8.5 Microsoft Azure US-East one switch Cloud hosted SDN
This section presents the results of the cloud-based SDN on Microsoft Azure US-East with the topology shown in Figure7.1. Latency from the client to controller was an average of 114.24ms RTT. The full results of latency to Azure for this experiment can be seen in Figure8.23.
The SDN-FTUR of cloud-hosted SDN for a new host had an average time of 1.01067204s. The results can be seen in Figure8.24. The result of the SDN-FTUR experiment resulted in a consistent graph with some spike with close to that of the baseline and Azure EU-West. The SDN-FTUR had a minimum time of 1.006003s and a maximum time of 1.033269s.
The results of the latency experiment gave an average latency of 0.253455ms. The results can be seen in Figure8.25. The results from the latency experiment did not have any spikes during the run time of the experiment resulting in a lower average then baseline with one switch. The minimum latency seen was 0.222ms and a maximum latency of 0.269ms.
The jitter can be calculated from the latency experiment with the result of 0.047ms. This is lower than the baseline seen in Figure8.2 and Azure EU-West seen in Figure8.13
because of no spikes in latency during run time. The results of the UDP jitter experiment gave an average jitter of 0.56337ms. The results can be seen in Figure8.26. The UDP Jitter experiment had a minimum jitter of 0.221ms and a maximum jitter of 5.005ms.
The results of the TCP throughput experiment gave an average bandwidth of 88.3 MBits/sec. The results can be seen in Figure 8.27. During the run time of the TCP throughput experiment, we had a minimum throughput of 69.7 MBits/sec and maximum throughput of 92.2 MBits/sec.
The packet loss results of the UDP packet loss experiment gave an average packet loss of 1.76321%. The full results can be seen in Figure8.28. The experiment had the same style and fluctuation as baseline and Azure EU-West. The UDP packet loss experiment had a minimum packet loss of 1.584% and a maximum packet loss of 1.858%.
0 10 20 30 40 50 60 70 80 90 100 114 116 118 120 122 Samples Dela y to serv er in milliseconds
0 10 20 30 40 50 60 70 80 90 100 1 1.01 1.02 1.03 1.04 Samples SDN-FTUR in seconds
Figure 8.24: Microsoft Azure US-East one switch topology: SDN-FTUR
0 10 20 30 40 50 60 70 80 90 100 0.2 0.25 0.3 0.35 0.4 Test results Latency in milliseconds
Figure 8.25: Microsoft Azure US-East one switch topology: Latency (One way)
0 10 20 30 40 50 60 70 80 90 100 0 2 4 6 UDP Jitter in milliseconds
0 10 20 30 40 50 60 70 80 90 100 60 80 100 Test results Throughput in MBits/sec
Figure 8.27: Microsoft Azure US-East one switch topology: Throughput (TCP)
0 10 20 30 40 50 60 70 80 90 100 1.6 1.8 2 Test result Error rate in p ercen tage
8.6 Microsoft Azure US-East two switches Cloud hosted SDN
This section presents the results of the cloud-based SDN on Microsoft Azure US-East with the topology shown in Figure7.2. Latency from the client to controller was an average of 112.57ms RTT. The full results of latency to Azure for this experiment can be seen in Figure8.17.
The SDN-FTUR of cloud-hosted SDN for a new host had an average time of 1.01180409s. The results can be seen in Figure 8.30. The results gave a few spikes but a very consistent graph similar to both baseline and Azure EU-West. The SDN-FTUR had a minimum time of 1.005304s and a maximum time of 1.031607s.
The results of the latency experiment gave an average latency of 1.061145 ms. The results can be seen in Figure8.31. The results from the latency experiment did have some spikes but a consistent latency. The minimum latency seen was 0.246 ms and a maximum latency of 22.4115 ms.
The jitter can be calculated from the latency experiment and a jitter result of 22.1655ms. This was higher due to a higher spike then baseline and Azure EU-West. The results of the UDP jitter experiment gave an average jitter of 0.5452ms. The results can be seen in Figure8.32. The UDP jitter experiment looks similar to the baseline and Azure EU-West with a few numbers of spikes and an otherwise even jitter across the experiment. The UDP Jitter experiment had a minimum jitter of 0.196ms and a maximum jitter of 4.984ms.
The results of the TCP throughput experiment gave an average bandwidth of 81.903 MBits/sec. The results can be seen in Figure8.33. The TCP throughput experiment had a minimum throughput of 31.4 MBits/sec and a maximum throughput of 89.4 MBits/sec.
The packet loss results of the UDP packet loss experiment gave an average packet loss of 3.51969%. The full results can be seen in Figure8.34. The experiment had the same style and fluctuation as baseline and Azure EU-West. The UDP packet loss experiment had a minimum packet loss of 3.173% and a maximum packet loss of 3.715%.
0 10 20 30 40 50 60 70 80 90 100 115 120 Samples Dela y to serv er in millisec on ds
0 10 20 30 40 50 60 70 80 90 100 1 1.01 1.02 1.03 1.04 Samples SDN-FTUR in seconds
Figure 8.30: Microsoft Azure US-East two switches topology: SDN-FTUR
0 10 20 30 40 50 60 70 80 90 100 0 10 20 Test results Latency in milliseconds
Figure 8.31: Microsoft Azure US-East two switches topology: Latency (One way)
0 10 20 30 40 50 60 70 80 90 100 0 2 4 Samples UDP Jitter in milliseconds
0 10 20 30 40 50 60 70 80 90 100 40 60 80 100 Samples Throughput in MBits/sec
Figure 8.33: Microsoft Azure US-East two switches topology: Throughput (TCP)
0 10 20 30 40 50 60 70 80 90 100 3 3.2 3.4 3.6 3.8 Samples Error rate in p ercen tage
9
Discussion
Most of the performance metrics do not seem to be influenced by SDN, like latency, throughput, and packet loss. These metrics seem to be switch related, and not affected by the SDN network. The results from both baseline and Microsoft Azure’s different locations gave similar results.
SDN-FTUR provided results that were close, on all scenarios both local and cloud. These close results from SDN-FTUR were at first not expected because of the latency to the server of the cloud-based controllers. We expected the results to scale with the latency to the server. The reason for the better than expected result seems to be related to the feature L2Switch and OpenDaylight’s proactive flow creation. But to be sure more testing and experimentation would be required, with more accurate clocks on all point on the network including the switch. Since no timestamps are available from the switch we can not get an accurate read on processing time and hop time.
The latency and UDP jitter results from both baseline and cloud were similar, with only a few spikes increasing the average latency/jitter. This was also expected once our understanding of how OpenDayLight and L2Switch create flows. The same with low variation between baseline and cloud can be seen in throughput and packet loss. But results from the TCP throughput was surprising that it never reached 100 MBits/sec. The results were also varying a lot and in a large span, from 60 MBits/sec to 90 MBits/sec. These results are directly related to the switches hardware and the switching capacity. The packet loss was surprisingly high on all experiments, in both baseline and cloud. This was directly related to the hardware not being made for production networks and high switching capacity. The packet loss made an interesting pattern with a couple high and lower packet loss then repeating in a pattern. This pattern seems to be directly related to the switches cache memory and not the speed of the UDP packets. As the first few tests were sent at 80-90 MBits/sec and had the same packet loss as later test that sent at 4 MBits/sec. This pattern in throughput can be seen in Figure9.1. The graph has two plots the first one in blue squares being UDP throughput and the second one in red diamonds being the packet loss measured in percentage. The Figure shows that even when the host sends UDP packets at 90MBits/sec the packet loss is roughly the same as when the host sends UDP packet at 4 MBits/sec.
0 5 10 15 20 25 0 10 20 30 40 50 60 70 80 90 100 Samples UDP Through put in MBits/sec 0 5 10 15 20 25 1.5 1.55 1.6 1.65 1.7 1.75 1.8 1.85 1.9 1.95 2 UDP P ac k et loss in %
UDP Throughput in MBits/sec UDP Packet loss in %
Figure 9.1: Microsoft Azure US-East one switch topology: UDP Throughput compered to packet loss
The results show that SDN as a cloud service does not significantly affect the network performance. These results will answer the research questions which was: How much does the performance of the SDN network differ if the SDN controller is placed on a cloud provider instead of locally? and how does the use of different cloud location affect the network performance of an SDN network?
The physical hardware is one of the problems within this thesis. The low amount of Ethernet ports on the switch makes adding more clients to the experiments a problem. Using multiple switches with the packet loss in the 1.75% range per switch makes it hard to make a larger topology that works. Also, a large topology with this packet loss would make most tests have a large variation.
Security features, traffic shaping, and monitoring would be interesting to see how SDN handles and how cloud-based SDN handles it. These were not tested because of time and lack of hardware. Traffic shaping, and monitoring prefers a larger topology to see the impact, and security needs more hosts. Also, it would be interesting to measure SDN routing, with an SDN capable router or an SDN capable layer 3 switch. These questions could not be answered in this thesis for a lack of time and hardware.
With the previous work done on these topics on network performance in SDN network. Basu et al. [5] conducted cloud-based SDN testing but on mininet and testing of different
switches like Basu might give more interesting results but was not doable with the available hardware. Future work should contain a lager topology to show how it would affect cloud based SDN. Asadollahi and Goswami [17] conducted experiments on SDN performance on a different amount of host. This experiment also was done on mininet with different SDN controllers. This experiment was done with 6 switches and a varying amount of host. We only did experiments on two hosts and no real network bottleneck to overcome. These points of more hosts, lager topology, and bottlenecks in the network topology should also be interesting future work to answer on real hardware with cloud hosted SDN.
10
Conclusions
The experiments were done on two topologies. One topology with one SDN switch and the other topology with two SDN switches hooked up in series with one host on each switch. These topologies can be seen in Figure7.1and7.2 respectively. All experiments used two Linux hosts and the SDN controller ran OpenDayLight version 0.8.4 Oxygen-SR4 with OpenFlow 1.3. The cloud provider used was Microsoft Azure and was tested on two physical locations, EU-East, and US-West as our network were located in Sweden. The switches were Zodiac FX, and the host was Linux machines running Ubuntu 18.04 LTS. The SDN controller’s OS were Ubuntu Server 18.04 LTS. All of the performance metrics were collected with python3 scrips running the Linux performance tools iperf and ping. The scripts were design in a way to make collection of a larger number of samples easier. These python scripts can be seen in Appendix Aand B.
In conclusion, the network performance in the tested scenarios was not affected by the cloud provider or the cloud location. The scenarios are as following: using one or two Zodiac FX switches, OpenDayLight’s proactive flow creation, and a switching capacity of 200 MBits/sec. With this, we saw no significant network performance difference in the cloud location or locally hosted SDN. The network performance metrics tested in this thesis were: TCP throughput, latency (one way), jitter (from ICMP and UDP), and packet loss. The last performance metric tested was the time it takes to add a new host to the SDN network, we called this metric SDN-FTUR (SDN Flow Table Update Rate). The main reason for the equivalent results seems to be OpenDayLight’s L2Switch feature creating proactive flows. This answers both our research questions. One, how much does the performance of the SDN network differ if the SDN controller is placed on a cloud provider instead of locally? Two, how does the use of different cloud locations affect the network performance of an SDN network?
One limitation with this thesis was the hardware. The Zodiac FX switch could not reach 100 MBits/sec as specified in the technical specifications. Also, the switch had a high packet loss in the 1.6% to 1.9% range per switch. All network equipment has some packet loss and packet dropping from queues. But the Zodiac FX has an above average packet loss. With this, a small topology had to be set up. As a larger topology with multiple switches would result in high packet loss and more unstable throughput.
But, with these results and the limitation of the hardware, we could still see that SDN as a cloud service is doable with the right SDN controller. But SDN is still a bit away from being production ready and the same can be said about cheaper SDN hardware.
11
Future Work
These tests should be done with real production SDN hardware to get better real-world performance metrics. This is because of the limited functionality of the Zodiac FX switches. A bigger network with more switches and more host should also be tested and can give a more real-world performance metrics. Layer 3 routing on SDN would also be interesting future work as none of the thesis presented here in Section3and our thesis takes on this point.
As SDN is not fully production ready and a limited amount of hardware available with OpenFlow and SDN capabilities, especially in lower price range make it more interesting to see how enterprise-grade hardware with OpenFlow perform.
References
[1] N. Feamster, J. Rexford, and E. Zegura, “The road to sdn: An intellectual history of programmable networks”, ACM SIGCOMM Computer Communication Review, vol. 44, no. 2, pp. 87–98, 2014.
[2] O. Santos and J. Stuppi, CCNA Security 200-260: official cert guide. Cisco Press, 2015, p. 264.
[3] F. Hu, Q. Hao, and K. Bao, “A survey on software-defined network and openflow: From concept to implementation”, IEEE Communications Surveys Tutorials, vol. 16, no. 4, pp. 2181–2206, Fourthquarter 2014.
[4] sdx Central, What is software defined networking (sdn)? definition, [Online]. Available:
https : / / www . sdxcentral . com / sdn / network - virtualization / definitions / what-is-naas/. [Accessed: Jan 29, 2019].
[5] K. Basu, M. Younas, A. W. W. Tow, and F. Ball, “Performance comparison of a sdn network between cloud-based and locally hosted sdn controllers”, in 2018 IEEE Fourth International Conference on Big Data Computing Service and Applications (BigDataService), March 2018, pp. 49–55.
[6] sdx Central, What is openflow? definition and how it relates to sdn, [Online]. Available:
https://www.sdxcentral.com/sdn/definitions/what-is-openflow/. [Accessed
Dec. 10, 2018].
[7] S. Asadollahi and B. Goswami, “Experimenting with scalability of floodlight con-troller in software defined networks”, in 2017 International Conference on Electrical, Electronics, Communication, Computer, and Optimization Techniques (ICEECCOT), December 2017, pp. 288–292.
[8] S. Rowshanrad, V. Abdi, and M. Keshtgari, “Performance evaluation of sdn con-trollers: Floodlight and opendaylight”, International Islamic University Malaysia Engineering Journal, vol. 17, no. 2, pp. 47, 57, 2016-11-01.
[9] OpenDayLight, Platform overview, [Online]. Available: https://www.opendaylight.
org/what-we-do/odl-platform-overview/. [Accessed: Feb 05, 2019].
[10] IBM, What is cloud computing?, [Online]. Available: https://www.ibm.com/cloud/
learn/what-is-cloud-computing. [Accessed: Dec 10, 2018].
[11] K. A. Jamsa, Cloud computing, eng. Burlington, Mass.: Jones & Bartlett Learning, 2013.
[12] B. Rogier, Measuring network performance: Links between latency, throughput and packet loss, Jul, 16. 2016. [Online]. Available:https://accedian.com/enterprises/ blog / measuring - network - performance - latency - throughput - packet - loss/. [Accessed: Feb 05, 2019].
[13] M. Aparna and M. Reza, “Throughput analysis by varying the network size in mobile ad hoc network”, in 2011 International Conference on Computational Intelligence and Communication Networks, October 2011, pp. 737–739.
[14] V. Popeskic, What is jitter in networking?, Oct, 25. 2016. [Online]. Available: https:
[17] S. Asadollahi and B. Goswami, “Experimenting with scalability of floodlight con-troller in software defined networks”, in 2017 International Conference on Electrical, Electronics, Communication, Computer, and Optimization Techniques (ICEECCOT), December 2017, pp. 288–292.
[18] S. Rowshanrad, V. Abdi, and M. Keshtgari, “Performance evaluation of sdn con-trollers: Floodlight and opendaylight”, 2, vol. 17, November 2016, pp. 47–56. [19] B. Linkletter, Using the opendaylight sdn controller with the mininet network emulator,
Feb, 28. 2016. [Online]. Available: http : / / www . brianlinkletter . com / using
-the- opendaylight- sdn - controller- with- -the- mininet- network - emulator/.
[Accessed: May 16, 2019].
[20] OpenDayLight Project, L2 switch user guide, OpenDayLight Project, 2018.
[21] H. Schulzrinne, “Rtp: A transport protocol for real-time applications”, RFC Editor, RFC 1889, January 1996. [Online]. Available: https://tools.ietf.org/html/ rfc1889.
Appendix A
Python performance, measurements flags and
attributes
The flags and attributes of the network performance commands in the python script can be seen in the ListingA.1. This is only the functions of the script and not the complete script.
import subprocess
import os
ipAddress = "192.168.1.10" # ip address of remote host/server
ttl = "10" # max test length in seconds
iperfErrorMath=[] # raw UDP error rate
iperfUDPjitter=[] # UDP Jitter
PingJitter = 0.0 # Jitter in Ping
def pingOnce(ipAddress, ttl):
#one ping only retuns ms
result = os.popen("ping -qc1 -w" + ttl + " " + ipAddress + " 2>&1 | awk ,→ -F\’/\’ \’END{ print (/^rtt/? $5:\"\") }\’ ").read()
result = float(result) / 2
return float(result)
def findPingJitter (): tmpMax = max(pingDelay) tmpMin = min(pingDelay) PingJitter = tmpMax - tmpMin
print("Jitter: " + str(PingJitter))
def iperfTCP(ipAddress, ttl): tmpVars = []
#one sec iperf formated in 1024 based mega bits
os.system("iperf -c " + ipAddress + " -t "+ ttl +" -f m > tmp.tmp") response = os.popen("tail -1 tmp.tmp").read()
tmpVars = response.split() resultBand = tmpVars[7] return resultBand def iperfUDP(ipAddress): tmpVars = [] resultError = 0.0 os.system("iperf -c " + ipAddress + " -u -b 100m -f m > tmp.tmp") response = os.popen("cat tmp.tmp").read()
tmpVars = response.split()
resultError = round(float(eval(tmpVars[68])), numberOfDecimalsInError)
print("Error rate: " + str(tmpVars[68]))
print("UDP Jitter: " + str(tmpVars[66])) iperfErrorMath.append(str(tmpVars[68])) iperfUDPjitter.append(str(tmpVars[66]))
Appendix B
Python SDN-FTUR script
The python script for measuring the SDN-FTUR can be seen in ListingB.1. This script builds on the network interface being logically down. This can be done with the following set of commands seen in ListingB.2, this Listing also shows how changing MAC addresses was done.
The script measures the time between the interface goes logically up and a successful ping has arrived to a host on the network.
import sys import subprocess import os import datetime hostIPaddress = str(sys.argv[1]) eth = str(sys.argv[2]) result = "" #ifup
ifup = os.popen("sudo ifconfig " + eth + " up").read() ifupTime = str(datetime.datetime.now())
#ping
while not result:
result = os.popen("ping -c 1 -w 1 " + hostIPaddress + " 2>&1 | grep time ,→ = ").read()
#time
doneTime=str(datetime.datetime.now())
print(ifupTime)
print(doneTime)
Listing B.1: SDN-FTUR script sudo ifconfig INTERFACE_NAME down
sudo ifconfig INTERFACE_NAME hw ether NEW_MAC_ADDRESS