O R I G I N A L R E S E A R C H
Open Access
Emergency department crowding and
hospital transformation during COVID-19, a
retrospective, descriptive study of a
university hospital in Stockholm, Sweden
Björn af Ugglas
1,2*, Niclas Skyttberg
3,4, Andreas Wladis
5,6, Therese Djärv
1,2and Martin J. Holzmann
1,2Abstract
Objectives: COVID-19 presents challenges to the emergency care system that could lead to emergency department (ED) crowding. The Huddinge site at the Karolinska university hospital (KH) responded through a rapid transformation of inpatient care capacity together with changing working methods in the ED. The aim is to describe the KH response to the COVID-19 crisis, and how ED crowding, and important input, throughput and output factors for ED crowding developed at KH during a 30-day baseline period followed by the first 60 days of the COVID-19 outbreak in Stockholm Region.
Methods: Different phases in the development of the crisis were described and identified retrospectively based on major events that changed the conditions for the ED. Results were presented for each phase separately. The outcome ED length of stay (ED LOS) was calculated with mean and 95% confidence intervals. Input, throughput, output and demographic factors were described using distributions, proportions and means. Pearson correlation between ED LOS and emergency ward occupancy by phase was estimated with 95% confidence interval.
Results: As new working methods were introduced between phase 2 and 3, ED LOS declined from mean (95% CI) 386 (373–399) minutes to 307 (297–317). Imaging proportion was reduced from 29 to 18% and admission rate increased from 34 to 43%. Correlation (95% CI) between emergency ward occupancy and ED LOS by phase was 0.94 (0.55–0.99). Conclusions: It is possible to avoid ED crowding, even during extreme and quickly changing conditions by leveraging previously known input, throughput and output factors. One key factor was the change in working methods in the ED with higher competence, less diagnostics and increased focus on rapid clinical admission decisions. Another important factor was the reduction in bed occupancy in emergency wards that enabled a timely admission to inpatient care. A key limitation was the retrospective study design.
Keywords: Emergency department, Crowding, COVID-19, Surge capacity, Bed occupancy
© The Author(s). 2020 Open Access This article is licensed under a Creative Commons Attribution 4.0 International License, which permits use, sharing, adaptation, distribution and reproduction in any medium or format, as long as you give appropriate credit to the original author(s) and the source, provide a link to the Creative Commons licence, and indicate if changes were made. The images or other third party material in this article are included in the article's Creative Commons licence, unless indicated otherwise in a credit line to the material. If material is not included in the article's Creative Commons licence and your intended use is not permitted by statutory regulation or exceeds the permitted use, you will need to obtain permission directly from the copyright holder. To view a copy of this licence, visithttp://creativecommons.org/licenses/by/4.0/. The Creative Commons Public Domain Dedication waiver (http://creativecommons.org/publicdomain/zero/1.0/) applies to the data made available in this article, unless otherwise stated in a credit line to the data.
* Correspondence:bjorn.af.ugglas@ki.se
1
Theme of Emergency and Reparative Medicine, Karolinska University Hospital, 141 86 Stockholm, Sweden
2Department of Medicine, Solna, Karolinska Institutet, 171 77 Stockholm,
Sweden
Introduction
Background
The COVID-19 outbreak presents large challenges to the emergency care system. The underlying SARS-CoV-2 virus appears highly contagious to both staff and other patients and the resultant disease is potentially deadly, especially for older patients with underlying comorbidi-ties such as active cancer, obesity, coronary artery dis-ease, diabetes and chronic obstructive pulmonary disease [1]. The progress of the disease for patients that require intensive-care can be quick with acute respiratory dis-tress, severe hypoxia, acute renal failure and rapidly de-teriorating vital parameters [2]. Altogether this results in challenges for the emergency department (ED) [3–5] as patients with suspected COVID-19 needs to be sepa-rated from other patients, the staff have to wear protect-ive gear that limit productivity, and vital parameters needs to be re-evaluated with high frequency.
There is a high risk that this increased workload could lead to ED crowding [6] that is known to have a negative impact on patient outcomes [7–9] and the working en-vironment for the staff [10]. A key characteristics of crowding is that when demand exceeds capacity, queues are formed in various part of the system which leads to an extended average ED length of stay (ED LOS) [11– 14]. The emergency care system is complex and it is helpful to use the conceptual model introduced by Asplin et al. that partitions the emergency care system in three main components: input, throughput, and out-put [15]. The input component includes factors that “impact the demand for ED services”. The throughput component is focused on ED internal care processes in-cluding triage, physician assessment, diagnostics and treatment. The output component is focused on factors related to the patient disposition and the ability to timely admit patients to inpatient care or safely discharge to outpatient- or self-care.
Methods
Aim
The aim is to describe how the Huddinge site at the Karolinska university hospital (KH) responded to the COVID-19 crisis, and how ED crowding, and important
input, throughput and output factors for ED crowding developed at KH during a 30-day baseline period followed by the first 60 days of the COVID-19 outbreak in Stockholm Region.
Study design
This is a retrospective descriptive study of KH response to the COVID-19 crisis. In the study, the development of the crisis was divided into six different phases sepa-rated by five major events that changed the conditions for the ED (Fig. 1). The five major events were defined retrospectively by the research team. The first event was when patients with COVID-19 started to arrive at the ED. The next major event was the implementation of new working methods to cope with this. The last three events were based on sudden changes in the inflow of ambulances due to ambulance diversion from other hos-pitals following regional decisions. ED crowding together with important input, throughput and output factors for ED crowding were studied for each phase using existing data from the hospital data warehouse.
Study setting
KH is the southern site at Karolinska university hospital. KH’s assignment is to deliver emergency care, special-ized and in some areas highly specialspecial-ized care in com-bination with research and education. KH has 760 beds and the ED had 53,508 visits in 2019. The ED has a low proportion of non-urgent and non-complex patients as these will be sorted to a co-located ED with imaging capability led by general practitioners. The department for infectious diseases at KH is the largest in the country and the hospital is the primary receiver of patients with suspected highly infectious diseases in the region. The department for perioperative medicine and intensive care is organized in a single organization responsible for intensive care and the operating theatres supporting all surgical specialties with perioperative care. A brand-new operating theatre with 23 operating rooms was just com-pleted at KH and was meant to be inaugurated during the study period. The department of Emergency and In-ternal Medicine manage the ED and the emergency wards. In the last few years there has been a growing
Fig. 1 Overview of major events and the six phases in the study. Timeline with major events, defining the transition between the six phases in the development during the 90-day study period
focus on emergency medicine at KH and there are cur-rently 30 emergency medicine residents in training to become specialists. The ED is mainly staffed with physi-cians from this department and the ED is divided into medical and surgical patient flows. There is a long-term trend at KH with increased ED crowding and boarding. Unpublished data from standard internal reports show that the mean ED LOS for admitted patients increased by 55% from 4.4 h in the year 2013 to 6.8 h in 2019. Detailed description of the six phases in the study Phase 1,“baseline” (Feb 1 to Mar 1)
This phase begins at the start of the study and ends after the winter school holiday. This phase represents a situ-ation where no, or very few suspected COVID-19 pa-tients arrived in the ED.
Phase 2,“Early phase, normal working methods” (Mar 2 – Mar 13)
This phase starts when many in the population of Stockholm return from the winter school holiday. Many families returned from travels to countries where the disease was already widely disseminated, which acceler-ated the spread of the disease in the Stockholm Region. The following week on March 9, a regional decision con-firmed that all patients with suspected COVID-19 should be directed to KH. According to standard proto-col, patients were received in an isolation room where investigations would be completed before it was decided whether to discharge or admit the patient. After a few days, it became evident that this process would not cope with the volumes of patients and new routines and prac-tices were developed. On March 12 at 14:00, the hospital raised the alertness level to level two out of three ac-cording to the Hospital Emergency Operations Plan. This means a partial mobilization of hospital resources and includes cancelling all planned treatments that can wait and the establishment of a Hospital Command Group [16] working according to European/NATO guidelines [17]. During this phase there was a ramp-up of the regional call-center“1177” giving advice on when and where to seek care and the population in Stockholm was asked to always call before seeking care. An online tool for self-triage was also launched. Guidelines for seeking care at the ED’s were strict and patients that did not experience rapid deterioration or had respiratory disorders at rest were directed to self-care [18].
Phase 3,“Intermediary phase, new working methods” (Mar 14– Mar 29)
On March 14, major changes in routines and practices were implemented. These were fine-tuned during the following phases using an agile approach with high pres-ence from first-line management. All patients were now
received in a tent outside the ED staffed by at least a resident physician in emergency medicine, an experi-enced nurse together with a nurse assistant. An initial assessment was performed, and patients were sorted de-pending on if COVID-19 was suspected or not. Patients with suspected COVID-19 that had mild symptoms and did not belong to a high-risk group were referred to the co-located GP-led ED or diverted to self-care and isola-tion at home with instrucisola-tions if the situaisola-tion deterio-rated. Inside, the ED was separated into two equally sized sections where patients with suspected COVID-19 were sorted to one section while all other patients were sorted to the other section. The exception was ortho-paedic patients that were now treated in the elective de-partment during office hours. The inflow was initially much lower in the COVID-19 section, while the other section struggled with maintaining a high patient flow, now with half the number of available ED rooms and fewer resources in relation to the number of patients. Competence in the ED was strengthened as all residents in emergency medicine where called back from external rotations and replaced interns that were instead trans-ferred to the emergency wards. Staffing was reinforced during evenings and nights and the surgical specialist position was now staffed 24/7 instead of only weekdays 10–18. Practices were also changed, after an initial as-sessment and work-up of unstable patients, an early de-cision on admission to inpatient care was made based on basic lab tests, point-of-care blood gases, and the overall clinical picture. Imaging and further diagnostics were kept to a minimum. The early decision to quickly admit patients with suspected COVID-19 to inpatient care without complete diagnostics was enabled by the transformation of one of the emergency wards with 22 single rooms that performed further investigation and diagnostics that in normal cases would have been per-formed in the ED. As soon as a patient had a result on their COVID-19 test they would be transferred to an in-fection ward if positive and to another ward if negative unless they were stable enough to be discharged home. During this phase, the hospital increased the number of beds in the infection wards and started the ramp-up of intensive care capacity. KH was also no longer the pri-mary receiver in the region as in phase 2 and the inflow of patients arriving with ambulance was shared among all of seven hospitals in the region based on geographical segmentation.
Phase 4,“Exponential phase with controlled ambulance inflow” (Mar 30 – Apr 2)
This phase starts with the implementation of a regional decision to rebalance the load across the seven hospitals in the region. In the earlier phases, ambulances were di-rected to the closest hospital, but clustered outbreaks in
some of the suburbs led to a congestion of COVID-19 patients in three of the sevens hospitals in the region. The decision led to an increased inflow of ambulances at KH. During this period, the intensive care capacity was further increased at KH to manage the increased inflow of critically ill patients.
Phase 5,“Exponential phase with extreme ambulance inflow” (Apr 3 – Apr 8)
This phase starts with a regional decision of directing all ambulances with patients showing respiratory symptoms in Region Stockholm towards KH. The rapid build-up of intensive care capacity in KH now enabled the hospital to relieve the other hospitals in the region to handle about 50% of the regional projected patient flow for in-tensive care. Even if there was now available inin-tensive care capacity in the hospital, the large inflow of critically ill patients during a short time-period was extremely challenging for the ED. Due to the impact that the first decision had on KH, a new regional decision was taken April 5 that reduced the ambulance diversion for all pri-ority 1 ambulances, and all ambulances from two of the six other hospitals.
Phase 6,“Plateau, stabilization of inflow” (Apr 8 – Apr 30) This phase starts with a regional decision to further reduce the ambulance inflow to KH back to the level in phase 4 again. The number of new cases and pa-tients admitted into intensive care in the Stockholm region also peaked and reached a plateau at this time [19]. Intensive care capacity was now increased to its planned maximum capacity. During this phase there was a shift in patient flows where many patients who had been cared for in the intensive care units had re-covered enough to come out of the ventilator but were still very weak, many of them suffering from hypoxemia. To care for post-intensive care patients, the capacity of the high-dependency emergency care unit was increased gradually from 6 to 18 beds by closing down other emergency care wards and re-locate the staff. This increased the level of care but reduced the number of available beds.
Variables
As a proxy for the outcome ED crowding we used the mean ED LOS for each phase. Factors potentially impact-ing crowdimpact-ing were grouped into input, throughput and output. Input factors were the number of patient visits and the number of patient visits arriving by emergency medical services (EMS). Throughput factors indicating the share of diagnostics and treatment performed in the ED were the proportion of patient visits that included medical imaging during the ED stay and the proportion of patient visits that resulted in an admission to inpatient care.
Output factors were the bed occupancy level in the gency wards and the number of care episodes at the emer-gency wards, together indicating the available capacity for the ED to admit patients to inpatient care without a final-ized diagnosis. Another output factor was the total hos-pital bed capacity indicating the general ability to admit patients to inpatient care. To provide a view on this, the average number of staffed inpatient beds together with the average number of patients by type of ward, phase and date were presented. The wards were grouped in four cat-egories: intensive care, emergency care, infection, and other wards (excluding pediatric and obstetric wards). Basic demographic information on the distribution of sex and age in intervals < 40, 40–59, 60–79 and 80+ were also presented.
Data sources/measurement
Data used in the study was based on statistics extracted from KH data warehouse. Crosstabs of data were delivered to the research team using Tableau Desktop 2018.3.0 and imported into RStudio 1.1.463 and R version 3.6.1 to cre-ate the table, the analysis of correlations and high-resolution graphs. ED LOS is measured from the first registration at the front desk or in the later stages in the tent outside the ED, until the patient leaves the ED. Bed occupancy is measured as the daily average of observa-tions on number of staffed inpatient beds and number of admitted patients that is registered at each ward. The number of staffed inpatient beds is entered manually by each ward as soon as the status changes. The number of patients in each ward is updated automatically as patients are admitted and discharged in the electronic healthcare records. The Data warehouse stores information on beds and patients with 15 min resolution so each daily average is based on 96 observations.
Statistical methods
For the outcome ED crowding, mean ED LOS was esti-mated with 95% confidence interval for each phase. In-put, throughput and output factors previously known to impact ED crowding together with age and sex were de-scribed for each phase using distributions, means and proportions. Pearson correlations with P-value and 95% confidence intervals where each phase represented a sin-gle observation were estimated between ED LOS and the key input, throughput and output factors. The input tor used was average visits per day, the throughput fac-tor was proportion of imaging performed and the output factor was bed occupancy in the emergency wards. De-velopment of staffed inpatient beds and average number of patients were visualized in line graphs by the type of ward, phase and date.
Results
Participants
In total there were 9754 ED visits during the 90-day study-period from February 1 to April 30. Three hun-dred ninety four visits (4%) were excluded due to miss-ing triage priority while 13 visits (0%) were excluded due to missing information on sex or ED LOS. In total, 9347 visits (96%) were included.
Input factors
Visits per day were similar in the baseline phase 1 (118) and phase 2 (114) but declined in phase 3 (93). In phase 4 and 5 the number of visits increased to 103 and 123. This was mainly due to an increase in the number of EMS arrivals that reached a maximum of 75 in phase 5 compared to 43 in the baseline phase 1. The proportion of EMS arrivals increased to 49% in phase 4 and 61% in phase 5 compared to 37% in the baseline phase 1. Throughput factors
In phase 3, the proportion of patients that had some kind of imaging performed during their ED visit dropped to 18% compared to 32% in the baseline phase 1 and then further to 15 and 11% in the following two phases. Admission to inpatient care developed in the opposite direction with an increase to 43% in phase 3, 48% in phase 4 and 51% in phase 5 compared to 33% in the baseline phase 1 (Table1).
Output factors
Mean bed occupancy in the emergency wards declined to 66% in phase 3 compare to 90% in the baseline phase 1. This was followed by an increase to 71% in phase 4 and 79% in phase 5 before it declined to 70% in phase 6. Emer-gency ward production measured as the mean number of completed care episodes per day increased during phase 2–5 as the lower bed occupancy was offset by a shorter length of stay in the emergency ward (Table1).
The initial intensive care capacity was 10 staffed beds in the baseline phase 1. In phase 3, the extreme expan-sion started, resulting in a maximum of 85 staffed inten-sive care beds during most of phase 6 (Fig.2). Infection ward capacity had a similar but not as dramatic develop-ment (Fig.3). Emergency wards had an initial capacity of around 70 staffed beds in the baseline phase 1. In phase 3, the average number of patients declined, and in phase 6, the number of beds was reduced to 36 as the normal emergency wards were closed and the staff were relo-cated to the more densely staffed high-dependency emergency ward (Fig. 4). The capacity of the remaining wards was around 300 staffed beds during the baseline phase 1. Bed capacity declined during phase 2–3 as staff were reallocated to the emergency, infection and inten-sive care wards. In phase 5, the capacity increased back
to 300 again, but the cyclical weekly variation with lower capacity during the weekends disappeared as wards were refocused from elective care towards caring for COVID-19 or other emergency care patients 24/7 (Fig.5). Outcome
The mean (95% CI) ED LOS was 440 (431–449) minutes at the baseline phase 1 and declined to 386 (373–399) in phase 2 and 307 (297–317) in phase 3. It then increased to 341 (321–360) in phase 4 and 351 (336–366) in phase 5 before again declining to 294 (287–302) minutes in the final phase 6. All phases following the implementa-tion of new working methods in phase 3 had a statisti-cally significant lower mean ED LOS than both the first two phases (Table1).
Correlation between key factors and ED LOS by phase Pearson correlation (95% CI) between mean ED LOS and mean emergency ward bed occupancy for each phase was 0.94 (0.55–0.99) with P = 0.005 (Fig. 6). Re-sults for the other factors were not statistically signifi-cant with Pearson correlation (95% CI) 0.78 (− 0.08– 0.98) with P = 0.06 for mean ED LOS and mean visits per day by phase and Pearson correlation (95% CI) 0.71 (− 0.24–0.97) with P = 0.11 for mean ED LOS and pro-portion of imaging performed by phase.
Discussion
In this retrospective, descriptive study we analyzed the developments at KH during a 30-day baseline period followed by the first 60 days of the COVID-19 outbreak in Stockholm Region, Sweden. Analysis of 9347 ED visits separated in six phases show that KH was able to im-prove ED crowding despite the challenges posed by COVID-19. ED crowding is a complex, multivariable issue and multiple factors may have impacted this devel-opment. To structure the analysis, we used the concep-tual input, throughput, output model for ED crowding introduced by Asplin et al. [15] The main input factor that increased the demand for ED services was when pa-tients with COVID-19 started to arrive in phase 2. The regional call-center with digital self-triage and a restrict-ive message to the public [18] starting in phase 2 to-gether with the fear of acquiring COVID-19 when seeking care reduced the arrival intensity. In phase 4–6, ambulance diversion from other hospitals increased the pressure on the ED. Positive throughput factors were in-creased resources and higher competence in the ED [13,
20] that were added in phase 3 together with new work-ing methods limitwork-ing diagnostics and aimwork-ing for quick clinical decisions to admit a higher proportion of pa-tients to inpatient care [21,22]. ED LOS was also statis-tically significantly lower in phase 3–6 compared to the phase 1–2 before the change. A key output factor was
the reduced bed occupancy in the emergency wards that improved the service level for the ED. [23] This is in line with the findings of Asplin et al. that “the most fre-quently cited reason for ED crowding is the inability to move admitted patients from the ED to an inpatient bed” [15]. We also identified a statistically significant correlation between mean ED LOS and mean emergency ward occupancy by phase. The decrease in bed occu-pancy was enabled by a transformation of the inpatient care capacity in the hospital, increasing intensive care and infection ward capacity and shifting focus from
specialized elective care to emergency care of COVID-19 patients. The transformation was enabled by an align-ment of priorities across the hospital that was fueled by the general state of emergency and directed by the launch of the hospital command group in phase 2.
A key limitation was the study-design where the re-search group defined the cut-off points and the phases retrospectively. We aimed to define cut-off points as ob-jectively as possible based on major events that impacted the conditions for the ED, but this may still have intro-duced bias. It was however not feasible to conduct a Table 1 Patient visit information by phase
Phase 1 Phase 2 Phase 3 Phase 4 Phase 5 Phase 6
Input Visits
Visits, n 3546 1368 1482 410 613 1928
Days, n 30 12 16 4 5 23
Visits per day, n 118 114 93 103 123 84
EMS arrival
Arrivals per day, n 43 40 36 50 75 47
Proportion, % 37% 35% 39% 49% 61% 56%
Throughput Imaging performed
Yes, % 32% 29% 18% 15% 11% 19%
Admitted to inpatient care
Yes, % 33% 34% 43% 48% 51% 46%
Output
Emergency ward
Bed occupancy, % 90% 85% 66% 71% 79% 70%
Care episodes per day, n 27 31 35 33 42 23
Length of stay, hours 50 48 26 23 24 27
Demographics Sex Male sex, n (%) 1686 (48%) 677 (50%) 749 (51%) 213 (52%) 328 (54%) 1036 (54%) Age < 40, n (%) 975 (28%) 392 (29%) 416 (29%) 95 (24%) 138 (23%) 461 (24%) 40–59, n (%) 897 (26%) 385 (29%) 439 (30%) 138 (35%) 206 (34%) 568 (30%) 60–79, n (%) 1074 (31%) 398 (30%) 438 (30%) 119 (30%) 161 (27%) 598 (32%) 80+, n (%) 515 (15%) 165 (12%) 158 (11%) 46 (12%) 96 (16%) 266 (14%) Missing, n 85 28 31 12 12 35 ED crowding ED LOS Mean, minutes 440 386 307 341 351 294 Confidence interval, 95% 431–449 373–399 297–317 321–360 336–366 287–302
Patient visit information for 9754 ED visit during 90 days from February 1 to April 30 in the Huddinge site of Karolinska University hospital. Variables are grouped in input, throughput and output factors, and by phase in the development
prospective intervention study as we were in a state of emergency, unable to predict how events would unfold and what measures that would be taken. Overall, the quality of the data is high as the study is based on stand-ard reporting variables already existing in the data ware-house that is used daily. This is also a limitation as it narrows down the choice of proxy variables to use for the factors. One limitation is that ED LOS starts when
the patient is registered and not when the patient arrives at the ED. When the arrival intensity is high, there may be additional waiting time before being registered. These situations are likely to be associated with ED crowding and extended ED LOS so high levels of ED LOS may be underestimated. Another limitation is that the number of staffed beds is based on manual input from the wards as capacity changes. This often leads to small delays as
Fig. 2 Intensive care wards - Staffed beds and patients by phase and date. Staffed inpatient beds and number of patients in intensive care wards by date and phase
Fig. 3 Infection wards - Staffed beds and patients by phase and date. Staffed inpatient beds and number of patients in infection wards by date and phase
the priority is to first change the care capacity and then to report it in the system. This may have led to an underestimation of the intensive care capacity in the middle of phase 3. Generalizability may to some aspects be limited as there were some favorable conditions at KH. The hospital had a relatively large part of the staff engaged in research, education and specialized elective care that could be redeployed during the crisis. KH also
have a large operating theatre with many physicians and nurses specialized in anesthesiology and periopera-tive care that could quickly be retrained to work in in-tensive care. In addition to this, the new operating theatre with p and postoperative wards were just re-cently inaugurated and had excellent capabilities to be transformed into intensive care wards for COVID-19 patients.
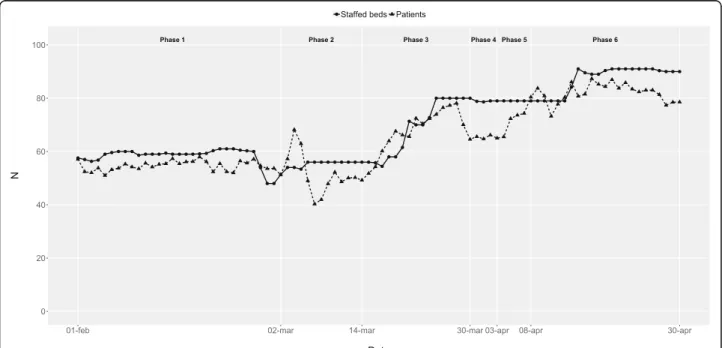
Fig. 4 Emergency wards - Staffed beds and patients by phase and date. Staffed inpatient beds and number of patients in emergency wards by date and phase
Fig. 5 Other wards - Staffed beds and patients by phase and date. Staffed inpatient beds and number of patients in other wards by date and phase
Conclusions
It is possible to avoid ED crowding, even during extreme and quickly changing conditions by leveraging previously known input, throughput and output factors. One key factor was the change in working methods in the ED with higher competence, less diagnostics and increased focus on rapid clinical admission decisions. Another im-portant factor was the reduction in bed occupancy in emergency wards that enabled a timely admission to in-patient care.
Abbreviations
ED:Emergency department; ED LOS: Emergency department length of stay; CI: Confidence interval; KH: Huddinge site at Karolinska University Hospital; EMS: Emergency Medical Services (ambulance or helicopter)
Acknowledgements Not applicable.
Authors’ contributions
BU initiated the study. BU, NS, TD and AW contributed to the design of the study. BU gathered and structured the dataset and performed the analysis. BU drafted the manuscript. NS, MH, TD and AW critically revised the manuscript and approved the manuscript to be submitted. BU affirms that the manuscript is an honest, accurate, and transparent account of the study being reported; that no important aspects of the study have been omitted; and that any discrepancies from the study as planned (and, if relevant, registered) have been explained. BU is the guarantor.
Funding
Mr. af Ugglas is employed at the Karolinska University hospital and was assigned by the Hospital Command Group and Dr. Skyttberg to evaluate the development at KH. Open Access funding provided by Karolinska Institute.
Availability of data and materials
The datasets used and/or analysed during the current study are available from the corresponding author on reasonable request.
Ethics approval and consent to participate
The visit data in the study was extracted with the purpose of quality improvement. Visit data did not include personal identifiers or sensitive information regarding patient health status. The statistical reports were approved for publication by the head of the ED according to the Swedish “Public Access to Information and Secrecy Act” [19] therefore ethical approval was not required.
Consent for publication Not applicable.
Competing interests
Dr. Holzmann reports receiving consultancy honoraria from Idorsia. He holds research positions funded by the Swedish Heart- Lung Foundation (grant 20170804) and the ALF agreement between the Stockholm County Council and Karolinska Institutet (grant 20170686). Dr. Djärv was supported by the Stockholm County Council (clinical research appointment).
Author details
1Theme of Emergency and Reparative Medicine, Karolinska University
Hospital, 141 86 Stockholm, Sweden.2Department of Medicine, Solna,
Karolinska Institutet, 171 77 Stockholm, Sweden.3Department of Medical Informatics, Karolinska University Hospital, 141 86 Stockholm, Sweden.
4Department of Learning, Informatics, Management and Ethics, Karolinska
Institutet, 171 77 Stockholm, Sweden.5Division of Surgery, Orthopaedics and
Oncology, Linköping University Hospital, 581 85 Linköping, Sweden.
6Department of Biomedical and Clinical Sciences, Linköping University, 581
83 Linköping, Sweden.
Received: 20 May 2020 Accepted: 7 October 2020
References
1. Swedish Public Health Agency. Information to risk groups regarding COVID-19.https://www.folkhalsomyndigheten.se/smittskydd-beredskap/utbrott/ aktuella-utbrott/covid-19/rad-och-information-till-riskgrupper/. Acessed 12 Aug 2020.
2. Bhatraju PK, Ghassemieh BJ, Nichols M, Kim R, Jerome KR, Nalla AK, et al. Covid-19 in critically ill patients in the Seattle region - case series. N Engl J Med. 2020;382:2012–22.https://doi.org/10.1056/NEJMoa2004500. 3. Gagliano A, Villani PG, Co FM, Manelli A, Paglia S, Bisagni PAG, et al.
COVID-19 epidemic in the Middle Province of northern Italy: impact, logistics, and Fig. 6 ED LOS by Emergency ward occupancy. Emergency department length of stay (ED LOS) by emergency ward occupancy by phase. Each phase is represented as one observation in the scatterplot
strategy in the first line hospital. Disaster Med Public Health Prep. 2020:1–5. https://doi.org/10.1017/dmp.2020.51.
4. Paganini M, Conti A, Weinstein E, Della Corte F, Ragazzoni L. Translating COVID-19 pandemic surge theory to practice in the emergency department: how to expand structure. Disaster Med Public Health Prep. 2020;27:1–10. https://doi.org/10.1017/dmp.2020.57.
5. Whiteside T, Kane E, Aljohani B, Alsamman M, Pourmand A. Redesigning emergency department operations amidst a viral pandemic. Am J Emerg Med. 2020;38(7):1448–53.https://doi.org/10.1016/j.ajem.2020.04.032. 6. American College of Emergency Physicians (ACEP). Crowding & Boarding
https://www.acep.org/administration/crowding%2D%2Dboarding/Accessed 8 May 2020.
7. Guttmann A, Schull MJ, Vermeulen MJ, Stukel TA. Association between waiting times and short term mortality and hospital admission after departure from emergency department: population based cohort study from Ontario, Canada. BMJ. 2011;342:d2983.https://doi.org/10.1136/bmj. d2983.
8. McCusker J, Vadeboncoeur A, Levesque JF, Ciampi A, Belzile E. Increases in emergency department occupancy are associated with adverse 30-day outcomes. Acad Emerg Med. 2014;21(10):1092–100.https://doi.org/10.1111/ acem.12480.
9. Sun BC, Hsia RY, Weiss RE, et al. Effect of emergency department crowding on outcomes of admitted patients. Ann Emerg Med. 2013;61(6):605–11.e6. https://doi.org/10.1016/j.annemergmed.2012.10.026.
10. Johnston A, Abraham L, Greenslade J, Thom O, Carlstrom E, Wallis M, et al. Review article: staff perception of the emergency department working environment: integrative review of the literature. Emerg Med Australas. 2016;28(1):7–26.https://doi.org/10.1111/1742-6723.12522.
11. Sztrik J. University of Debrecen, Faculty of Informatics. Basic Queueing Theory.https://pdfs.semanticscholar.org/848f/a1f48ad9d3edb24b05667f15 cfc633eb8f69.pdfAccessed 12 Aug 2020.
12. Asplin BR. Measuring crowding: time for a paradigm shift. Acad Emerg Med. 2006;13(4):459–61.https://doi.org/10.1197/j.aem.2006.01.004.
13. Hoot NR, Aronsky D. Systematic review of emergency department crowding: causes, effects, and solutions. Ann Emerg Med. 2008;52(2):126–36. https://doi.org/10.1016/j.annemergmed.2008.03.014.
14. Hwang U, McCarthy ML, Aronsky D, Asplin B, Crane PW, Craven CK, et al. Measures of crowding in the emergency department: a systematic review. Acad Emerg Med. 2011;18(5):527–38.https://doi.org/10.1111/j.1553-2712. 2011.01054.x.
15. Asplin BR, Magid DJ, Rhodes KV, Solberg LI, Lurie N, Camargo CA Jr. A conceptual model of emergency department crowding. Ann Emerg Med. 2003;42(2):173–80.https://doi.org/10.1067/mem.2003.302.
16. Lennquist S. The hospital response. In: Lennquist S, editor. Medical response to major incidents and disasters. Berlin, Heidelberg: Springer Berlin Heidelberg; 2012. p. 77–98.https://doi.org/10.1007/978-3-642-21895-8. 17. Swedish Civil Contingencies Agency. International CEP Handbook 2009 Civil
Emergency Planning in the NATO/EAPC Countries.https://rib.msb.se/filer/ pdf/24677.pdf. Accessed 12 Aug 2020.
18. Swedish Care Guide 1177. Self-care, when and where to seek care.https:// www.1177.se/Stockholm/sa-fungerar-varden/varden-i-stockholms-lan/om-corona/vad-kan-jag-gora-sjalv/. Accessed 8 May 2020.
19. Swedish Public Health Agency. Confirmed cases in Sweden - Daily update. https://www.folkhalsomyndigheten.se/smittskydd-beredskap/utbrott/ aktuella-utbrott/covid-19/bekraftade-fall-i-sverige/. Accessed 8 May 2020. 20. Morley C, Unwin M, Peterson GM, Stankovich J, Kinsman L. Emergency
department crowding: a systematic review of causes, consequences and solutions. PLoS One. 2018;13(8):e0203316.https://doi.org/10.1371/journal. pone.0203316.
21. Derlet RW, Richards JR. Ten solutions for emergency department crowding. West J Emerg Med. 2008;9(1):24–7.
22. McKenna P, Heslin SM, Viccellio P, Mallon WK, Hernandez C, Morley EJ. Emergency department and hospital crowding: causes, consequences, and cures. Clin Exp Emerg Med. 2019;6(3):189–95.https://doi.org/10.15441/ceem.18.022.
23. af Ugglas B, Djärv T, PLS L, Holzmann MJ. Association between hospital bed occupancy and outcomes in emergency care: a cohort study in Stockholm region, Sweden, 2012 to 2016. Ann Emerg Med. 2020;76(2):179–90.https:// doi.org/10.1016/j.annemergmed.2019.11.009.
Publisher’s Note
Springer Nature remains neutral with regard to jurisdictional claims in published maps and institutional affiliations.