J
Ö N K Ö P I N GI
N T E R N A T I O N A LB
U S I N E S SS
C H O O L JÖNKÖPING UNIVERSITYOwnership Dispersion and Capital Structure in Family firms
A study of closed Swedish SMEs
Bachelor thesis within Economics
Authors: Rubecca Duggal 890208-6209 Dinh Tung Giang 850423-096 Tutors: Professor Per-Olof Bjuggren
Ph. D Candidate Louise Nordström Jönköping June 2010
Bachelor Thesis within Economics
Title: Ownership Dispersion and Capital Structure in Family firms: A study of closed Swedish SMEs
Author: Rubecca Duggal 890208-6209
Dinh Tung Giang 850423-096
Tutors: Professor Per-Olof Bjuggren
Ph. D Candidate Louise Nordström
Date: June 2010
Keywords: Capital and ownership struture, Ownership dispersion, Family busi-ness, Family firms, Agency theory
Abstract
Family firms are entities that possess and contribute greatly to all economies worldwide. Seen in Sweden, family firms contribute significantly to the GDP; and their existence is equally prevailing all around Europe as they generate between 35 – 65 percent of all the member states GNP. In the following study we investigate capital structures and ownership dispersion in family firms. Also, we consider the relationship between family firm age and leverage. We apply the Agency- Trade Off - and Ownership dispersion theories to discuss and analyze the situation of closed Swedish family firms. In order to find concluding results, we proceed with a regression between leverage and family business, leverage and family firm age, and leverage and ownership dispersion. Our regression outcomes support the negative relation-ship between leverage and family firm age, and a U- shaped relationrelation-ship between family ownership dispersion and leverage. However, the results do not confirm a relation between leverage and family business.
Earlier studies made in the field have generated differing results; however, there are some studies that are actually in line with our findings.
A database developed by Jönköping International Business School in corporation with Cen-ter of Family EnCen-terprise and Ownership is used to extract a unique dataset of closed Swedish SMEs, from which the statistical interferences are furthered.
Table of Contents
Introduction... 2
Defining Family Firms... 3
Earlier studies ... 4 Purpose... 6 Hypothesis ... 6 Outline 7
Theoretical framework... 8
Agency Theory ... 8Ownership Dispersion and Leverage in Family firms ...11
Trade-Off Theory and Family Firms ...14
Data and Model ... 17
Data Collection Method ...17
Variables ...19
Descriptive statistics and correlation analysis ...20
Model 24
Empirical Results and Analysis ... 26
Conclusion ... 30
References ... 32
Introduction
This section follows a general introduction to the topic of family firms and the implications they face, along with earlier research made in the field. The definition of family firms, purpose and hypotheses formation of the research are also presented.
Family firms have always ascertained an important stance on the global arena. Among the registered companies in Europe, more than 50 percent are organized as family firms; contri-buting both with entrepreneurial skills, innovation and employment. Similarly, between 65 percent - 90 percent of all registered companies in Latin America are operated by families, while in the United States the figure reaches an astonishing proportion of 95 percent. Like-wise, the economic power that these firms gauge is very admirable. Among the member states of the European Union, family firms generate between 35 percent - 65 percent of the GNP. In Sweden, family firms account for over half the private business sector’s contribution to the GDP (The Pricewaterhouse Coopers Family Business Survey 2007/08). However, un-certainties concerning their decision making and governance have been apparent, as their organizational form is very distinct and unique.
Most of the literature and research to be found regarding family firms is not more than ten years old. One reason for this lack of study is that many of these firms are operated as private entities, which makes it difficult to obtain accurate data about their activities (Shanker and Astrachan, 1996). Also, the absence of a common definition of family firms challenges their investigation. Without such a specification, the ability to distinguish family firms from non family ones becomes very difficult, and thus leaves many researchers discouraged.
The organizational challenges that family firms face are thus numerous as they have to care for the family along with establishing a strong commercial and financial stance. Point in fact; one of the most prevailing ambiguities apparent in family firms concerns their financial struc-ture. As many of the family firms are small and medium sized enterprises of closed corpora-tion type (Andersson, Mansi and Reeb, 2003), their access to capital is very limited. Hence the issue of using equity and/or debt as financial source is of great concern.
Being a family owned SME may thus give rise to a quite different set of decisions. The main focuses of the following study is to investigate the relationship between leverage and family
owned businesses. The idea is to explore whether closed family owned SMEs in Sweden tend to rely on more or less debt as compared to non family firms. In addition to this, the relation between ownership dispersion and leverage, and the relation between family firm age and leverage are explored. In the primary case, the family ownership dispersion is predicted to follow a U-shaped curve as suggested by Schulze, Lubatkin and Dino (2003). In the second case, family firm age is expected to exhibit a significant relationship with leverage.
To our astonishment, this is the first study of its kind to be conducted in Sweden although family firms constitute such an important and large part of the economy. One of the distin-guishing attributes of this study is that we conducted it on a firm level rather than industry level, which has been the most common research focus worldwide. This implies that our re-search does not explore different industries such as textiles, forest, plastics and so on, but rather investigates the individual firms and their activities. Also, the data base used for this research has been developed by the university itself (Jönköping International Business School in corporation with the Centre of Family Enterprise and Ownership).
Surprisingly, our findings reveal that family ownership does not have a significant relation with the debt and equity employed. On the contrary, the ownership dispersion in family firms showed a significant link to the chosen leverage, and does follow a curvilinear shape as sug-gested by our hypothesis. Additionally, the age of the firm did also exhibit a significant link to the use of debt.
Defining Family Firms
In previous literature the definition of family firms has been very diverse as it is difficult to generalise and find a consensus for this term. Though, the more usual forms of businesses that have fallen under this category have mostly been characterized as firms controlled and managed by numerous family members from different generations (Shankar and Astrachan, 1996; Lansberg, 1999; Anderson and Reeb, 2003; Gomez-Mejia et al., 2008). For example McConaughy et al. (1998) regard any firm that is managed by the founder or the founder’s family members as a family firm. In the same manner, researchers such as Anderson and Reeb (2003), Cronqvist and Nilsson (2003), Faccio and Lang (2002), La Porta et al. (1999) and others regard any business as a family one as long as the founding family or individual owns a fraction of the company and/or is/are positioned as board member/s. Other researchers
have similarly focused on the importance of involving numerous family members over time in the management or ownership of the firm; Villonga and Amit’s (2006) definition includes different levels and generations of individuals or family ownership. However, Bennedesen et al (2006) and Perez Gonzales (2006b) take this implication even further by focusing on the blood relationship between the founder and the current CEO, and thereby defining family firms as such.
The focus and purpose of the literature/research mentioned above may be different from our paper, and does also originate from different countries, governance regimes, types of compa-nies and so on. However, the common consensus that family firms do differ in their incentive structure is accepted in almost all literature.
In this paper, family ownership is simply based on the information provided by the firms in-vestigated. A database about family ownership in Swedish firms has been developed at Jönköping International Business School from which this unique dataset was extracted. The chosen entities simply had to answer if they considered themselves to be family firms at the time when the study was conducted (2008).
Earlier studies
The concept of family firms as an academic area of study is relatively new. The empirical results obtained from earlier studies differ; some do even generate opposing evidence. For instance, Stulz (1988) argues that firms with controlling block-holders exhibit higher finan-cial leverage due to their unwillingness to dilute ownership further. Accordingly, family firms employ more debt in order to retain the control and thus avert any takeover attempts by out-side shareholders. In a survey conducted by Poutziouris, Sitorus and Chittenden (2002) it is evident how the most prevailing factor that deters family firms from accepting equity financ-ing is their fear of losfinanc-ing control. However, even without the threat of takeover, family firms still seem to prefer debt as they do not want to jeopardize their dominance. Similarly, studies by Kim and Sorensen (1986) depict the relationship between leverage and insider ownership as significant, and so does a study conducted by Harijono (2005).In the latter research, family firms seemed to employ, on average, 20 percent more in debt than non family firms.
On the contrary, researchers such as Daily and Dollinger (1992) oppose this concept, suggest-ing that family firms are more risk averse and thus reluctant to employ debt. Point in fact, a
study conducted by Gallo et al. (2004) showed how both the average leverage and debt ratio was lower among family firms. These results were also statistically significant in their re-search (discussed further in section 2.3).
However, Anderson and Reeb (2003b) explores that insider ownership – either by manager or families - has no impact on capital structure decisions at all. Families employ somewhat less debt (18.42 percent) relative to non family firms (19.34 percent); though, the findings are not significant in their statistical analysis.
So given these mixed and contradicting evidences, we do not have priors on the affects of family ownership on the debt and equity ratio.
The link between firm age and leverage in family businesses has also been investigated in many studies. Romano, Tanewski and Smyrnioos (2000) for example indicate that the source of capital depends, to some extent, on where the firm is in its business life cycle. Newly started or developing firms may find it difficult to raise debt due to their vulnerable position. Accordingly, the owner-managers of small and young firms tend to rather employ” internal finance such as family loans, trade credit and or business angel finance” (Romano et al., 2000). Given this, family firms may be able to acquire debt financing easier as time passes by. They do also take part of an Australian study where the proposition is that family firms at first take loans from family and friends and thereafter, as the firm grows over time, use bank funding against personal assets. Based on this, they test the hypothesis ''The age of a family firm is associated positively with debt'' (Romano et al., 2000), but is not able to ascertain this as statistically significant. Schulze, Lubatkin and Dino (2003) similarly investigate this rela-tionship, and find a significant relation between family firm age and the use of debt.
Schulze et al. (2003) do also investigate a curvilinear relationship between family ownership dispersion and debt. As seen, they find a significant relationship that follows the U- shaped character. Their research is based on a field study where 1464 family firms are investigated.
Purpose
The purpose of this thesis is to analyse the capital structure and ownership dispersion in closed small and medium sized family firms in Sweden.
Hypothesis
Primarily we aim to find whether there are any effects on the level of debt and equity em-ployed by the firm, based on the fact if the firm is family owned or not. This is our first hy-pothesis.
H0: Family ownership has a relation with the debt and equity ratio
H1: Family ownership does not have a relation with the debt and equity ratio
If we reject H0, we could statistically state that whether a firm is owned by a family or not does not influence its financing decisions.
Thereafter, in our second hypothesis we consider if the time a family firm has existed affects its financial decisions.
H0: The age of the family firm and its use of debt have a significant relationship H1: The age of the family firm and its use of debt do not have a significant
relation-ship
If H0is rejected, it implies that time does not matter. The family firm would thus use other criteria when determining its leverage.
Finally, we study the context of family ownership firms deeper in our third hypothesis. Here, we aim to investigate whether ownership dispersion within family firms could have any im-pact on the debt and equity ratio.
H0: The relationship between a family firm’s use of debt and the dispersion of its ownership can be graphed as a U-shaped curve
H1: The relationship between a family firm’s use of debt and the dispersion of its ownership cannot be graphed as a U-shaped curve
If H0is rejected, it implies that there is not a U-shaped relationship between a family firm’s use of debt and their level of ownership dispersion.
Outline
The remaining paper is structured as following. In Section 2 the theoretical perspective is presented, where the Agency Theory, the Trade- Off Theory and Ownership Dispersion is discussed in light of family ownership. Thereafter the Empirical Framework is presented in Section 3, followed by an Analysis and Result presentation in Section 4. Lastly, Section 5 declares the final conclusion of the research.
Theoretical framework
This section explores the Agency Theory, Trade- Off Theory and Ownership Dispersion; all in the context of family ownership. The theories are extracted from both old and new research; contributing with a wider perspective on family firms.
Agency Theory
Jensen and Meckling (1976) developed and argued for the inevitable importance of agency costs within corporate finance. This theory is based upon the presumption of diverging inter-est when ownership and management are separated; more clearly the relationship between a principal (e.g. the shareholders) and the agent (e.g. the manager). The main assumption of this model is that if ownership and management are separated different conflicting interests emerge and create tension; resulting in high agency costs. It is believed that all stakeholders involved choose actions that maximise their own personal utility, even at others' expense. The principal may not be able to monitor the behaviour of the agent, and this in turn will cause the agent to participate in actions that are unknown to the principal. Agency conflicts thus give rise to asymmetric information dilemmas in which all the parties involved do not share simi-lar knowledge.
Accordingly, corporate managers would act in their own interest and seek prerequisites, job security or even direct capture of assets and cash flows. This is the main argument behind the Agency Theory. The ethics of the Free cash flow theory also build upon the agency cost ap-proach. Unless the free cash flow (the cash flow that is available to distribute among the se-curity holders of a corporation) is given back to investors, management has an incentive to destroy firm value through for example perks. This is described in Jensen (1986) as fol-lows:”The problem is how to motivate managers to disgorge the cash rather than investing it below the cost of capital and/or wasting it on organization inefficiencies”. One possible solu-tion to this dilemma is to use debt as a constraint on the manager. This would force the com-pany to limit its spending or perks in order to avoid the risk of default.
In view of the agency theory developed by Jensen and Meckling (1976), family firms are believed to be more efficient where the principal (owner) and agent (management) is one and the same person. This assumption has been so strongly conveyed that family firms have been used as a solid proposition to portray a non conflicting firm with zero agency costs (Ang et
al., 2000). This theory is to a great extent supported by both Anderson and Reeb (2003) and McConaughy (2000) who suggest that the existing incentive structure in family firms create fewer agency conflicts between different claimants. Though, the previous belief that family firms do not bear agency conflicts at all has been proven lacking in several cases as family firms have shown incentive structures that are very unique (Gomez-Meija et al., 2003; Steier, 2003). The conflicts in family firms may arise because of the dispersion of ownership, which creates a conflict between the interest of those who manage a firm- and often own a control-ling interest- and other family owners. Additionally, problems such as entrenched ownership and asymmetric altruism within the family firms may create difficulties (Gomez-Meija et al., 2001; Schulze et al., 2001). The persistence of agency conflicts thus creates asymmetric in-formation, and may lead to the need of monitoring.
Most often family firms operate with private capital, and therefore need to monitor and con-trol the firm they have invested in. Their wealth is strongly linked to the continuation of the firm, and therefore they also have a stronger incentive to monitor than other large sharehold-ers do (Harijono, 2005). This implies that the risk taking behaviour of the family firm is probably different from the non family one (Daily and Dollinger, 1992). As most of the wealth of the family is invested in the company, the risk taking is assumed to be minimized by the employment of less debt. Family firms’ interest also lies in passing their firm as a go-ing concern to the future generations; they consider their firm as an asset to bequeath to the family rather than wealth they can employ today (Casson, 1999; Chami 1999).The survival instinct thus differentiates the family firms and increases their need to minimize risk and align the interest of all stakeholders. The concept of altruism also becomes relevant in rela-tion to family firms as this behaviour emphasizes the positive linkage between family mem-bers happiness (Becker, 1981). It may then enable families to forgo their existing consump-tion for the welfare of their heirs, and also develop a risk averse behaviour where future fam-ily consumption is the main concern rather than pursuing opportunistic investments.
The fact that family firms also face reputation issues does also affect their choice of financial structure. Family owners are often able to develop stable and durable contact with external financing parties because of the long term nature of their firm. For example, family owners may be able to extend individual and strong communication with banks, as their family’s presence allows these interactions to grow over following generations. If the firm would then engage in inappropriate activities, the investors would expect similar behaviour in the future
as by the preceding family members. The firms’ reputation is thus assumed to cause a longer lasting economic stance for the family business than for the non family one where managers and directors are changed more frequently. Hence, if family firms aim at maintaining a bene-ficial reputation, their access and ability to gain financial support may be easier than for non family firms (Anderson and Reeb, 2001).
It is tempting to conclude that family firms have less conflicts and are thus able to minimize agency costs as the decisions are taken in the best interest of both family and firm. However, contrasting views have suggested that these “firms are plagued by conflicts that can cause them to flounder, if not fail and that they are vulnerable to a form of inertia that can paralyse decision making and threaten firm survival” (Schulze et al., 2003). Also, family firms may employ more debt in order to control the self- interests of the family agents; to limit the nega-tive consequences of altruism within the firm. It is argued that altruism causes parents to in-crease their generosity, which can result in a dilemma where their children free ride (Schulze, Lubatkin, Dino and Bucholtz, 2001). For example, altruism can create a feeling of entitle-ment among family members. They therefore engage in persuading CEOs (usually the leader of the family or a parent) to utilize the resources of the firm to satisfy family members through employment, prerequisites, and privileges that they otherwise would not receive. In order to discipline and avoid the free riding of problem caused by family members, the usage of debt may be more extensive than the agency theory would predict.
Schulze et al. (2001) empirical study suggest that family firms are more difficult to manage because of self control and the dilemma of altruism. They imply that family control insulates the firm from the discipline role of external markets such as corporate control and labour markets. Further, the phenomenon of altruism implies how the agency problem becomes more apparent in family structured firms as the resources are not correctly allocated. As seen, the level of the agency conflict thus becomes a central determinant that affects the capital structure desired by the firm. Gomez-Mejia, Nunez-Nickel and Gutierrez (2001) have simi-larly recognized entrenched ownership and asymmetric altruism as a central dilemma in fam-ily firms. Their empirical research suggest that famfam-ily firms suffer from higher agency costs compared to others as they are often unwilling to fire incompetent family members. The study conducted by Gomez-Mejia et al. (2001) implies how family owned firms in Spain were more reluctant to fire family CEOs. They found that these firms were thus more hesitant to stringently monitor, discipline or fire family members due to their personal relationship.
Ownership Dispersion and Leverage in Family firms
Whereas the boards of public listed firm consist of both inside and outside directors, private family firm’s board consists of the principal owner and some minority shareholders. In many cases the owner is also the founder and CEO of the firm, while the minority shareholders tend to be a part of the close and extended family, from which some may be employed by the firm. As family firms tend to branch into several generations, the family firm-ownership does simi-larly tend to change in a more intervallic and stepwise fashion over a relatively long period of time. In most instances, the shares of the firm are passed on to the children when the owner retires or passes away.
The ownership of family firms can be separated into three different stages of dispersion (Schulze, Lubatkin and Dino, 2003). At the start up phase there is a controlling owner who is the founder and owns most of the shares; or in the case of later generations, the shares are owned by a single individual. Thereafter the firm enters a sibling partnership in which own-ership is distributed in relatively equal proportions among members in a single generation. At last the firm enters the cousin consortium in which the ownership is further fractionalised as it succeeds to include third and later generations.
Schulze et al. (2003) predict that controlling owners of family firms, and in particular the founders, will at the beginning be very motivated to use debt to finance their chosen invest-ments. Due to the lack of access to equity markets, the leverage of the firm may consequently increase substantially as the firm has to develop its establishment. The long term investment behaviour is based on the controlling owner’s expectation frame, and does not necessarily include the expectations of the remaining family (both non shareholders and minority share-holders). The concern of the controlling owner is thus to choose the most appropriate invest-ment alternatives based on the prospects of the market. By time however agency conflicts become apparent as the controlling owner may confuse which incentives that maximise the value of the firm, and which incentives that maximise his or her personal utility along with the family's utility. The existence of negative parental altruism, sense of entitlement from the owner’s children, distinguishing opinion among family members and other issues may then cause the controlling owner to gradually change his or her estate plans. Both family members that are employed by the firm and others who are not may then free ride on the equity of the controlling owner.
When ownership is further dispersed among family members, and the firm enters the sibling partnership stage, the debt financing seems to decline. One of the reasons for this may be that the agency conflicts within the family become too extensive. At this phase, there is still a shareholder with the majority of the shares who often takes on the role as the CEO. However, the principal shareholder (and the CEO) in the sibling partnership is typically neither the ini-tiator of the family firm nor the biological lead of the family. This may result in loss of au-thority and influence for the principal shareholder over the other siblings. The decisions taken by the principal may thus be difficult to employ as all the stakeholders will have different opinions regarding which opportunities to pursue.
Issues mentioned before, such as parental altruism, different interest of the family members involved, sense of entitlement and other phenomenon related to family firms specifically may also become more apparent, and in turn develop a risk and loss averse behaviour within the firm. For example, some of the family members may prefer consumption in the form of pe-cuniary and non pepe-cuniary benefits rather than investments, which will then occur at the cost of forgone beneficial investments. As each sibling try to maximise his or her family’s utility, the conflicts will increase within the firm. The siblings are then more likely to engage in firm politics where vote swapping and hostage taking will lead to a series of compromises, ill will and other conflicts. The result could be a state of paralysis where none of the siblings or the principal is willing to take on more debt and thus risk. At the sibling partnership stage, one could conclude how the siblings will have an increased concern for their respective children and families. They may feel a pressure to sustain or enhance the dividend payout and might become more and more reluctant to risk due to for example their biological age. The result will be reduced debt even when the market situation is believed to be favourable, and the firm may become “bogged down in the types of conflict that cause many family firms to flounder or fail” (Schulze et al., 2003)
When further fractionalising the shareholding the cousin consortium level is reached where ownership is dispersed almost completely, and it is less likely that a single individual owns a controlling part of the firm. The respective members are assumed to realise the influence they have on the future value of their claims, and the concern for the survival of the firm along with avoidance of agency conflicts becomes more apparent. This also implies how the power to authorize is relative equal among the shareholders. Less consumption is preferred, and more focus is placed on the future of each member’s estate, and the possible effects of further
dilution of ownership. In the cousin consortium, the shareholding has most likely already passed to the members of the extended family, from which the majority is not employed by the firm. Their risk preference is thus assumed to be less constrained as they have not overvested in the family firm, and their approach is more comparable to those of institutional in-vestors and others who invest in public firms. Schulze therefore hypothesize that the manag-ers of family firms reaching a cousin consortium are more willing and likely to bear risk and employ debt to pursue appropriate and promising investments. However, one important no-tice is that since there is no liquid market for the private firm’s shares, outside family mem-bers that hold a stake in the firm can only benefit from growth in the earnings, and not from growth in valuation. This may result in the outside owners still preferring consumption, while the inside shareholders whose combined equity holdings usually represent the majority, will continue favouring investments as further dilution will affect their holdings negatively. The main goal “facing the cousin consortium boards of family firms is to invest in growth while maintaining a dividend level that satisfies outside family owners” (Schulze et al., 2003). Schulze concludes that at this stage the greater the ownership dispersion apparent, the more will the board be in favour of growth; and unable to either reduce dividend or issue equity the firm will use debt to fund their growth.
So the hypothesis that Schulze formed was that debt financing will be more preferred when ownership is either concentrated in the hands of a single owner as in the controlling owner
stage, or when it is dispersed in the hands of several shareholders as in the cousin consortium.
Also, the use of debt is minimised when the ownership is divided into relatively equal propor-tions as in the sibling partnership.
Following his conclusions, the subsequent findings were documented:
1. There is a U shaped relationship between the use of debt and ownership dispersion within family firms
2. There is an increased risk that family members that are employed by the firm will develop an incentive to free ride on the equity of the controlling owner.
3. In family firms, outside family shareholders have the incentive to favour consumption instead of investment when ownership becomes more dispersed. In public firms, the
outside shareholders have the incentive to promote investment and growth oriented risk taking.
Trade-Off Theory and Family Firms
The well renowned capital structure theory was first developed by Modigliani and Miller (1958). They succeeded in demonstrating how the value of the firm is solely determined by the investment decisions made, and not affected by the financing policy of the firm. How-ever, this theory was developed on the basis of many constraints and the ceteris paribus con-cept, and may therefore be difficult to apply to the real world. As seen, later research shows how the choice of debt and equity is highly relevant to the firm. Only when relaxing the dif-ferent subsets of Modigliani and Miller's theorem, the importance of capital structure deci-sions can be explored. As seen, one of the most relevant models explored is the Trade-Off Theory (Myers, 2001; Jensen and Meckling, 1976).
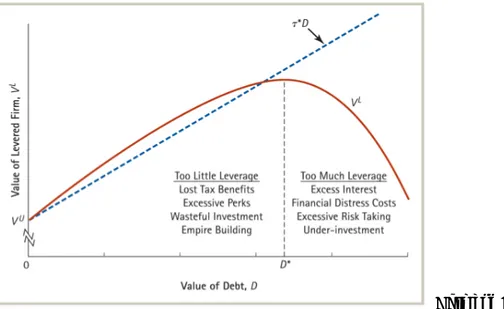
According to this theory, there may be an optimal and targeted level of leverage where the marginal benefit of debt is exactly equivalent to the marginal cost of debt. The Trade- Off theory is thus based on the effects of taxes, agency costs and the costs of financial distress (Romano, Tanewski and Smyrnios, 2000). An important purpose of this theory is to explain why firms are financed partly by debt and partly by equity. The underlying assumption is that when the leverage of the firm increases, there is a Trade- Off that occurs. On the one hand there is a tax advantage enjoyed by the firm, and lower agency cost of equity. However, on the other hand there is an opposing force of financial distress along with higher indebtness that affects the firm.
When first proposed by Kraus and Litzenberger (1973) this theory argued that the firm could continue to borrow up to the point where the marginal benefit of the interest tax shield of additional debt is equal to the marginal cost of financial distress. Suppose the firm is financed totally by equity, and earns 1000 SEK profit. Also, it has to pay back a fixed amount of 200 SEK in dividends to its shareholders, and bears the overall tax of 30 percent. Consequently, it leaves 1000 - (1000*0.3) - 200 = 500 SEK in retained earnings. However, when considering the same firm but with a partial financing through debt, the end scenario becomes different. Assuming that the total interest payment amount to 60 SEK, the retained earnings would sum
up to 1000 - ((1000-60)*0.3) - 200 = 518 SEK. Clearly, the firm would favour debt financing due to the tax advantage related to it.
However, the Trade- Off occurs in the sense that the value of the firm may increase due to tax advantages but the financial position of the firm deteriorates. When this occurs, the firm starts suffering from lost competitiveness; they may have to forgo valuable investments, sell assets or even go bankrupt. The cost of financial distress might be very substantial for firms. This can be seen in the following figure where the Trade- Off Theory is illustrated (Berk and De-Marzo, 2007).
Figure 1: Displaying the Trade- Off between tax advantage and the cost of financial distress
Berk and DeMarzo, 2007 There are several forces that decide upon a firm’s choice of leverage. Some of them may be incentive effects, entrenchment effects and risk aversion (Driffield, Mahambare Pal, 2007). Family firms supposedly have concentrated ownership, and are assumed to mitigate agency conflicts successfully. The higher concentration and aligned incentives might then positively affect the firm’s capital structure. On the contrary, the risk averting behaviour recognized among family firms may lower leverage below the optimum level. According to a study con-ducted by Gallo, Tapies and Cappuyns (2004) both the average leverage and debt ratio was around 48 percent lower in family firms than in non family firms. The lower debt employed by family firms has been recognized in many countries, and the most frequent explanation has been the aversion to financial risk. The resistance of banks and financial institutions to grant loans to certain types of small and medium sized family firms along with bureaucracy
has also been some of the reasons. In light of entrenched ownership within family firms, some propose that it causes an increase in the use of leverage, but grounds its financial posi-tion to deteriorate strongly, while others state that equity is rather used by entrenched owners to avoid risk (King and Santor, 2008).
Data and Model
In order to achieve the purpose of the thesis, empirical tests have been conducted. In this section, we first discuss our data set and the method used to collect it. Then, we present the variables in our model and how we define them. We also perform the descriptive statistics as well as the correlation table. Finally, we introduce our regression model. Motivation of se-lection of variables and limitation of our data will be presented as well.
Data Collection Method
The sample data was extracted from a database comprised of Swedish firms, and created by CeFEO (Centre of Family Enterprise and Ownership) at Jönköping International Business School. The sample was drawn from a population of 270 057 active limited companies in Sweden; resulting in a sample of 2522 active firms. These firms are categorized based on the number of employees according to SCB (The Statistical Central Bureau in Sweden):
Table 3.1: Sample sizes and respective groups
Groups Number of firms in the sample
5-9 622 10-19 359 20-49 242 50-99 391 100-199 205 200-499 250 500-999 216 >1000 237 Sum: 2522
A survey was created and sent out (see Appendix 1 for further information). Of the 2522 firms questioned, 40 percent answered after the 2nd round of send outs. In the survey, we in-quired about the time of incorporation and asked for information about the five largest share-owners. The latter question was defined based on the number of shares the owners hold, as
well as their share of voting power. Since our thesis focus on SMEs, we gathered data from 151 firms in the 50-99 class and from 95 firms in the 100-199 class. We used this to classify the position of SMEs; hence taking the groups in the middle of table 3.1. We were able to find all the yearly financial information and consolidated financial statements of these firms in Amadeus.
Firms with less than three years of balance sheet data were dropped, and public limited com-panies were also dropped. Comcom-panies in which the ownership stake by the five largest share-holders is less than 66.67 percent will not be used, and so will not firms with the leverage ratio of less than zero. We used Mahalanobi’s distance statistics method to detect outliers (Gnanadesikan and Kettenring 1972). At last we created a data sample including 177 obser-vations on both private family and non-family firms. We use this sample data to test the rela-tionship between family business and leverage Another subset, constructed from the large sample, was also produced and included only 78 private family firms. This data was used to test both the hypothesis concerning family firm age and leverage; and the testing of leverage and family ownership dispersion as a U-shaped curve.
Variables
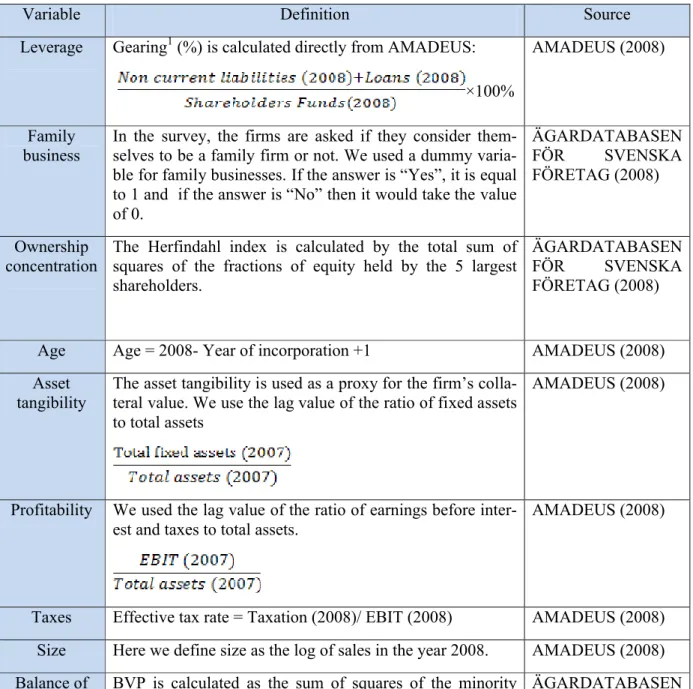
Table 3.2 below describes our variables along with stating their respective sources. Our main focus is on the following important variables: Gearing, Family business, Age, Firm’s sales growth, and Balance of voting power. All of these are measured and analyzed in the subse-quent section along with the rest of the variables.
Table 3.2: Variable definitions and sources
Variable Definition Source
Leverage Gearing1(%) is calculated directly from AMADEUS:
×100%
AMADEUS (2008)
Family
business In the survey, the firms are asked if they consider them-selves to be a family firm or not. We used a dummy varia-ble for family businesses. If the answer is “Yes”, it is equal to 1 and if the answer is “No” then it would take the value of 0.
ÄGARDATABASEN
FÖR SVENSKA
FÖRETAG (2008)
Ownership
concentration The Herfindahl index is calculated by the total sum of squares of the fractions of equity held by the 5 largest shareholders.
ÄGARDATABASEN
FÖR SVENSKA
FÖRETAG (2008)
Age Age = 2008- Year of incorporation +1 AMADEUS (2008)
Asset tangibility
The asset tangibility is used as a proxy for the firm’s colla-teral value. We use the lag value of the ratio of fixed assets to total assets
AMADEUS (2008)
Profitability We used the lag value of the ratio of earnings before inter-est and taxes to total assets.
AMADEUS (2008)
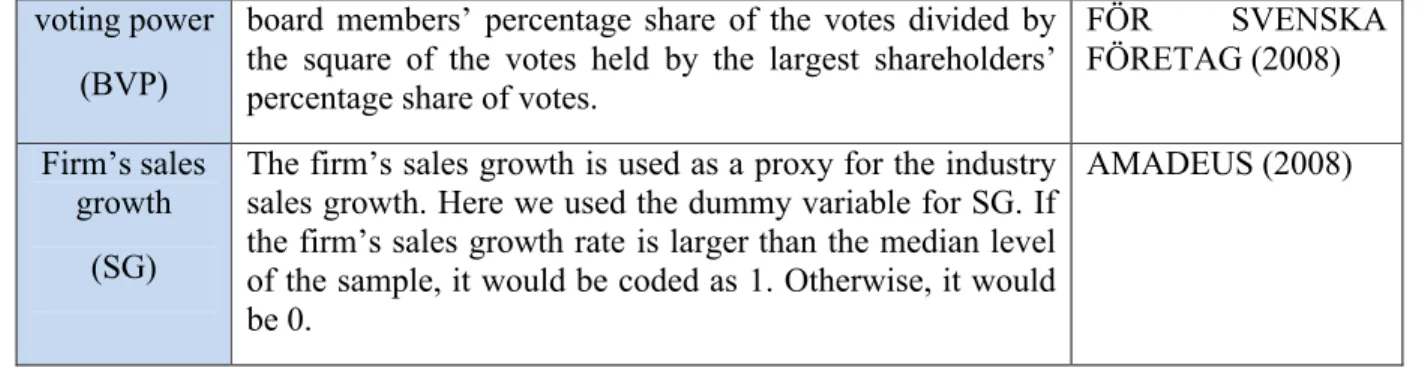
Taxes Effective tax rate = Taxation (2008)/ EBIT (2008) AMADEUS (2008) Size Here we define size as the log of sales in the year 2008. AMADEUS (2008) Balance of BVP is calculated as the sum of squares of the minority ÄGARDATABASEN
voting power (BVP)
board members’ percentage share of the votes divided by the square of the votes held by the largest shareholders’ percentage share of votes.
FÖR SVENSKA
FÖRETAG (2008)
Firm’s sales growth
(SG)
The firm’s sales growth is used as a proxy for the industry sales growth. Here we used the dummy variable for SG. If the firm’s sales growth rate is larger than the median level of the sample, it would be coded as 1. Otherwise, it would be 0.
AMADEUS (2008)
Descriptive statistics and correlation analysis
We calculate the descriptive statistics on the 1stdataset with 177 observations on both family and non-family firms, and the 2nddata set which constitute of 78 family firms only. Following this is the correlation analysis between the variables both in the larger and smaller sample. Clearly, the firms express a high level of ownership concentration (0.8117) even though less than half of them are family firms. Also, Swedish SMEs present an average effective tax rate of 13.3 percent.
Table 3.3: Descriptive statistics for all firms
Descriptive Statistics
Variables Minimum Maximum Median Mean Std. Deviation
Gearing (%) 0 992.41 25.3 89.533 157.042 Family business 0 1 0 0.44 0.497 Ownership concentration 0.0017 1 1 0.8117 0.291 Age 2 131 27 36.60 29.535 Asset tangibility 0.0011 0.9849 0.308 0.343 0.2530 Size 6.2681 8.3621 7.171 7.186 0.3871 Taxes -2.3551 1.0816 0.163 0.133 0.2690 Profitability -0.1660 0.5481 0.133 0.150 0.1110
For more detailed information see Appendix 2. 1 Gearing and leverage are assumed to be the same
Table 3.4: Descriptive statistics for family firms only
Descriptive Statistics
Variable Minimum Maximum Median Mean Std. Deviation
Gearing (%) 0 501.18 39.73 75.83 96.38 BVP 0 3 0 0.409 0.594 BVP_squared 0 9 0 0.516 1.213 Sales growth 0 1 -0.057 0.51 0.503 BVP*Sales growth 0 3.00 0 0.229 0.531 BVP_squared*Sales growth 0 9.00 0 0.331 1.172 Profitability -0.1207 0.49 0.16 0.16 0.091 Asset tangibility 0.0155 0.8961 0.39 0.37 0.225 Taxes -0.4407 0.4401 0.147 0.14 0.131 Size 6.7262 11 9.439 9.42 0.818 Age 2 131 33 38.77 29.50
For more detailed information see Appendix 2
The most notable feature of the family firms is that they have a high level of concentration in voting power (the BVP’s mean is 0.409). On average, family firms tend to have higher meas-ures of profitability, asset tangibility, and size compared to non family firms. However the median level of gearing in family firms is higher than that of the larger sample. They also have a less dispersed gearing ratio with smaller standard deviation. Moreover, their sizes are substantially larger compared to others
Table 3.5: Correlation between the variables in the data consisting of all firms Correlation table Family busi-ness Ownership concentra-tion Profitabi-lity Asset tang-ibility
Taxes Size Age
Family busi-ness 1 -0.171* 0.106 0.097 -0.006 -0.217** 0.058 Ownership concentration -0.171* 1 -0.02 -0.079 -0.05 0.146 0.136 Profitability 0.106 -0.02 1 -0.08 0.164* -0.081 -0.124 Asset tangibi-lity 0.097 -0.079 -0.08 1 -0.211** 0.075 0.094 Taxes -0.006 -0.05 0.164* -0.211** 1 -0.206** -0.055 Size -0.217* * 0.146 -0.081 0.075 -0.206** 1 0.202** Age 0.058 0.136 -0.124 0.094 -0.055 0.202** 1
*Correlation is significant at 0.05 level **Correlation is significant at 0.01 level
From Table 3.5 it is clear that taxes and size are two variables that have a tendency of being correlated with other variables. However, this is not a problem since all the financial va-riables are correlated to some extent; though this may pose a problem of interpreting the ex-planatory powers of these two variables.
Table 3.6: Correlation between the variables in the data consisting only family firms Correlation table BVP BVP_sq uared Sales growth BVP*S ales growth BVP_sq uared* Sales growth Age Asset tangibility Profi- tabili-ty Size Taxes BVP 1 0.883** 0.066 0.762** 0.720** -0.069 0.033 0.14 -0.146 0.214 BVP_squa red 0.883** 1 0.111 0.805** 0.923** 0.06 -0.012 0.043 -0.35 0.139 Sales growth 0.066 0.111 1 0.424** 0.277* -0.133 0.11 0.125 0.105 0.002 BVP*Sales growth 0.762** 0.805** 0.424** 1 0.902** -0.035 0.033 0.153 -0.032 0.135 BVP_squa red*Sales growth 0.720** 0.923** 0.277* 0.902** 1 0.097 -0.043 0.044 0.039 0.105 Age -0.069 0.06 -0.133 -0.035 0.097 1 -0.062 -0.185 0.046 -0.22 Asset tang-ibility 0.033 -0.012 0.11 0.033 -0.043 -0.062 1 0.070 0.098 -0.414** Profitabili-ty 0.14 0.043 0.125 0.153 0.044 -0.185 0.070 1 -0.174 0.25* Size -0.146 -0.35 0.105 -0.032 0.039 0.046 0.098 -0.174 1 -0.118 Taxes 0.214 0.139 0.002 0.135 0.105 -0.22 -0.414** 0.25* -0.118 1
*Correlation is significant at 0.05 level **Correlation is significant at 0.01 level
There are just a few significant correlations in Table 3.6. Those variables relate to BVP_squared and the interaction terms; and these do in turn definitely have some correlation. Also, asset tangibility, taxes and profitability continue to have high degree of correlation.
Model
The ordinary least square (OLS) method is used to estimate the coefficient estimate of the model. Even though we are inspired by the model created by Rajan and Zingales(1995) in the study about international capital structure, we have made some modifications on our own model. It is a “trial and error” process. Specifically, the method of “stepwise selection” is applied to choose the appropriate variable. We also attempt to implement the linear as well as the non- linear models.
This is the model made by Rajan and Zingales (1995):
Leverage= a + β1Tangible Assets + β2 Market to Book Ratio + β3 Log Sales +
β4 Return on Assets + εi
Our first model is an adaption and modification of the model above. We use this model to test the 1stand 2ndhypothesis.
Leverage= β0+ β1Family business + β2 Ownership concentration + β3 Age + β4 Asset
Tangibility + β5 Profitability + β6 Taxes + β7 Size + εi (Model 1)
Two other models will be applied to test the 3rdhypothesis about ownership structure of pri-vate family firms. These models do also test the hypothesis concerning leverage and family firm age. We try to follow Schulze, Lubatkin, and Dino’s field study (2003) in which the re-sult suggested during the periods of market growth, the relationship between the use of debt and dispersion of ownership can be graphed as U-shaped curve. We will first conduct the test without the interaction terms to see the direct effect of ownership structure on the use of debt. Leverage= β0+ β1*BVP+ β2*BVP2+ β3*Age+ β4*Asset tangibility+ β5*Profitability+
We then include interaction terms to see how ownership structure together with sales growth determines the value of leverage. This is the 3rdmodel:
Leverage= β0+ β1*BVP+ β2*BVP2+ β3*BVP*Sales growth+
β4*BVP_squared*Salesgrowth+ β5*Age+ β6*Asset tangibility+
β7*Profitability+ β8*Taxes+ β9*Size+ εi (Model 3)
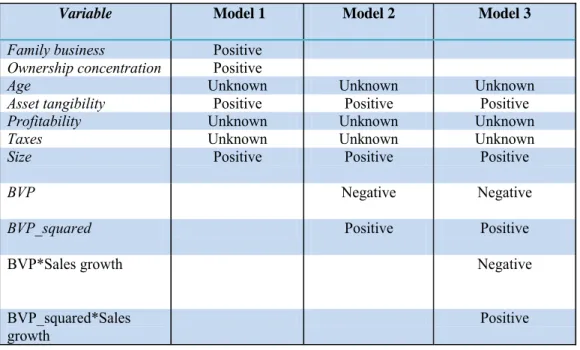
Table 3.7: The expected outcomes of the independent variables in the regression against
Le-verage
Variable Model 1 Model 2 Model 3
Family business Positive
Ownership concentration Positive
Age Unknown Unknown Unknown
Asset tangibility Positive Positive Positive
Profitability Unknown Unknown Unknown
Taxes Unknown Unknown Unknown
Size Positive Positive Positive
BVP Negative Negative
BVP_squared Positive Positive
BVP*Sales growth Negative
BVP_squared*Sales growth
Empirical Results and Analysis
The following section will present the statistical results and analyze the given outcomes. Also, we will state the result of our hypothesis testing.
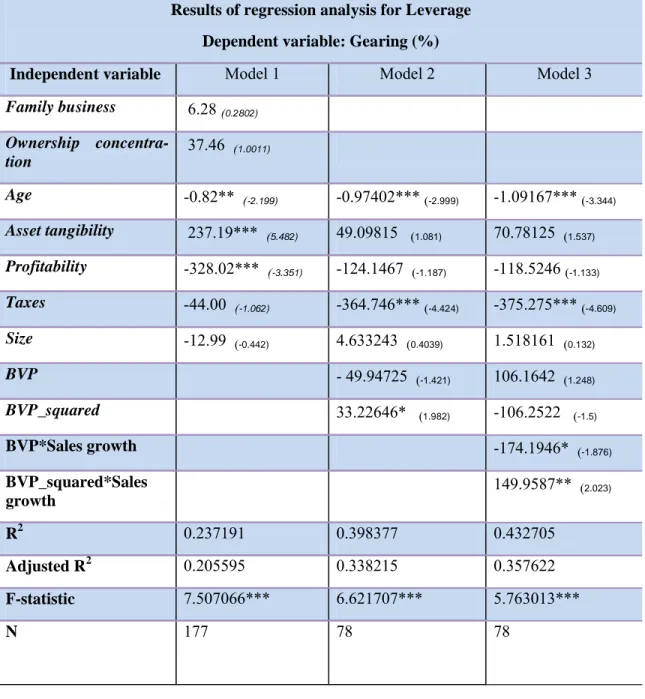
Overall, our models do exhibit a decent R2, which means that they stand for most of the vari-ation apparent in the debt and equity ratio. Moreover, all three F-statistics are significantly different from 0. Therefore, at least some of the variables are possibly significant; hence some of the variables chosen are relevant. We have also conducted the Ramsey RESET Test, White’s Test and Breusch-Godfrey’s Test for misspecification, heteroscedasticity, and auto-correlation respectively in all three models. The results indicate that we do not suffer from the above mentioned problems. All of these results can be viewed in the following Table 4.1. For detailed results of these tests, please see Appendix 2.
Table 4.1: Regression results
Results of regression analysis for Leverage Dependent variable: Gearing (%)
Independent variable Model 1 Model 2 Model 3
Family business 6.28(0.2802) Ownership concentra-tion 37.46 (1.0011) Age -0.82** (-2.199) -0.97402***(-2.999) -1.09167***(-3.344) Asset tangibility 237.19*** (5.482) 49.09815 (1.081) 70.78125 (1.537) Profitability -328.02*** (-3.351) -124.1467 (-1.187) -118.5246(-1.133) Taxes -44.00 (-1.062) -364.746***(-4.424) -375.275***(-4.609) Size -12.99 (-0.442) 4.633243 (0.4039) 1.518161 (0.132) BVP - 49.94725 (-1.421) 106.1642 (1.248) BVP_squared 33.22646* (1.982) -106.2522 (-1.5) BVP*Sales growth -174.1946* (-1.876) BVP_squared*Sales growth 149.9587** (2.023) R2 0.237191 0.398377 0.432705 Adjusted R2 0.205595 0.338215 0.357622 F-statistic 7.507066*** 6.621707*** 5.763013*** N 177 78 78 * p-value ≤ 0.1 ** p-value ≤ 0.05 *** p-value ≤ 0.01
The regression results from Model 1 also illustrate that whether a firm is family owned or not does not have any impact on its financial decisions. This result is consistent with the findings made by Anderson and Reeb (2003b) who also state that insider ownership does not have a significant relation with the financial choices of the firm. Therefore, the first null hypothesis regarding family business and leverage is rejected. Also, the ownership concentration in model 1, surprisingly, could not influence the level of debt that a firm would choose. Asset tangibility on the contrary has a significant and positive impact on leverage; following the prediction of the Trade- Off Theory. Accordingly, the higher the asset tangibility apparent, the more leverage is employed by the firm. Hence, the greater the collateral values in a firm’s total assets, the more capital the debt-holder could repossess in case of non-payment (Jensen and Meckling, 1976). This also implies that the firm will be willing to finance its assets with debt due to the tax shield advantages. However, one could also see that when the profitability of the firm increases, the leverage of the firm falls. Thus, the firm will prefer to employ inter-nally generated cash flows when earnings are higher.
In all models, the most persistent variable is firm age; which proves to be significantly related to the debt and equity ratio over the different contexts. Also, this relation is significantly neg-ative, which implies that as time passes by, a firm would choose to reduce the amount of debt in its financing scheme. This result contradicts the arguments of Romano et al. (2000) who state that debt is positively associated with the family firm age. Indeed they were not able to establish this argument as statistically significant.
This result is also partly consistent with Schulze et al. (2003) who declare that when a firm’s ownership changes from a controlling owner to a sibling partnership, the debt financing de-clines. Hence, when the firm grows further over time and exists between a concentrated own-ership stage and more divided shareholding, the debt financing decreases. The research pro-poses that the owners are more likely to care for their own benefits at the sibling partnership stage, and thus the agency conflicts become more extensive. Dilemmas such as negative pa-rental altruism and differing interest of family members, among others, might become ap-parent, and cause the conflicts within the firm to widen. Demands on a higher level of divi-dend payment may also become evident. As a result, the debt financing falls and the firm de-velops a more risk averse behavior. However, our study does not indicate that the debt fi-nancing increases at some point in time, as Schulze et al. (2003) predict in their U-shaped curve.
At last, one of the most interesting propositions of our thesis was our objective to follow the empirical framework provided by Schulze et al. (2003); to depict the relationship between ownership dispersion and leverage as curvilinear. However, compared to Schulze et al. (2003) we changed our research focus from an industrial level to a firm level. Surprisingly, our results proved that the relationship between ownership dispersion and leverage in family firms could be graphed as a U-shaped curve. Schulze and his colleagues only archived this result in the high growth industry sector. However, we attained this result directly by running the regression without taking into account the effects of market growth. Model 2 describes that the corresponding sign of BVP and BVP_squared do indeed follow the U-shaped curve, even though the former (BVP) is not statistically significant.When including the interaction terms (BVP*Sales growth and BVP_squared*Sales growth) we also obtain a significant re-sult as model 3 indicates.
Our findings can thus be explained by the research developed by Schulze et al. (2003). At first, ownership is assumed to be concentrated, and the level of debt is predicted as higher. However, as ownership is further divided and the firm enters the sibling partnership, the agency conflicts and other difficulties are assumed to position the firm in a conflicting stance. The firm would then choose to reduce debt (BVP show a negative relationship with leverage, although it is not significantly negative). Then, as the ownership fractionalizes further, the firm reaches the cousin consortium level with almost complete dispersion. As each share-holder is assumed to realize the importance of avoiding agency conflicts, the firm develops a more opportunistic behaviour. The aim becomes to satisfy outside shareholders and maintain a convincing growth. Therefore, debt will be preferred again at this stage (BVP_squared ex-hibits a significantly positive relationship with the debt and equity ratio).
Conclusion
Family firms have existed for a long time. Many of the largest companies apparent today are, or have taken, the form of a family firm. Their importance and position on the world market is thus becoming more and more noteworthy. However, the research made in this field has not been equally updated. In the case of our study, it is the first of its kind to be conducted in Sweden. For this reason, we did not have any priors on how family firms actually operated in Sweden, and their relationship with leverage. The purpose of our thesis was therefore to ana-lyse the capital structure and ownership dispersion in closed small and medium sized family firms in Sweden.
When conducting the research, our main concern was the following questions;
Is there a relationship between family ownership and use of debt? Is there a relationship between family firm age and leverage?
Is there a U-shaped relationship between family ownership dispersion and leverage?
In the first case, the result achieved was not significant. Although there are several theories and arguments that propose the relevance of this relationship, our study was not able to as-certain this hypothesis. However, our study was more in line with the findings of Anderson and Reeb (2003b), who point out the non existing relationship between insider ownership and leverage.
Secondly, we found a significantly negative relation between family firm age and leverage. This implies how the firm over time applies less debt. Although it contradicts the arguments of Romano et al. (2000), our findings are partly consistent with the theory of Schulze et al. (2003). However, it is difficult to analyse and truly verify this relationship as our data is very limited.
At last, the hypothesis concerning ownership dispersion and leverage did exhibit a significant result; thus agreeing with the U- shaped relation suggested by Schulze et al. (2003). Although our study included a smaller and more limited data set, and was conducted on a firm level, the result was identical to those of Schulze et al. (2003).
Overall, the results we achieved were very satisfactory. However, we are fully aware of the fact that our study has a limited data set along with a definition that complicates its compari-son to other studies. For instance, our definition was purely based on the perception and re-sponse of the investigated firms, who simply had to state whether they believed themselves to be a family firm or not. We also understand that by excluding firms with ownership stake by the five largest shareholders being less than 66.67 percent, we risk losing some family firm observations. Nevertheless, we had to make a trade off, since this would prevent a bias esti-mate of ownership dispersion later on when calculating the Herfindahl index.
For further research we therefore propose that a quantitative definition should be imple-mented were the percentage of family ownership is analysed. Also, the significant results achieved concerning family firm age and leverage could be further explored to see whether it may follow a curved relation when considering a longer time span as seen in Schulze et al (2003). Also, the earlier research may not have considered closed firms only, but might have included public listed firms as well. This does affect their result as the access and relation to debt and equity changes a lot when a firm is either closed or open. Therefore, a similar study could be conducted were public firms are included, which would facilitate the comparison to other studies.
References
Anderson and Reeb. 2005. “Founding-family ownership and firm performance: evidence from the S&P 500.” Journal of Finance , 58: 1301–1328
Anderson and Reeb. 2003b. “ Founding-Family Ownership, Corporate Diversification, and Firm Leverage.” The Journal of Law and Economics, 46:2
Anderson et al., Anderson , Mansi and Reeb. 2003. “Founding family ownership and the agency cost of debt.” Journal of Financial Economics, 68 (2): 263–285
Ang J.S., Cole R.A., and Lin J.W. 2000. “Agency costs and ownership structure.” Journal of
Finance 55: 81-106.
Becker G.S. 1981.” A treatise on family”, Harvard University Press: Cambridge MA.
Bennedsen et al., Bennedsen, M., Nielson K.M., Perez-Gonzalez F., Wolfenzon D. 2006. “Inside the family firm: The role of families in succession decisions and performance.” Quarterly
Journal of Economics.
Berk J., and DeMarzo P.B. 2007. Corporate Finance. Pearson International Edition Casson M. 1999. “ The economics of the family firm.” Scandinavian Economic History Review, 47: 10-23.
Chami R. 1999. “What’s different about family business?” Unpublished working paper. Univer-sity of Notre Dame and the International Monetary Fund, Indiana and Washington DC.
Cronqvist and Nilsson. 2003 .”Agency costs of controlling minority shareholders.” Journal of
Financial and Quantitative Analysis, 38:. 695–719.
Daily C. M. and Dollinger M. J. 1992. “An empirical examination of ownership structure in family and professionally managed firms.” Family Business Review, 5: 117–136.
Driffield N., Mahambare V., and Pal S. 2007.” How does ownership structure affect capital structure and firm value? Recent evidence from East Asia.” The Economics of Transition, 15(3): 535
Faccio and Lang. 2002 .”The ultimate ownership of Western European corporations.” Journal
of Financial Economics, 65 (3):365–395
Gallo M., Tapies J., and Cappuyns K. 2004. “Comparison of family and nonfamily business: Financial logic and personal preferences.” Family Business Review, 17 (4): 303-318
Gnanadesikan R., and Kettenring J.R. 1972. “Robust estimates, residuals, and outlier detec-tion with multiresponse data.” Biometrics, 28: 81-124.
Gomez-Mejia et al., Gomez-Mejia L.R., Haynes K., Nunez-Nickel M., Jacobson K., Moyano-Fuentes J. 2008. “Family owned firms: Risk loving or risk Averse?” Administrative
Science Quarterly.
Gomez-Mejia L.R., Nunez-Nickel M., Gutierrez I. 2001.” The role of family ties in agency contact.” Academy of Management Journal, 44: 81-95.
Harijono .2005.” Capital Structure Decisions of Australian Family Controlled Firms.” Monash
University
Jensen, M. (1986) “Agency Costs of Free Cash Flow, Corporate Finance, and Takeovers.” The
American Economic Review, Vol. 76 No. 2
Jensen M. and Meckling W. 1976. ”Theory of the firm: Managerial behaviour, agency costs, and ownership structure.”Journal of Financial Economics ,3: 305-360.
Kim S. W. and Sorensen E. H. 1986. “Evidence on the Impact of the Agency Costs of Debt on Corporate Debt Policy.” Journal of Financial and Quantitative Analysis, 21: 131-144
King M.R. and Santor E. 2008. “Family values: Ownership structure, performance and capital structure of Canadian firms.” Journal of Banking & Finance 32.11: 2423
Kraus and Litzenberger R.H.1973. “A State-Preference Model of Optimal Financial Leve-rage.” Journal of Finance, 911-922
Lansberg I. 1999.” Succeeding generations.” Harvard Business School Press, Boston, MA La Porta et al., La Porta R., Lopez-de-Silanes F. and Shleifer A. 1999.”Corporate owner-ship around the world.” Journal of Finance 54:471–517
McConaughy et al., McConaughy D.L., Walker M.C., Henderson Jr. G.V and Mishra C.S. 1998. “Founding family controlled firms: efficiency and value.” Review of Financial Economics, 7:1–19
McConaughy D. (2000). “Family CEOs vs. nonfamily CEOs in the family controlled firm: An examination of the level and sensitivity of pay to performance” Family Business Review, 13(2): 121– 131.
Modigliani F. and Miler M. 1958.” The cost of capital, corporation finance, and the theory of investment.”American Economic Review 48; 261-297
Myers S. 2001.”Capital structure.” Journal of Economic Perspectives 15, 81-102.
Perez-Gonzalez F. 2006.” Inherited control and firm performance.” American Economic Review, 96:1559–1588
Poutziouris P., Sitorus S. and Chittenden F. 2002.”The Financial Affairs of Family Companies.”Manchester Business School.
Rajan and Zingales. 1995.”What do we know about capital structure? Some evidence from international data.”Journal of Finance, 50: 1421–1460
Romano C. A., Tanewski G.A. and Smyrnios K.X. 2000.” Capital structure decision making: A model for family business.” Journal of business venturing 16.3: 285
Schulze, Lubatkin M.H. and Dino R.N. 2003. “Exploring the agency consequences of own-ership dispersion among the directors of private family firms.” Academy of Management Journal, 46:179–194
Schulze , Lubatkin, M.H., Dino R.N. and Buchholtz A.K. 2003. “Agency Relationships in Family Firms: Theory and Evidence.” Organization Science, 12.2 : 99-116
Shanker M.C. and Astrachan J.H. 1996.”Myths and realities: family businesses’ contribution to US economy — A framework for assessing family business statistics.” Family Business Review , 9: 107–123.
Steier L. 2003. “Variants of agency contracts in family-financed ventures as a continuum of fa-miliar altruistic and market rationalities” Journal of Business Venturing ,18: 597-618.
Stulz R.M.1988. “Managerial control of voting rights. Financing policies and the market corpo-rate control.” Journal of Financial Economics, 20:25-54.
Villalonga and Amit R. 2006b. “How do family ownership, management and control affect firm value?” Journal of Financial Economics 80: 385–417
Online Sources
Making a difference. The PricewaterhouseCoopers Family Business Survey 2007/08 (retrieved 2010-01-11)
Appendices
Appendix 1: Data of variables
Företagets namn: Företaget grundades år: 1. Äga-rens namn:Ägarandel: Röstandel: Anser Ni att företaget är ett familjeföre-tag: 1977 NEJ 1901 NEJ 1962 JA 1949 NEJ 1968 JA 1988 JA
Appendix 1: Data of variables continued
Company Name Year Gearing (%) Total as-sets th EUR Fixed assets th EUR Sales th EUR Taxation th EUR EBIT th EUR 2008 0 6 944 2 616 17 696 47 2 778 2008 0 6 944 2 616 17 696 47 2 778 2007 0 7 292 2 518 18 766 323 2 646 2006 1,74 6 932 2 315 14 653 228 2 102 2005 5,48 5 843 2 311 12 356 192 1 654 2004 11,82 6 040 2 577 12 170 127 1 331 2003 27,6 5 605 2 263 10 853 103 1 024 2002 19,07 4 991 1 836 9 258 5 781 2001 43,02 5 264 2 128 8 876 2 435 2000 36,79 5 832 2 471 8 872 3 55 1999 17,83 5 358 2 446 8 952 48 791 2008 0 3 834 1 174 6 969 159 147 2008 0 3 834 1 174 6 969 159 147 2007 0,03 7 971 2 015 9 818 66 327 2006 0,03 8 242 2 424 10 587 586 1 013 2005 0,03 8 890 4 066 12 597 176 958 2004 5,39 9 291 4 526 13 103 186 1 120 2002 21,39 8 933 5 020 12 339 46 842 2001 31,12 8 879 5 448 12 102 0 426 2000 39,21 9 933 6 263 13 052 176 1 644 1999 58,79 9 387 6 092 12 730 0 734Appendix 2: Results from statistical software
Model 1:1. Descriptive statistics and correlation table
a. Descriptive statistics
b. Correlation table
AGE ASSETTAN GEARING OWNERSHI PROFITAB SIZE TAXES Mean 36.59887 0.343695 89.53384 0.811721 0.150007 7.186883 0.133404 Median 27.00000 0.308786 25.30000 1.000000 0.133823 7.171902 0.163158 Maximum 131.0000 0.984948 992.4100 1.000000 0.548117 8.362058 1.081633 Minimum 2.000000 0.001095 0.000000 0.001741 -0.165971 6.268110 -2.355084 Std. Dev. 0.253023 157.0429 0.292000 0.111023 0.387167 0.269031 Skewness 0.995483 0.563612 3.133844 -1.092647 0.802964 0.223592 -4.335233 Kurtosis 3.178820 2.457885 14.77474 2.562757 5.384731 2.913214 43.98899 Jarque-Bera 29.46994 11.53835 1312.222 36.62934 60.96137 1.530346 12945.15 Probability 0.000000 0.003122 0.000000 0.000000 0.000000 0.465253 0.000000 Sum 6478.000 60.83402 15847.49 143.6746 26.55126 1272.078 23.61250 Sum Sq. Dev. 153528.5 11.26759 4340597. 15.00642 2.169411 26.38213 12.73847 Observations 177 177 177 177 177 177 177
AGE ASSETTAN GEARING OWNERSHI PROFITAB SIZE TAXES AGE 1.000000 0.093586 -0.081724 0.136191 -0.124239 0.202369 -0.055371 ASSETTAN 0.093586 1.000000 0.396142 -0.078796 -0.079838 0.074949 -0.211058 GEARING -0.081724 0.396142 1.000000 0.014577 -0.250947 0.005495 -0.182513 OWNERSHI 0.136191 -0.078796 0.014577 1.000000 -0.001545 0.145791 -0.050459 PROFITAB -0.124239 -0.079838 -0.250947 -0.001545 1.000000 -0.081217 0.163852 SIZE 0.202369 0.074949 0.005495 0.145791 -0.081217 1.000000 -0.205764 TAXES -0.055371 -0.211058 -0.182513 -0.050459 0.163852 -0.205764 1.000000
2. Model specification and parameter estimation
Dependent Variable: GEARING Method: Least Squares
Date: 05/25/10 Time: 05:02 Sample: 1 177
Included observations: 177
Variable Coefficient Std. Error t-Statistic Prob.
C 153.4451 212.6268 0.721664 0.4715 FAMILYBU 6.283754 22.42308 0.280236 0.7796 OWNERSHI 37.46392 37.41942 1.001189 0.3182 PROFITAB -328.0256 97.85996 -3.351990 0.0010 SIZE -12.99733 29.36007 -0.442687 0.6586 TAXES -44.00204 41.41438 -1.062482 0.2895 AGE -0.822152 0.373868 -2.199045 0.0292 ASSETTAN 237.1906 43.26346 5.482471 0.0000
R-squared 0.237191 Mean dependent var 89.53384 Adjusted R-squared 0.205595 S.D. dependent var 157.0429 S.E. of regression 139.9714 Akaike info criterion 12.76490 Sum squared resid 3311048. Schwarz criterion 12.90845 Log likelihood -1121.693 F-statistic 7.507066 Durbin-Watson stat 2.130865 Prob(F-statistic) 0.000000
3. Diagnostic testing
a. Ramsey RESET test to check for model misspecification
H0: No model misspecification H1: Model misspecification
Ramsey RESET Test:
F-statistic 1.299095 Probability 0.270987 Log likelihood ratio 9.236904 Probability 0.160687
b. White’s Test checks for heteroscedasticity
H0: No heteroscedasticity H1: Heteroscedasticity
White Heteroskedasticity Test:
F-statistic 0.802918 Probability 0.754377 Obs*R-squared 44.50877 Probability 0.616698
c. Beusch-Godfrey test to check for autocorrelation
H0: No autocorrelation (zero lag) H1: Autocorrelation
Breusch-Godfrey Serial Correlation LM Test:
F-statistic 0.696595 Probability 0.499721 Obs*R-squared 1.464398 Probability 0.480850
Model 2 :
1. Descriptive statistics and correlation table
a. Correlation table
AGE ASSETTAN BVP BVP_SQUA PROFITAB SIZE TAXES AGE 1.000000 -0.061709 -0.069134 0.059910 -0.184556 0.046051 -0.219677 ASSETTAN -0.061709 1.000000 0.033092 -0.012114 0.007171 0.098383 -0.413573 BVP -0.069134 0.033092 1.000000 0.882720 0.134113 -0.145904 0.213924 BVP_SQUA 0.059910 -0.012114 0.882720 1.000000 0.042876 -0.034594 0.138910 PROFITAB -0.184556 0.007171 0.134113 0.042876 1.000000 -0.173776 0.250278 SIZE 0.046051 0.098383 -0.145904 -0.034594 -0.173776 1.000000 -0.117603 TAXES -0.219677 -0.413573 0.213924 0.138910 0.250278 -0.117603 1.000000