Development of a working method for the
study of a distillation process
Distillation of a multicomponent system
Åsa Afvander
Degree Project in Engineering Chemistry, 30 ECTS
Report passed: September 2015Supervisors:
Erika Tönnerfors, SPPD
William Siljebo, Umeå University
SP Process
Development
Abstract
This diploma work was done in order to develop a method for the study of distillation processes. Focus of the work was batch distillation of a multicomponent system but continuous distillation was also studied. A shortcut model based on the equations by Fenske, Underwood and Gilliland-Eduljee was used to simulate the distillation process in excel. Simulated data was matched to experimental data to get a model so that the relative volatilities between the components in the mixture could be found. Once the relative volatilities were found, the simulation could be done for almost any column. The relative volatility could be found with good precision using the shortcut method.
I would like to thank my supervisor Erika Tönnerfors at SPPD for all the help during this diploma work. I would also like to thank all the other personnel at SPPD for their support with my questions and analyses.
Finally I would like to thank my supervisor William Siljebo at Umeå University for all the help and support.
List of abbreviations
αav Average relative volatility between the top and bottom of the
column.
αi,r Relative volatility of the lighter component in relation to the
reference component
Ḃ Flow rate of bottom product, continuous distillation [g/min]
C Component
dc Internal diameter of the column [m]
Ḋ Flow rate of distillate [g/min]
D(t), D(t+1) Mass of liquid in the distillate at a certain time point t [g] Ḟ Flow rate of the Feed, continuous distillation [g/min] F-factor F-factor for the gas flow at a certain column diameter [√𝑃𝑎] HETP Height Equivalent to a Theoretical Plate [m]
HF Enthalpy of the feed [kJ/kg]
HK Heavy component. Component with higher boiling point, used as reference component
hpb Height of the packed bed [m]
Ĺ Flow rate of distillate that is returned to the column [g/min] LK Light component. Component with lower boiling point than the
reference component
m Mass of the withdrawn distillate [g]
mA, mB,… Mass of each component in the liquid phase [g]
MG Internal mass flow rate of the gas [g/min]
Mm Molar mass of the distillate. [g/mol]
MmA, MmB, … Molar mass of each component [g/mol]
N Number of theoretical plates
Nmin Minimum number of plates
NR number of plates in the rectifying section of the column
NS number of plates in the stripping section of the column
P Pressure [Pa]
P°i Vapor pressure of the pure component i [Pa]
Pi Partial pressure of component i [Pa]
Pr Partial pressure of reference component [Pa]
R Reflux ratio
Rmin Minimum reflux ratio
𝜌G Gas density [kg/m3]
Δt Distillate collection time [min]
T Temperature [K]
W(t), W(t+1) Mass of liquid in the boiler at a certain time point [g] xA, xB, … Mass fraction of each component in the liquid phase
xdi Mass fraction of lighter component in the distillate
xdr Mass fraction of the reference component in the distillate
xwi Mass fraction of each component in the boiler
xwr Mass fraction of the reference component in the boiler
Table of contents
1 INTRODUCTION ... 1 1.1 BACKGROUND ... 1 1.2 AIM OF THE PROJECT ... 2 1.3 PROJECT OBJECTIVES ... 2 2 THEORY ... 3 2.1 PHASE EQUILIBRIUM ... 3 2.1.1 Ideal system ... 4 2.1.2 Non-ideal system ... 5 2.1.3 Relative volatility ... 5 2.2 DISTILLATION ... 6 2.2.1 Simple distillation ... 6 2.2.2 Fractional distillation ... 6 2.2.3 Continuous distillation ... 7 2.2.4 Batch distillation ... 72.2.5 Azeotropic and Extractive distillation ... 8
2.3 EQUIPMENT ... 8
2.3.1 Columns and packing materials ... 9
2.3.2 Reflux divider and reflux ratio ... 12
2.4 MCCABE THIELES GRAPHICAL METHOD ... 13
2.5 SHORT CUT METHOD ... 14
3 EXPERIMENTAL METHODOLOGY ... 15
3.1 INITIAL TESTS WITH BINARY SYSTEMS ... 16
3.1.1 Bubble cap column ... 16
3.1.2 Initial evaluation method ... 17
3.1.3 Random packed column ... 18
3.1.4 Sampling from the boiler using a tube and a syringe ... 21
3.1.5 Sampling in the boiler using an IR-probe ... 22
3.2 TEST WITH MULTICOMPONENT SYSTEMS ... 23
4 RESULT AND DISCUSSION ... 24
4.1 INSULATION OF THE EQUIPMENT ... 24
4.2 EQUILIBRATION TIME ... 30
4.3 DISTILLATION VELOCITY ... 30
4.4 SAMPLING ... 32
4.5 MEASUREMENT WITH IR ... 33
4.6 MCCABE THIELE GRAPHICAL METHOD ... 34
4.7 SHORTCUT METHOD ... 36
4.8 RELATIVE VOLATILITY COMPARISON OBSERVED AND LITERATURE ... 39
4.9 AZEOTROPES AND MULTICOMPONENT SYSTEMS ... 43
5 CONCLUSION ... 45
6 REFERENCES ... 47 Practical procedure for the study of a distillation process Appendix 1 Short cut method for simulation of a batch distillation process Appendix 2 Calculations for simulation of a batch distillation process. Appendix 3 Calculations for simulation of a continuous distillation process. Appendix 4
1 Introduction
1.1 Background
Distillation used as a technique for separation of components in a mixture has been used for a very long time, all the way back to ancient time. [1] It is a process that is easy and efficient to use in small scale as well as in industrial scale giving products with good quality. It is thus widespread as a part of the manufacturing process of many industries.
SP Process Development AB (SPPD) in Södertälje is a research institute that handles chemical processes in the early stages of development. This means that there is little known about these processes. At SPPD batch distillation of a mixture of substances with unknown properties from a manufacturer can be performed in order to see if the substances can be separated by distillation. The procedure for performing the
distillation study should be standardized so that it can be performed with as much control as possible thus minimizing the sources of error. This means that SPPD can provide an approximation for the manufacturer of how a distillation procedure could be performed. With the help of relevant data the manufacturer can get a hint of the minimum demands for the process and from that design their distillation process for optimum performance and cost.
Manufacturers of a product that uses distillation in the production process, wishes to get as good efficiency to their distillation process as possible but to a reasonable cost. When designing a distillation process considerations have to be taken to both yield and cost. The cost for a distillation process at a certain production volume is divided between fixed and variable costs. The fixed cost comes from building the distillation equipment and it is largely determined by the number of plates needed. The variable cost comes from running the process and it is dependent on the outtake which is regulated by the reflux ratio. In the end the reflux ratio and the number of plates determines the yield of the product. If a product of high purity can be sold at a high price it is worth the cost for investing in an expensive distillation process. As a start it is necessary to know if the components of the mixture can be separated at all by distillation. When it has been found that the separation can be performed using distillation then the minimum number of plates and the minimum reflux ratio needed are determined. When the number of plates and reflux ratio have been
Different kind of packing material can give the wanted number of plates but at different ranges of gas mass flow i.e. they are efficient between specific values of gas mass flow.
1.2 Aim of the project
The purpose with this diploma work is to search the literature and perform practical experiments to find a procedure of how to study a distillation process. Both batch and continuous distillation are considered.
1.3 Project objectives
The goal with this diploma work is to develop a basic routine for how to study a distillation process. The samples to be studied are unknown multicomponent
systems. Both practical work and calculations using Excel should be identified so that a standardized procedure can be used.
This diploma work should also answer the following questions:
Which parameters are important to take into consideration when studying a distillation process?
How should the experiments be performed practically?
How should the columns be characterized as to number of theoretical plates depending on the F-factor?
Can a reasonable work effort give the wanted information?
Can the distillation process be simulated with easy-to-use software so that different possibilities for separation can be identified?
2 Theory
2.1 Phase equilibrium
When using distillation for separation of components in a mixture, equilibrium is formed between the liquid phase and the gas phase during the procedure. If the composition of the gas phase differs from the composition from the liquid phase, so that the gas phase contains a higher mass fraction of the lighter component than the liquid phase, then an enrichment of the lighter component can be achieved in the top of the column. The behavior of the equilibrium depends on if the system is ideal or not.
xA, xB and so on are used to describe the mass fraction of each component in the
liquid phase, see equation (1).
𝑥𝐴= 𝑚𝐴
𝑚𝐴+ 𝑚𝐵+ ⋯ + 𝑚𝑖 (1)
xA: mass fraction of component A in the liquid phase
mA, mB,…mi: mass of each component
In the same way the mass fraction of each component in the gas phase is described but it is then called yA, yB and so on, see equation (2).
𝑦𝐴=
𝑚𝐴
𝑚𝐴+ 𝑚𝐵+ ⋯ + 𝑚𝑖
(2) yA: mass fraction of component A in the gas phase
The sum of all mass fractions in the liquid phase should then be equal to one. The same applies to the gas phase, see equation (2).
The equilibrium changes with temperature so that more and more of the liquid will be vaporized with rising temperature. Each component in the mixture then
contributes to the pressure in the vessel.
According to Dalton’s law the total pressure of the system is the sum of all the partial pressures, see equation (3). The partial pressure is related to the fraction of the component in the vapor phase, see equation (4).
𝑃 = ∑ 𝑃𝑖 (3)
P: total pressure
𝑃𝑖 = 𝑦𝑖∙ 𝑃 (4) yi: mass fraction of component i in the vapor phase
The system can be ideal or non-ideal.
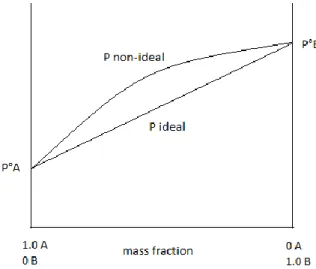
In Figure 1 the total pressure of a binary system is shown as a sum of the partial pressures for an ideal and a non-ideal system. For an ideal system the total pressure plotted against mass fraction is a straight line but the non-ideal system is not. When the deviation is small the system can be considered to be near ideal. [2]
Figure 1. Pressure in an ideal and in a non-ideal system.
2.1.1 Ideal system
When a system is considered to be ideal Raoult’s law can be used, see equation (5). According to Raoult’s law the partial pressure is related to the fraction of the component in the liquid phase.
𝑃𝑖 = 𝑃𝑖°∙ 𝑥
𝑖 (5)
P°i: vapor pressure of the pure component
A system is considered to be ideal when it consists of components with similar properties so the interactions between the molecules are comparable to a pure component. This means that molecules of all components can leave the liquid phase in a similar way to form the gas phase. The difference in how easy the molecules can leave the liquid phase depends on how strong the intermolecular forces are. If the intermolecular force between one component and the other components are weak then the first component has a high vapor pressure and the boiling point is lower than the other components. It then vaporizes more easily than the other components.
The separation of the components in an ideal system by distillation can thus be done using a normal distillation technique and the chance to accomplish a product of high purity is higher than for a non-ideal system. [2]
Often the gas phase is assumed to be ideal but not the liquid phase. The gas phase is considered ideal since there is enough space for each molecule to move and the difference in interaction between the molecules is smaller. In liquid the molecules collide and interact with each other more often than in gas phase. This means that the partial pressure in the liquid deviates from the ideal conditions due to the frequent collisions. In reality no mixtures are really ideal but they can be near ideal. When distillation is performed at near atmospheric pressure the system can be considered to be ideal when mixtures of similar components are distilled. [3]
2.1.2 Non-ideal system
When the components have different properties the mixture is non-ideal and the interaction between the molecules differ greatly from the ones of a pure component. [6] [7] If the molecules in the mixture strongly repel each other the partial pressure is higher than ideal and then a minimum boiling azeotrope is formed. When the
molecules strongly interact with each other a maximum boiling azeotrope is formed. With azeotropes it is impossible to separate the components with simple distillation. Other techniques i.e. azeotropic or extractive distillation can then be used. [2]
2.1.3 Relative volatility
The relative volatility (α) is a value that shows how much the volatility of different components in a mixture differs. The volatility of one component is analyzed in relation to another component, often the component with the highest boiling point is used as reference. Since the volatility of one component is defined as the partial pressure of that component divided by its mass fraction, the relative volatility can be described as in equation (6).
𝛼 = 𝑃𝑖/𝑥𝑖 𝑃𝑟/𝑥𝑟
(6)
α: relative volatility
Pi: partial pressure of lighter component
Pr: partial pressure of reference component
xi: mass fraction of lighter component
The relative volatility varies with composition and temperature of the mixture but for ideal systems it varies relatively little. [3]
When the relative volatility varies with composition it differs between the bottom and the top of the column. The average value of the relative volatility between the bottom and top of the column can then be calculated according to equation (7).
𝛼𝑎𝑣 = √𝛼𝑡𝑜𝑝∙ 𝛼𝑏𝑜𝑡𝑡𝑜𝑚 (7) αav: average relative volatility between the top and bottom of the column.
[5]
2.2 Distillation
Distillation can be performed continuously or as batch distillation. The separation can be performed using a single stage as in simple distillation or with multiple stages as in fractional distillation. The distillation technique chosen is depending on the properties of the mixture and the wanted yield of the product.
2.2.1 Simple distillation
The simplest way of distilling a mixture is to just add heat to the mixture until it boils, condense the vapor and withdraw the condensed vapor as distillate. It is called
simple distillation. The equilibrium between the liquid and gas phase is formed in a boiler and no fractionating column is used. Simple distillation can be used when the relative volatility is large or when the yield of the product is of less importance. This technique is called equilibrium distillation when it is done continuously and it is called differential distillation when it is done batch wise. When equilibrium
distillation is performed the stream of the mixture i.e. the feed is added to the boiler, the distillate is taken out in the top and the bottom product is taken out in the bottom of the boiler continuously. When differential distillation is used the mixture is added to the boiler and the distillate is withdrawn in the top of the boiler. When the
distillation has finished the bottom product which is left in the boiler is taken out. [3]
2.2.2 Fractional distillation
When the yield of the product is of great importance or the boiling points between the components in the mixture is close it is better to use fractional distillation instead of simple distillation. In fractional distillation a column which contains multiple plates is used. On each plate equilibrium between liquid and gas phase is formed so that an
enrichment of the more volatile component can be achieved. The more plates that are used, the more enriched the volatile component will be in the distillate. [8]
2.2.3 Continuous distillation
When the distillation is performed continuously the mixture is added and the product is withdrawn continuously. The mixture is added to a determined position on the column in a steady flow, this is called the feed (Ḟ). The part of the column that is above the place for the feed is called the rectifying section and the lower part is called the stripping section. The composition of the flows is consistent.
The mass balance for the continuous process is described in equation (8).
Ḟ = Ḋ + Ḃ (8)
Ḃ Flow rate of bottom product, continuous distillation [g/min] Ḋ Flow rate of distillate [g/min]
Ḟ Flow rate of the Feed, continuous distillation [g/min]
When separating a mixture by continuous distillation a light component and a heavy component is chosen. The light component and the heavy component is chosen so the separation can be performed as easy as possible and at as low cost as possible. The light component is the component which has a lower boiling point, and thus is more volatile, than the heavy component. This means that the distillate, taken out in the top of the column, contains the lighter components and the bottom product, taken out in the bottom of the column, contains the heavier components. The distillate and bottom product components can then be further separated in a second distillation step respectively until all the wanted products have been achieved. For each step a light and heavy component is chosen until all components have been separated. For a mixture with N number of components, at least N-1 columns are needed to separate all the components. Alternatively a fractionating column with multiple outtakes can be used as is commonly done in the oil industry.
The number of plates and reflux ratio is not varied within each separation step when distillation is performed continuously.
[2] [9]
2.2.4 Batch distillation
In batch distillation a certain amount of the mixture to be distilled is added to the boiler and then the mixture is distilled until enough of the wanted components have been taken out as distillate at the top. This means that the composition of the
distillate and the liquid in the boiler will change with time. After finished distillation the amount left in the boiler is taken out in the bottom. This procedure is then repeated. A simple distillation can be described by Rayeigh’s equation, see equation (9). ∫ 𝑑𝑥𝑖 𝑦𝑖− 𝑥𝑖 𝑥(𝑡+1) 𝑥(𝑡) = 𝑙𝑛 𝑊(𝑡) 𝑊(𝑡 + 1) (9)
W(t), W(t+1): mass of liquid in the boiler at a certain time [g]
The calculation for a fractional batch distillation is more complicated. Fenske, Underwood and Gilliland has defined equations (modified by Eduljee) that can describe a fractional batch distillation, see Appendix 3.
[2] [3]
Batch distillation is often used when production volumes are not very large or when a multicomponent system is to be separated since it in general is more flexible and easier to control than a continuous process. One component at a time may be separated from the mixture and this is useful if the composition of the feed changes over time. Another important aspect of using batch distillation is traceability where each batch has a unique identity. [8]
2.2.5 Azeotropic and Extractive distillation
In case of an azeotrope in the system two techniques are used to separate the
components; azeotropic and extractive distillation. In both techniques an entrainer is used to alter the relative volatility between the components in the azeotrope. The difference is how the entrainer is applied to the system. In azeotropic distillation the entrainer is added to the mixture and a new azeotrope is formed that lets one of the components of the former azeotrope to be distilled off. Both batch and continuous distillation can be used. With extractive distillation the entrainer is added to the system in the top of the column and then only continuous distillation can be used. [2]
2.3 Equipment
The distillation equipment, roughly described, consists of a heater and a boiler at the bottom, a column in the middle and a condenser at the top. For larger distillation columns the liquid is pumped through a heat exchanger instead of heated by a heater in the bottom.
2.3.1 Columns and packing materials
The column can be empty or filled with different kind of packing materials. It can be a packed column, or consist of trays like in a bubble cap column etc. The packed column can be filled with random packing or structured packing material.
Packed columns
Examples of random packing materials are rings and spirals, see Figure 2 and Figure 3. The packing material is filled into the column in a random way without direction. Random packing can be risky to use since there can be maldistributed liquid which the packing cannot handle.
Figure 2. Packing of spirals.
Figure 3. Packing of rings.
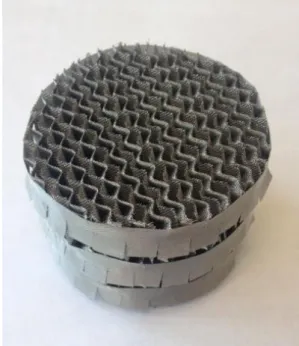
An example of structured packing is seen in Figure 4 where the packing material is inserted into the column so that the sides of the packing materials are placed in the
same direction. The efficiency for structured packings are higher than random packing.
Figure 4. Structured packing from Sultzer.
Packed columns are good to use when the liquid and vapor loading is low and they are more efficient under these conditions than tray columns. The effective area is larger for packed columns than for tray columns which is beneficial. The amount of liquid holdup will be less in a packed column compared to a tray column since only a thin film of liquid will cover the surface of the packing material. A larger amount of liquid will be held up on each tray.
Tray columns
One type of tray column is the bubble cap column. Each tray consists of a cap that can hold a certain amount of liquid, the excess liquid flows over an edge on the cap. As the vapor rises through holes in the cap the vapor comes into contact with the liquid and the contact surface is large since bubbles are created when the vapor rises up through the liquid, see Figure 5. A tray column works well when there is a high load of liquid and vapor but it has a higher pressure drop than a packed column.
Figure 5. Bubble cap column. The lighter component is more concentrated higher up in the column.
The active surface of the packing should be as large as possible since that gives a better separation. The pressure drop over the column should be low to give a high capacity. A large surface can give a high pressure drop but in this case a structured packing is better. [11] [13]
Number of trays
The efficiency of a tray column is not always consistent with the real number of trays and in columns with structured packing there are no real trays. The term “theoretical number of plates” is then used instead and this gives the actual efficiency of the column.
More theoretical plates gives a better separation of the mixture since equilibrium is said to be formed between the vapor and liquid on each theoretical plate. The lighter component will be vaporized easier than the heavy component so there will be an
enrichment of the lighter component in the vapor. From each plate vapor rich in the lighter component leaves and form a new equilibrium with the liquid on the next plate. As the vapor condenses on the condenser a part of it is returned down the column and meets the vapor on each plate. It also means that the returned liquid can form new equilibrium with the rising vapor which increases the concentration of the lighter component further. The concentration of the lighter component is thus higher in the top of the column than in the lower part of the column, see Figure 5.
Instead of using the number of theoretical plates, the height of a theoretical plate can be used. The boiler is assumed to be one plate and the number of theoretical plates of the column is denoted N. The total number of theoretical plates including the boiler is thus N+1.
The height of a theoretical plate (HETP) is calculated with equation (10). 𝐻𝐸𝑇𝑃 =ℎ𝑝𝑏
𝑁
(10) HETP: height equivalent to a theoretical plate [m]
hpb: height of the packed bed [m]
N: number of theoretical plates [2]
Manufacturers of packing for distillation columns perform a characterization of the packing to estimate the efficiency. The F-factor as a function of HETP is determined. The F-factor describes the mass flow rate of the vapor in relation to the vapor density and the inner diameter of the column. These technical data is sent together with the packing to the customers. [5] When a study of the unknown sample has been done and the relative volatilities have been found, the optimum reflux ratio and number of theoretical plates can be determined to get the wanted purity of the product and the optimum packing can be selected depending on the wanted gas mass flow.
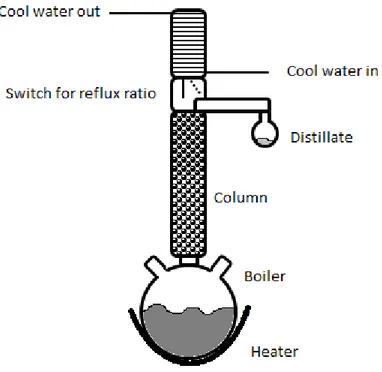
2.3.2 Reflux divider and reflux ratio
A switch, called reflux divider, for controlling the reflux ratio is often used and it is placed between the column and the condenser, see Figure 6. There are different types of reflux dividers. One type has an arm onto which the condensed liquid is led down from the condenser. The arm can be turned into two positions, one where the liquid drips back into the column and another where the liquid is taken out as distillate. The switch is regulated by time. A magnet is turned on at determined time intervals to position the switch over the outlet and back over the column.
the reflux and one for the withdrawal. The third type is most common in large scale columns: the condensed distillate is taken in a separate pipe and that flow is divided by a three way control valve.
The ratio between the amount of distillate returned and taken out is called the reflux ratio.
Figure 6. Schematic figure of the distillation equipment used during batch distillation.
Reflux ratio is defined as described in equation (11). 𝑅 = Ĺ
𝐷
(11)
R: reflux ratio
Ĺ: the flow rate of distillate that is returned to the column [g/min]. Ḋ: the flow rate of distillate [g/min].
When more distillate is returned to the column the reflux ratio increases. The returned distillate can then form new equilibrium with the rising vapor so a higher reflux ratio gives a better separation. [2]
2.4 McCabe Thieles graphical method
An easy way to characterize the column on which the study should be performed is to use the graphical method of McCabe Thiele to find the number of theoretical plates for the column at a certain reflux ratio and mixture of components. The McCabe
Thiele graphical method is well known and has been used for a long time. This method can only be used when components with known properties are used. Data of equilibrium between the vapor and liquid can be taken from literature or software such as Aspen Tech. These data has been thoroughly found by experiments or calculations and does not have to be verified. [10]
A number of assumptions have to be made:
That there is a constant molar overflow i.e. that the flow rates of vapor and liquid is the same on all plates of each section of the column (equimolar
overflow). The same amount of vapor per amount of liquid is leaving each plate. It differs between the rectifying and stripping section when continuous
distillation is used. It has to be assumed that the same amount of heat is needed for each plate to vaporize one mol of liquid and that the same amount of
molecules of the lighter and the heavier component are leaving each plate. It means that the flow of vapor and liquid is the same for each plate in the column.
That the distillation column is isolated to the degree that there is no heat loss. If the distillation equipment is not isolated enough the heat provided is lost through the walls of the glassware and the gas is subcooled. When this happens it is difficult to control the process.
Before the distillation begins a decision has to be made on how high
concentration of the lighter component is wanted in the distillate. A decision should also be made on how much of the lighter component should be left in the boiler. When using the McCabe Thiele method start and stop values have to be set.
A thorough description of how to use McCabe Thiele graphical method can be found in literature such as the book Chemical Engineering, Volume 2, fourth edition, by JM Coulson & J F Richardson with J R Coulson & J H Harker,Butterworth-Heinemann, 1991. [2]
2.5 Short cut method
The method of designing a distillation process by using a shortcut method is well described in the literature. It is a simple way of simulating a distillation process using a computer. If a shortcut method is not enough to describe a process then it is also well described in the literature how to use a semi-rigorous model or a rigorous model.
The simulation methods mentioned above were first developed for the oil industry but it works well for other applications too if care is taken to that the relative
volatility should be constant. The method should not be used for systems containing azeotropes. [11]
When using the shortcut method for simulating a batch distillation it should be known that concentrations and temperatures changes with time throughout the column. To get the wanted concentration of the light component in the distillate there are two modes of operating a batch distillation column. One way is to vary the reflux ratio throughout the distillation to get the same concentration of the light component in the distillate during the distillation process. Another way is to use a constant reflux ratio and calculate the mean value for the concentration of the light component in the distillate for the process time. With the shortcut method one of the operating modes have to be selected.
The following assumptions has to be made:
That it is a constant relative volatility between the components.
That there is equimolar overflow throughout the column.
That the column liquid holdup (tray holdup) is constant.
That no gas escapes the system and the total amount of liquid is the same in the beginning and end of the distillation.
A thorough description of a shortcut method can be found in the article by Asteria Narvaez-Garcia, Jose del Carmen Zavala-Loria, Luis Enrique Vilchis-Bravo, and Jose Antonio Rocha-Uribe, “Design of Batch Distillation Columns Using Short-Cut
Method at Constant Reflux,” Journal of Engineering, vol. 2013, Article ID 685969, 14 pages, 2013. doi:10.1155/2013/685969. [12]
3 Experimental methodology
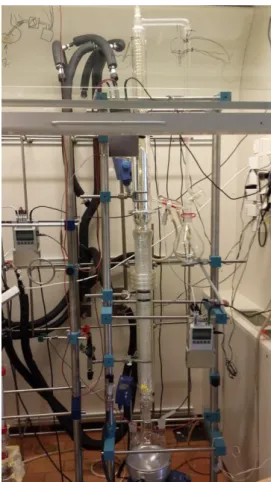
The distillation equipment used in the experiments was distillation equipment in laboratory scale and all experiments were performed using batch distillation. The distillation columns and boilers used were: a bubble cap column with ten trays together with a boiler size of 2 liters, a column with random packing of rings about 7 mm long and 5 mm together with a boiler size of 1 liter and finally a column with a random packing of spirals about 7 mm long and 5 mm together with a boiler size of 1 liter. Heat was added to the boiler by a jacket with a digital heating control. To each distillation column a distillation head with a water cooled condenser and an
electromagnetic controlled reflux divider was connected. The temperatures in the heater, boiler and top of the column were measured using Almemo logger with
probes which had not been calibrated directly before use. On the bubble cap column an Almemo pressure logger with probes was also used. The pressure logger had not been calibrated before use. Software Labware was used to monitor the temperature and pressure values from the Almemo loggers. Raw data and laboratory procedure notes were manually logged in SPPD internal digital logbook system.
3.1 Initial tests with binary systems
3.1.1 Bubble cap column
When the experiments first started, the bubble cap column was used to separate methanol 100 % HPLC grade manufacturer Lab-scan (methanol) from RO water produced inhouse (water), see Figure 7.
Figure 7. Bubble cap column with ten plates.
This was done to get a first evaluation of how the column and process would behave. The first time the tests were made the amount of methanol and water was 50/50 w/w % and the reflux ratio was R=3. The test was performed with no insulation on the boiler and only the vacuum jacket as insulation on the column for the first three days. It was concluded that the distillation took too long time to finish so an additional insulation was put on the boiler and column for the last two days. It was insulated
with mineral wool and aluminum foil. The distillation took as a whole five working days to perform. The second time the test was made the equipment was isolated as earlier, the amount of methanol and water in the feed was 20/80 w/w % and the reflux ratio was R=1. This time the distillation took a total of 1.5 working days. The distillate was collected in a number of separate flasks and the composition was measured using volumetric Karl Fisher equipment 870 KF Tritino plus from Metrohm (Karl Fisher) for determination of the water content.
3.1.2 Initial evaluation method
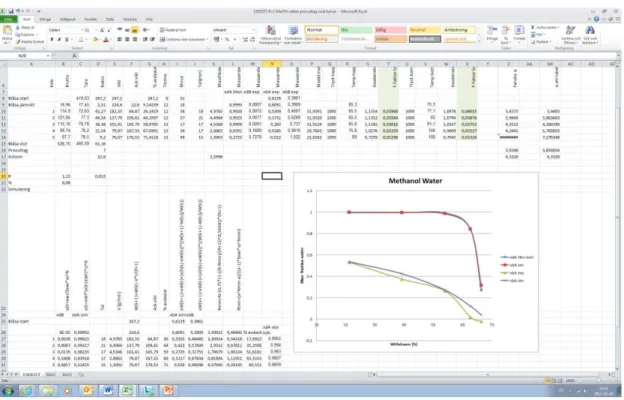
The number of plates was calculated for the second distillation using the McCabe - Thiele graphical method. A shortcut method was after that set up in an excel sheet to simulate the distillation process, see example in Figure 8. This was used from now on to evaluate the distillations instead of McCabe—Thiele. The equations for the shortcut method that was implemented in excel was found in the article by Asteria Narvaez-Garcia, et al. in “Design of Batch Distillation Columns Using Short-Cut Method at Constant Reflux”. [12]
Figure 8. Short-cut method in Excel.
The weights of the distillate in the different flasks, the time it took to gather the distillate for each flask and the observed values were inserted manually. Then the number of plates, reflux ratio and the relative volatilities could be calculated by using the problem solver in excel. The function problem solver was added manually to the top menu in excel. By taking the absolute values of the difference of observed and simulated values and summarizing the differences the problem solver could fit the
model to the observed values by one click. Separate summations were done for the distillate and the boiler. In the problem solver function the summation was chosen as the equation to be solved, the value was set to min and R, N and α were chosen as variables.
After the test of the possibility to distillate methanol-water had been done, tests were made to measure the relative volatility between methanol-water. For this, samples to be analyzed with the Karl Fisher method were taken from the boiler and the distillate. A test was done to use the bubble cap column with the two liter boiler but the
equipment was hard to handle since the boiler had to be weighed and the
temperature and pressure sensors were then moved out of place so the experiment had to be stopped. A decision was made to use smaller equipment which is easier to handle.
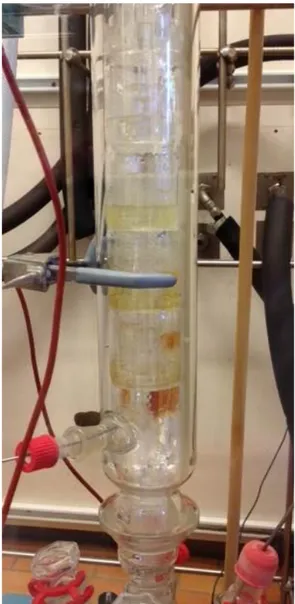
3.1.3 Random packed column
When the change to smaller distillation equipment was made a decision was taken to use random packed column, see Figure 9.
Tests of distilling methanol and water was performed, once using packing with rings 7 mm long and 5 mm and once using packing with spirals 7 mm long and 5 mm , it was decided to continue with the column filled with spirals since the spirals has more surface than the rings and the number of theoretical plates will be higher. The empty boiler with a magnetic stirrer was weighed, filled with 64/36 w/w % (50/50 mole/mole %) of methanol and water and the liquids were mixed with the magnetic stirrer. An initial sample was taken from the boiler and then the heater was started. Throughout the test the temperature difference between the heater and the boiler was kept at 40°. The temperature was monitored by Almemo logger and the Labware software and the temperature of the heater was raised manually to maintain the temperature difference at all time. After an equilibration time of about 45 minutes, when total reflux was used, a start sample was taken from the boiler. The collection and sampling of distillate then begun. Hereafter each time a flask with distillate was taken out, a sample was taken from the boiler and the temperatures in the top and boiler was noted. When the distillation had finished, the boiler with the remaining liquid was weighed to see how much remained in the column.
More tests were performed with methanol and water, acetic acid glacial (acetic acid) and water, methanol and ethanol 95 % (ethanol 95 %) manufactured by Kemetyl as well as acetone 100 % manufactured by Solveco (acetone) and acetonitrile HPLC grade manufactured by VWR (acetonitrile) using R=1 and a temperature difference between the heater and the boiler of 50°C. When methanol and water or acetic acid and water was used the water content was analyzed using Karl Fisher method. When methanol and ethanol or acetone and acetonitrile was used the content was analyzed using a Gas Chromatograph HP 6890 series with an Agilent DB-624 column 20 m long 0.180 mm I.D. 1.00 µm. The distillate was gathered in 100 mL flasks during a time period of several minutes. It was concluded that the composition in the 100 mL flasks is an average value for the sample time and that composition is not
representative. Difficulties in fitting the simulation to the observed values led to a decision to take out 1-mL samples in 10 mL flasks to get a more direct result. From now on when a 100 mL flask was changed a 1 mL sample in a 10 mL flask was taken. The weight of the empty and filled 10 mL and 100 mL flasks were measured.
Each time a distillation was performed between five and twelve samples of the distillate and from the boiler was taken. In order to get a better simulation more samples had to be taken.
When the distillation was performed at R=1 and a temperature difference of 50°C the velocity was very high and it was difficult to get a good separation. To be able to take out more samples and to get a better separation, the distillations were performed at a slower velocity with a higher reflux ratio and a lower difference in temperature between the heater and the boiler.
A decision was taken to use R=3 and a temperature difference between the heater and the boiler of 30°C.
One test with acetic acid and water was performed where water is the lighter component. It was performed with an equilibration time of 45 minutes. It was seen that an equilibration time of 45 minutes was too short to get a separation, and hence a representative distillation result, when the relative volatility is low, i.e 1.8. This was seen on the monitoring of the temperature in the top of the column using the
software Labware. It was seen that the temperature had not leveled out until after 2 hours. When repeating the test the column was let to be equilibrated for at least 2 hours. The water content was analyzed using Karl Fisher method.
Further experiments showed that although the boiler and column had been isolated the reflux ratio was still higher than the set. It was seen that the column was not insulated all the way up to the condenser and the insulation on the column did not go all the way around. The equipment was further insulated all the way up to the
condenser and also insulated all around the column.
The weight of the liquid remaining in the column with spirals was measured by weighing the tare weight of the boiler, taking the known weight of the liquid, weighing the distillate and the samples and finally when the distilling was finished weighing the boiler with the remaining liquid. The weight in the column could then be calculated subtracting the distillate, samples and remaining liquid weight from the original weight of the liquid. The weight in the column is used for calculations with the shortcut method.
3.1.4 Sampling from the boiler using a tube and a syringe
Sample from the boiler was taken by inserting a 1 mm , 15 cm long, plastic tube through septa and in the end a 5 mL syringe was attached. The sampling from the boiler could be done like this since the distillation was performed at atmospheric pressure. It will not be possible to perform sampling of the boiler when the distillation is performed under vacuum. For distillation under vacuum another technique has to be used e.g. by inserting an IR-probe or stopping the distillation and taking out samples.
Another way of not having to take samples from the boiler was by showing that the simulation model conformed with composition in the boiler when the composition in the distillate was used. Then only a start sample and a sample after finished
distillation had to be taken from the boiler. The sample after finished distillation could then be used only for confirmation with the model. But this is not a good approach since any component could come to an end in the boiler before the
distillation was finished and also there could be some difference in relative volatility between the boiler and the top of the column. So a decision was made to continue sampling from the boiler.
Figure 10. Plastic tube through septa for sampling in the boiler. Each sample taken from the boiler was of about 1 mL.
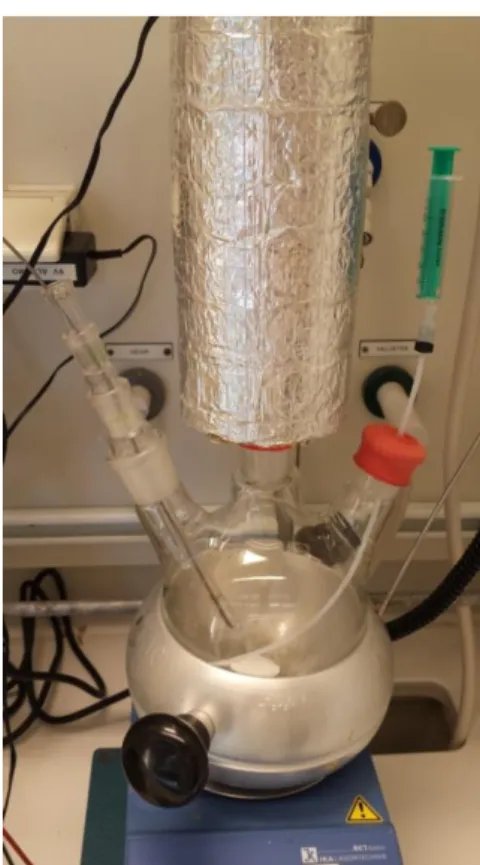
3.1.5 Sampling in the boiler using an IR-probe
A test was performed using an IR-probe to be able to measure the concentration of each component in the boiler on-line in order to obtain more samples. A calibration curve was first prepared by pouring 25 mL of acetonitrile in a round bottom flask 0.5 L and adding acetone with 1 mL/minute, with a pump, to the acetonitrile. Totally 50 mL acetone was added. Sampling was performed every 30 seconds. With the help of the software iCIR4.3 peaks could be identified for each component, four peaks for acetone and two peaks for acetonitrile. The calibration curve was prepared by taking the average value of the peaks for each component and plotting them against each other. The calibration curve was then used for evaluating the results from the distillation test.
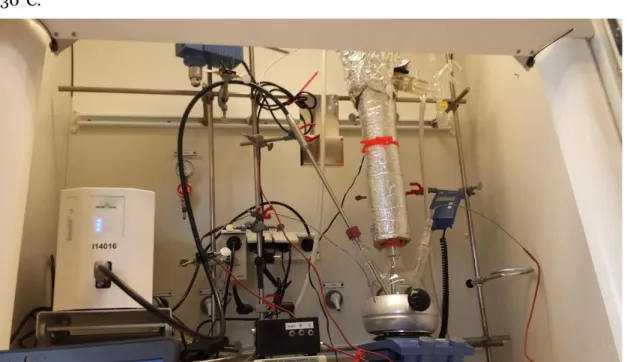
For the distillation test, the IR-probe was placed in the boiler but it could also have been placed to measure the distillate. The decision to place it in the boiler was taken since it was easier to mount it there, see Figure 11. Sampling with the IR-probe was performed every 30 seconds and sampling of the distillate was performed manually as earlier. The mixture in the distillation test consisted of acetone and acetonitrile, the reflux ratio was R=3 and the difference between the heater and the boiler was 30°C.
Figure 11. IR-probe in boiler.
The IR-probe had an integrated thermocouple so the temperature could also be monitored on-line. The IR-probe was not calibrated for temperature directly before use but it had been calibrated by the manufacturer and it was newly bought. The absorbance raw data was imported to excel and the four peaks for acetone as well as the two peaks for acetonitrile were evaluated.
Mean absorbance for acetone and acetonitrile were calculated and the ratio between the mean values were taken. From this the concentration of acetone and acetonitrile could be calculated from the calibration curve.
3.2 Test with multicomponent systems
For the multicomponent system the first mixture that was distilled consisted of acetone, acetonitrile, ethanol 95 % and methanol in equal amount of mol, the reflux ratio was R=2 and a temperature difference of 50°C between the heater and the boiler was used. Samples for analysis of the distillate were taken from the 100 mL round bottom flasks thus giving an average value for the withdrawal time.
The second time a multicomponent distillation was performed a mixture of acetone, acetonitrile and ethanol 99.7 % manufactured by Solveco (ethanol 99.7 %) was distilled using a reflux ratio of R=3 and a temperature difference of 30°C between the heater and the boiler. This time samples of the distillate were taken from pointed bottom flasks 10 mL to get a more precise result. Only three samples from the boiler were taken.
The third time a multicomponent distillation was performed a mixture of acetone, acetonitrile, methanol, ethanol 99.7 % and water was distilled using a reflux ratio of R=3 and a temperature difference of 30°C between the heater and the boiler. Samples of the distillate were taken in 10 mL flasks and samples from the boiler were taken each time samples were taken from the distillate.
The simulation of the multicomponent systems could be done with the shortcut method but when one of the components came to an end in the boiler the simulation could not proceed although there were components left in the mixture. The
simulation for multicomponent systems was then decided to be performed in several steps with less number of components and new beginning of simulation for each step.
4 Result and Discussion
4.1 Insulation of the equipment
On the parts of the equipment where there is no insulation gas gets subcooled by the air and condenses on the walls of the glassware. This increases the reflux rate but the distillation will take a longer time.
The first time distillation was performed with the bubble cap column no insulation was mounted on to the equipment. The distillation then took a very long time and insulation was thus added to the boiler and the column. The process could then be finished earlier. It was found that it is important to insulate the distillation
equipment. Mineral wool and aluminum foil was used with good result. It was later also found that it is important that the equipment is insulated all the way from the boiler up to the condenser. It was shown that when the equipment was not insulated at all or partially insulated the actual reflux ratio was higher than expected, see Figure 12 to Figure 15.
Figure 12. Experiment no 15E0249. Distillation of acetic acid and water. Equilibration time 45 minutes. Set value R=2, actual value according to shortcut method R=90, temperature difference 40° between the heater and the boiler, α=1,81, liquid start weight 545.5 g. Total distillation time=6.5 hours including equilibration time 45 minutes.
Figure 13. Experiment no 15E0259Distillation of Methanol and Water. Samples analyzed from round bottom flasks 100 mL. Set value R=2, actual value according to shortcut method R=6, temperature difference 40° between the heater and the boiler, α=3.66, liquid start weight 247.2 g. Total distillation time 5.5 hours including equilibration time 2.5 hours.
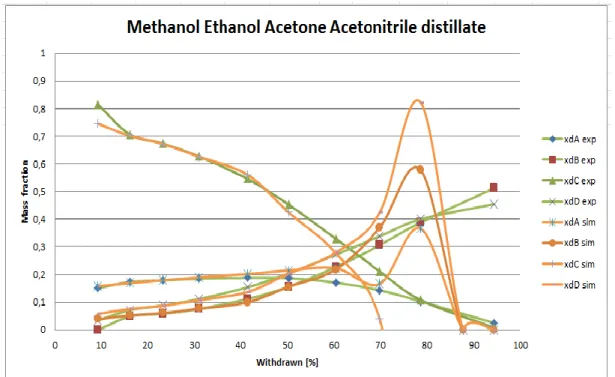
Figure 14. Experiment 15E0338. Distillation of A=Methanol, B=Ethanol, C=Acetone and D=Acetonitrile. Distillate. Result for the distillate. Set value R=2, actual value according to shortcut method R=3.6, temperature difference 40° between the heater and the boiler, αAD=1.60, αBD=0.84, αCD=1.98, liquid
Figure 15. Experiment 15E0338. Distillation of A=Methanol, B=Ethanol, C=Acetone and D=Acetonitrile. Result for the boiler. Set value R=2, actual value according to shortcut method R=3.6, temperature difference 40° between the heater and the boiler, αAD=1.60, αBD=0.84, αCD=1.98, liquid start weight
247.2 g. Total distillation time 5.5 hours including equilibration time 2.5 hours.
This was found with the shortcut method where it was seen that the model could not be fit to the observed data using the set reflux ratio. When the equipment was insulated enough the shortcut method showed that the reflux ratio was close to the set value, see Figure 16 to Figure 19.
Figure 16. Experiment no 15E0377. Distillation of Methanol and Water. Samples analyzed from both round bottom flasks 100 mL and pointed bottom flasks 10 mL. Set value R=1, actual value according to shortcut method R=1.1, temperature difference 50° between the heater and the boiler, α=3,87, liquid start weight 247.2 g. Total distillation time 5.5 hours including equilibration time 4 hours.
Figure 17. Experiment no 15E0407Distillation of Acetone and Acetonitrile. Set value R=1, actual value according to shortcut method R=1.3, temperature difference 50° between the heater and the boiler,
α=2.34, liquid start weight 270.0 g. Total distillation time 4 hours including equilibration time 2.5
Figure 18. Experiment 15E0515. Distillation of A=Acetone, B=Ethanol and C=Acetonitrile. Result for the distillate. Set value R=3, actual value according to shortcut method R=3.05, temperature difference 30°C between the heater and the boiler, αAC=2.16, αBC=1.26, liquid start weight 367.71 g. Total
distillation time 5 hours including equilibration time 2.25 hours.
Figure 19. Experiment 15E0554. System with five components and four components. Result for the boiler. R=3, temperature difference 30°C between the heater and the boiler, relative volatility with five components: αAE=2.88, αBE=2.38, αCE=1.47, αDE=1.75, liquid start weight 269.44 g, relative volatility
with four components αBE=2.74, αCE=2.29, αDE=2.61. Total distillation time 6.5 hours including
equilibration time 2 hours. Series 11 to 14 is the new simulation containing four components. Series 11 is Methanol, series 12 is Ethanol, series 13 is Acetonitrile and series 14 is Water.
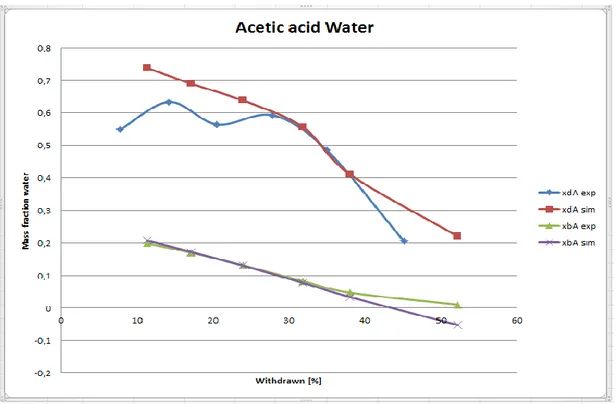
When distillation was done using water as the lighter component the reflux ratio was higher than expected due to the behavior of the water in the column. The condensed water vapor did not flow over the reflux divider in an even stream but periodically. More water ran down back into the column than as distillate so the reflux ratio became higher although the equipment was properly insulated, see Figure 20.
Figure 20. Experiment no 15E0382Distillation of acetic acid and water. Equilibration time 3.5 hours. Set value R=1, actual value according to shortcut method R=3.7, 50° temperature difference between the heater and the boiler, α=1,81, liquid start weight 314.7 g. Total distillation time=5.5 hours including equilibration time 3,5 hours.
The behavior of the distillation of acetone and acetonitrile using IR-probe for
sampling in the boiler was also unexpected. The gas mass flow was low and the reflux ratio was higher than expected although the equipment was well insulated, see Figure
Figure 21. Experiment no 15E0464. Distillation of Acetone and Acetonitrile and using an IR-probe for sampling of in the boiler. Set value R=3, actual value according to shortcut method R=5.5, temperature difference 30° between the heater and the boiler, α=2.45, liquid start weight 340.4 g. Total distillation time 6 hours including equilibration time 1.75 hours.
This was due to other factors than the insulation, see further discussion about using IR below.
4.2 Equilibration time
It can be seen in Figure 12 that the column with spirals had been equilibrated too short time, the mass fraction of water in the beginning was too low. The column was equilibrated about 45 minutes before collection of distillate was initiated. It was seen on the monitoring, using the temperature software Labware, that the temperature in the top of the column had not leveled out before two hours of equilibration at total reflux. It was concluded that this column should be equilibrated for at least two hours to achieve a representative distillation as is seen in Figure 20.
4.3 Distillation velocity
The distillation velocity is related to how much energy is added to the boiler and to the reflux ratio. The more energy that is added the higher the gas mass flow will be and the lower the reflux ratio is the higher the withdrawal of distillate. The adding of energy in this diploma work was regulated by choosing a temperature difference between the heater and the boiler. A temperature difference of 50° gave a
significantly higher gas flow rate compared to a temperature difference of 30°. A poor separation was obtained with R=1, a temperature difference between the heater and the boiler of 50° when the relative volatility was α=1.8, see Figure 20.
It was then difficult to fit the simulation to the observed data. When the relative volatility was α=3.6 the simulation could be fit easily to the observed data although R=1 and the temperature difference was 50°, see Figure 16 but such high relative volatility is not always the case. When comparing Figure 17, where the distillation was performed at a higher velocity, with Figure 21, where the distillation was performed at a lower velocity, it is seen that the simulation could much easier be fit when the velocity was low since the distillate contained a higher concentration of the lighter component. It was seen that a higher mass fraction of the lighter component in the distillate made it easier to fit the simulated model to the observed values. When an unknown sample is distilled the assumption has to be done that the relative volatility between the components is low and the distillation study should be
performed at a low velocity. The reflux rate should be at least R=3 and the
temperature difference between the heater and the boiler should be about 30° for the type of distillation equipment used in these experiments.
In the article by Žarko Olujić [5] on page 18 it says that the run when studying a distillation process, for finding the F-factor, should not be too perfect. This should be done since the calculations will be difficult with too concentrated samples, the
relative deviations will be too high. The recommendation in the article is that the distillate should not contain more than 90 % and the liquid in the boiler should not contain less than 10 % of the lighter component. The experience from the tests performed is that a mass percentage of 99 % in the distillate and 10 % in the boiler of the lighter component gives the best results for simulation. A too low concentration of the lighter component e.g. a mass fraction of 0.5 in the distillate, makes it more difficult to obtain a good model.
4.4 Sampling
In the beginning samples for analysis of the distillate were taken from the 100 mL flasks where the distillate was gathered. This gave observed values that was difficult to match with the simulation, especially in the end of the distillation. It is seen clearly in Figure 13 that the observed values maintains a high concentration of the lighter component in the distillate for a longer time than the simulated values, the simulated curve is more rounded at the end. It was concluded that the value in each 100 mL flask was an average value for the total withdrawal time for each flask and it is not representative. About 40 mL was withdrawn to each flask. Another approach had to be taken; a more instant value of the distillate was needed. 10 mL flasks was then used to take out separate 1 mL samples of the distillate in connection to the change of the 100 mL flasks. The distillate taken out in the 100 mL flasks was then only used for calculation of velocity.
As seen in Figure 16 the simulated values could be better fit to the observed values when the 10 mL flasks were used. In Figure 16 also the curve for analysis of the 100 mL flasks has been added for further clarification of the difference and it is the curve which stretches beyond the other two at the end of the experiment.
In those cases samples were taken from the boiler at the same time as from the distillate it has been easier to fit the simulation to the observed data. With the help of the function problem solver in excel the match could then be done separately for the distillate and for the boiler. Matching the simulation to the values from the boiler gave a confirmation that the matching of the values of the distillate was correct. There are often differences of the relative volatilities between the top of the column and the boiler due to the difference in composition and this should be checked. A mean value is then calculated, see equation (7).
When vacuum distillation is necessary the samples cannot be withdrawn from the boiler. To solve this the distillation can be stopped at regular intervals to take out samples. An alternative is to use an IR-probe inserted to get an instant result of the boiler but this has to be investigated further before use.
One attempt to use the IR-probe was performed, see Figure 21. It can be seen that the results from the boiler obtained with the IR-probe could not be fit into the model. The use of IR-probe is discussed in section 4.5.
4.5 Measurement with IR
During the experiment using Acetone and Acetonitrile and with an IR-probe it was observed that the distillation velocity was very low. For result using IR-probe, see Figure 21. Right after the experiment with acetone, acetonitrile and the IR-probe an experiment using acetone, acetonitrile and ethanol 99.7 % but without an IR-probe was performed, see Figure 18 and Figure 22.
Figure 22. Experiment 15E0515. Distillation of A=Acetone, B=Ethanol and C=Acetonitrile. Result for the boiler. Set value R=3, actual value according to shortcut method R=3.05, temperature difference 30°C between the heater and the boiler, αAC=2.16, αBC=1.26, liquid start weight 367.71 g. Total distillation time
5 hours including equilibration time 2.25 hours. No curves for sampling since only three samples were taken from the boiler, these are marked with “+” in the graph.
When the experiment was performed using acetone, acetonitrile and ethanol 99.7 % but without the IR-probe, the much faster distillation velocity came as a surprise. The faster velocity could not be explained by the adding of ethanol only.
When the simulation model was fit according to the GC data from the experiment using the IR-probe it was found that the reflux ratio was about R=5.5 when it should have been R=3. The effect is probably due to that the IR-probe was inserted into the boiler and since its area was relatively big and the metal leads the heat from the boiler to the environment the gas condensed on the probe. It is better to use the IR-probe in the distillate where it does not disturb the distillation process and also the distillate contains fewer compounds so the evaluation of the peaks in the
The concentration results obtained with the IR-probe were not consistent with GC results or with theory according to VLE-Calc.com. [13] The composition in the boiler was analyzed by GC in the beginning and in the end of the distillation and the amount of acetone then was found to be too low with IR, see Figure 21. The temperature measured with the IR-probe differed by about 10°C from theory. According to VLE-Calc. com the boiling temperature for the measured composition in the beginning and end of the distillation should have been 10° higher. Perhaps the effect of leading heat out of the boiler also led to that the integrated thermal sensor in the IR-probe showed the wrong temperature.
No further tests with the IR-probe was performed. The benefit of using the IR-probe is that a lot of data can be obtained which will make the simulation model more precise. The downside with this technique is that peaks have to be identified for each compound. That can be difficult if there are a lot of compounds in the mixture, as it can be in the boiler. This leads to that peaks can overlap and thus be difficult to resolve. If the IR-probe is inserted into the distillate which contains a few compounds the identification of peaks will be easier. The technique using IR is recommended to be further investigated at a later time.
4.6 McCabe Thiele graphical method
The graphical method McCabe Thiele, see Figure 23, shows the theoretical number of plates for the first batch distillation performed.
Figure 23. Experiment15E0140. McCabe Thiele method for evaluation of the distillation of Methanol and Water using a bubble cap column with 10 plates. R=3, temperature difference 40° between the heater and the boiler, α=3.65, liquid start weight 1825 g. Total distillation time=1.5 days including equilibration time 1.5 hours day one and2.5 hours the second day.
The figure gives the result at the time of the first sampling when the mass fraction of methanol was 0.998 in the distillate and 0.547 in the boiler. It also shows that the distillation using the bubble cap column for separation of methanol and water then gave N+1=11 plates which gives an efficiency of the column of 100 % since the bubble cap column has N=10 trays. The McCabe Thiele graphical method gives a rough estimation of the process but it has been used for a long time and is well established. The drawing of the steps in the diagram was done using a computer but it can also be done by hand. The accuracy is estimated to be equally good using a computer as it would have been compared to drawing by hand. A simulation model could not be done at this time since the liquid holdup in the column was not known. The McCabe Thiele graphical method is used for binary systems and the liquid-vapor equilibrium values has to be known so it could not be used for the multicomponent systems. Once the shortcut method was set up it was used instead since it could be used for
multicomponent systems and drawing the lines for the McCabe Thiele method takes longer time.
4.7 Shortcut method
The shortcut simulation in Excel was divided into three pages. On the first page a model was fitted to the observed values to get the relative volatilities. Once the relative volatilities had been found simulation for batch distillation was done on page two and for continuous distillation on page three. For example see Figure 24 to Figure 26.
Figure 25. Short-cut method in Excel. Page with the simulation of batch distillation.
Figure 26. Short-cut method in Excel. Page with simulation of continuous distillation.
It was observed that when simulating a batch distillation with the shortcut method using very low numbers for N and R even a small change in these values had a big impact on the curve and so the simulation failed. The shortcut method was found to be robust to use when the parameters N and R were high. It was also robust to use when R was close to the set value i.e. when the equipment had been well insulated.
When the values of N and R were high the concentration of the light component was high i.e. a mass fraction about 0.99 and since it was easier to simulate a distillation with high concentration of the light component in the distillate this was the best choice.
To make the simulation of a model even more user friendly, the number of plates were plotted against the gas mass flow for each experiment in this diploma work, see Table 1 and Figure 27.
Table 1. Number of theoretical plates N against gas mass flow and F-factor.
Experiment no Gas mass flow N F-factor 15E0373 4,7 6 0,04 15E0377 4,5 6,4 0,035 15E0382 8,7 2,8 0,1 15E0395 8,9 2,5 0,06 15E0407 6,5 4,4 0,04 15E0464 5,5 6,6 15E0515 7 4,9 0,04 15E0554 4,9 8,3 0,03
The values of the gas mass flow are mean values. The purpose of the graph is to be used to give the user a hint of about how many plates can be expected. The linearity was relatively good R2=0.828. A plot was also made of the number of plates against
the F-factor, see Figure 28.
Figure 28. Number of plates against F-factor.
The values of the F-factors are mean values. The deviation from linearity for the curve of number of plates against F-factor is greater than for number of plates against gas mass flow, R2=0.5672. This is due to that more factors are involved in the calculation
of the F-factor compared to the calculation of the gas mass flow. This is not recommended to be used as a tool for expectance of the number of plates.
4.8 Relative volatility comparison observed and literature
Comparison of the relative volatility for experiments 15E0140, 15E0249, 15E0259 has not been done since the runs were not performed correctly. It has also not been done for experiments 15E0338 and 15E0554 since these runs consists of more than three components and it was not possible to run these experiments through software Aspen Tech due to high work load.
A difficulty in using the shortcut method for fitting a model to a multicomponent system is when one of the components has evaporated from the boiler, then the model is no longer valid. This is clearly seen in Figure 29 and Figure 30.
Figure 29. Experiment 15E0554. System with five components. Result for the distillate. Set value R=3, actual value R=3.0, temperature difference 30°C between the heater and the boiler, relative volatility with five components: αAE=2.88, αBE=2.38, αCE=1.47, αDE=1.75, relative volatility with four components
αBE=2.74, αCE=2.29, αDE=2.61, liquid start weight 269.44 g. Total distillation time 6.5 hours including
equilibration time 2 hours.
Figure 30. Experiment 15E0554. System with five components. Result for the boiler. R=3, temperature difference 30°C between the heater and the boiler, relative volatility with five components: αAE=2.88,
αBE=2.38, αCE=1.47, αDE=1.75, relative volatility with four components αBE=2.74, αCE=2.29, αDE=2.61,
In this case the simulation would stop at when about 50 % of the liquid mass had been withdrawn as distillate and a new model would be fit using fewer components as seen in Figure 31 and Figure 19.
Figure 31. Experiment 15E0554. System with five components and four components. Result for the distillate. R=3, temperature difference 30°C between the heater and the boiler, relative volatility with five components: αAE=2.88, αBE=2.38, αCE=1.47, αDE=1.75, relative volatility with four components
αBE=2.74, αCE=2.29, αDE=2.61, liquid start weight 269.44 g. Total distillation time 6.5 hours including
equilibration time 2 hours. Series 11 to 14 is the new simulation containing four components. Series 11 is Methanol, series 12 is Ethanol, series 13 is Acetonitrile and series 14 is Water.
It is seen that with more samples taken it will be easier to fit the model since the model has to be divided into smaller parts. When the composition changes the relative volatility sometimes changes. It depends on how ideal the system is. In Figure 31 and Figure 19 it is seen that the relative volatility has changed at the end as the composition also has changed. The result for the relative volatility will only be valid for two points at 60-70 % withdrawn.
The relative volatilities could be found at more than 93 % accuracy compared to software Aspen Tech and VLE-Calc.com which is considered good enough, see Table
Table 2. Relative volatility Experiment 15E0377
Experiment 15E0377, Methanol and Water (Figure 16) Mass fraction Methanol Mass fraction Water Temp top αVLEAB αAB Aspen Mass fraction Methanol Mass fraction Water Temp boiler αVLEAB αAB Aspen 0,9928 0,0072 65,5 2,56 2,54 0,5309 0,4691 77,1 4,438 6,62 0,9923 0,0077 65,5 2,56 2,54 0,3731 0,6269 83 5,598 7,24 0,9909 0,0091 65,6 2,56 2,54 0,263 0,737 91,1 7,259 7,62 0,8391 0,1609 75,8 - - 0,0185 0,9815 100 - - 0,2722 0,7278 89 - - -0,022 1,022 100 - -
Average VLE αAB top and boiler: 3,84
Average Aspen αAB top and boiler: 3.85
Simulated average αAB: 3.87
Deviation from VLE: 0.8 % Table 3. Relative volatility Experiment 15E0382
Experiment 15E0382, Water and Acetic acid (Figure 20) Mass fraction Water Mass fraction Acetic acid Temp top αVLEAB αAB Aspen Mass fraction Water Mass fraction Acetic acid Temp boiler αVLEAB αAB Aspen 0,505 0,4952 102,8 1,85 1,81 0,286 0,715 105,6 1,75 1,81 0,490 0,5101 103,1 1,83 1,81 0,204 0,796 108,1 1,71 1,81 0,422 0,578 104,1 1,81 1,81 0,139 0,861 113 1,62 1,81 0,227 0,7734 107,6 1,71 1,81 0,050 0,950 117,4 1,53 1,82 0,0005 0,9995 118,2 - - 0,011 0,989 120,2 - -
Average VLE αAB top and boiler: 1,75
Average Aspen αAB top and boiler: 1,80
Simulated average αAB: 1,71
Deviation from Aspen: 5.3 % Table 4. Relative volatility Experiment 15E0407
Experiment 15E0407, Acetone and Acetonitrile (Figure 17) Mass fraction Acetone Mass fraction Acetonitrile Temp top αVLEAB Mass fraction Acetone Mass fraction Acetonitrile Temp boiler αAB VLE 0,909 0,091 57,9 2,20 0,522 0,478 68,6 2,32 0,854 0,146 60,1 2,25 0,445 0,555 70,4 2,36 0,763 0,237 63 2,27 0,339 0,661 74 2,36 0,612 0,388 67,2 2,31 0,219 0,781 80,2 2,48 0,356 0,644 74 2,42 0,175 0,825 88,5 2,51
Average VLE αAB top and boiler: 2.35
Simulated average αAB: 2.34