A Design Framework for
Service-oriented Systems
Raluca Marinescu, Eduard Paul Enoiu
June 1, 2011
Master’s Thesis in Computer Science, 30 credits
Supervisor: Aida ˇ
Cauˇsevi´
c
Examiner: Cristina Seceleanu
M¨
alardalen University
School of Innovation, Design and Engineering
721 23 V¨
aster˚
as
Abstract
In the context of building software systems, Service-oriented Systems (SOS) have become one of the major research topics in the past few years. In SOS, services are basic functional units that can be created, invoked, composed, and if needed deleted on-the fly. Since these software systems are composed of different services there is no easy way to assure the Qual-ity of Service (QoS), therefore, formal specification of both functional and extra-functional system behaviour, compatibility, and interoperability between different services have be-come important issues. As a way to address this issues, resource-aware timing behavioural language REMES was chosen to be extended towards service-oriented paradigm with service specific information, such as type, capacity, time-to-serve, etc., as well as Boolean predicate constraints on control flow guarantees. In this thesis we present a design framework that provides a graphical user interface for behaviour modelling of services based on REMES language. NetBeans Visual Library API is used to display editable service diagrams with support for graph-oriented models. A textual dynamic service composition language was implemented, together with means to automatically verify service composition correctness. We ensure also an automated traceability between service specification interfaces, where both modelling levels are combined in an efficient tool for designing SOS.
Contents
1 Introduction 1
1.1 Purpose . . . 2
1.2 Outline . . . 2
2 Preliminaries 3 2.1 Behavioral Modeling of Services . . . 3
2.1.1 Behavioral Modeling of CBS . . . 3
2.1.2 Behavioral Modeling in REMES . . . 4
2.1.3 REMES extension for SOS . . . 5
2.2 Graphical Libraries and Frameworks Evaluation . . . 7
2.2.1 Motivation . . . 8
2.2.2 Comparison of Graphical Libraries and Frameworks . . . 8
2.3 Visual Library API . . . 9
2.3.1 Visual Library API Architecture . . . 9
2.3.2 Widget Class . . . 10
2.3.3 ConnectionWidget Class . . . 13
2.3.4 LayerWidget Class . . . 13
2.3.5 The Scene: The Root Element . . . 14
2.3.6 Model-View and GraphPinScene . . . 14
3 Implementation 15 3.1 Tool Architecture . . . 15
3.2 Scene hierarchy of elements . . . 16
3.3 Models for REMES Service Diagram Manipulation . . . 17
3.3.1 Data Model Structure . . . 18
3.4 DEV and Display Model . . . 20
3.4.1 An Atomic Service Widget . . . 21
3.4.2 Parallel Connector Widget . . . 23
3.4.3 Composite Service Widget . . . 24
3.4.4 AND/OR Mode . . . 24
3.4.5 List Widget . . . 25
3.5 Composite Mode Scene . . . 26
3.6 AND/OR mode scene . . . 27
3.7 Console View . . . 28
3.7.1 Parsing with DOM . . . 28
3.7.2 Generating the hierarchical language from the data model . . . 30
3.7.3 Generating the data model out of hierarchical language . . . 31
4 User Interface 33 4.1 GUI Overview . . . 33
4.1.1 Diagram Editor View . . . 33
4.1.2 Console View . . . 35 4.2 Diagram . . . 36 4.2.1 Atomic service . . . 36 4.2.2 Composite service . . . 36 4.2.3 Sequential Connection . . . 37 4.2.4 Parallel Connection . . . 37 4.2.5 AND/OR Mode . . . 38 4.2.6 Service List . . . 40
4.3 Data Model and HDCL . . . 40
5 Further Ideas 43
6 Conclusions 45
List of Figures
2.1 NetBeans Visual Library Architecture as a Class Diagram . . . 11
2.2 Simplified widget hierarchy . . . 12
3.1 Design Framework and Technology Utilization . . . 16
3.2 Display and Data Models Lifecycle . . . 18
3.3 Data file Structure for Edge, Scene Control, and Pin element . . . 19
3.4 Data file Structure for Node element . . . 19
3.5 ConnectScene Structure as a Class and datatype diagram . . . 21
3.6 Composition of the Connection Layer in the ConnectScene . . . 22
3.7 Construction of an atomic service widget . . . 22
3.8 Attributes widget composition inside an atomic service widget . . . 23
3.9 Mode properties widget composition inside an atomic service widget. . . 23
3.10 Entry and exit widgets composition inside an atomic service widget . . . 24
3.11 Parallel widget composition . . . 24
3.12 Construction of a composite service as a widget . . . 25
3.13 Construction of an AND/OR mode as a widget . . . 25
3.14 Construction of a list as a widget . . . 26
3.15 Construction of a SubModesScene for composite service widget . . . 26
3.16 Composition of entry, init, write, and exit widgets inside the composite service widget . . . 27
3.17 SubModesScene structure as a class diagram . . . 28
3.18 Composition of ConnectionLayer in a SubModesScene . . . 29
3.19 Construction of the AND(OR)ModeScene for AND/OR mode. . . 29
3.20 Composition of entry, init, write, and exit widgets inside the AND/OR mode widget . . . 29
3.21 XML Data file as a class diagram . . . 30
4.1 Diagram Editor View . . . 34
4.2 Additional Menu . . . 34
4.3 Console View . . . 36
4.4 Atomic Service . . . 37
4.5 Composite Service . . . 38 4.6 Sequential connection . . . 39 4.7 Parallel Connection . . . 39 4.8 AND Mode . . . 40 4.9 OR Mode . . . 41 4.10 Service List . . . 41
List of Tables
2.1 REMES interface operations. . . 6
2.2 Libraries compared . . . 9
2.3 Visual Library API abstract packages . . . 10
2.4 Visual Library API widgets subclasses . . . 11
2.5 Widgets Actions Types . . . 13
3.1 Container (Scene) representation definition . . . 17
3.2 Displayed element’s properties . . . 17
Chapter 1
Introduction
Over the last years, software systems have increased in complexity, which is led by a need to integrate and connect different applications and resources into new system scenarios, requiring new paradigms to contend with these new research challenges.
Service-orientation is seen as a new system design paradigm that provides the basis to deal with application and resource integration and composition by exploiting a loosely coupled and autonomous software entities called services. In literature we can find many definitions for the term ”service” with different meanings depending on the field of research [16] [21]. Broy et al. define a service as a provided interface module that can be offered by a system provider to a requester system [8].
In the context of system design, Service-oriented Systems (SOS) provide separation of service interface from the service implementation (or service behavioural description). Ser-vice interface information such as capacity, time-to-serve, type, etc., are available and visible to potential service users. This information is used by users to find and invoke on-the-fly services, most suitable for their needs. Alternatively, service implementation is hidden from users, but available to service developers. Service implementation provides information about a formal service representation, functionality, enabled actions, resources used, and interactions with other services [11]. Based on this inner description, the developer can im-prove a service with respect to required Quality of Service (QoS) or functionality and ensure also that the correctness of the behaviour remains unchanged. The service behavioural de-scription enables the developer to understand the service inner functionality, to interconnect services in a correct manner, and provide a better analysis about extra-functional properties of a service, such as availability, accessibility, integrity, performance, reliability, etc.. When trying to ensure the required level of QoS, a formal model of the service behaviour descrip-tion should be provided and analysed, which in most cases is not available, already at the design-time. The QoS reflects not only functional, but also extra-functional properties of the service/system. The concept of internal service description is similar in characteristics (e.g. reusability, composition) with previous paradigms (Object-oriented and Component-based paradigm), more concretely to their smallest functional units, objects and components. Un-derlying concepts for both Component-based Systems (CBS) and SOS are modularization (i.e., modules are made from splitting up the system functionality) and composition (i.e., modules are used in order to get the overall system behaviour). In Component-based Sys-tems (CBS) all components and connections between them are done offline, before the actual system is provided to users.
Based on the fact that SOS and CBS are similar to each other in many ways, it could
be beneficial to use a unified behavioural model for both paradigms [11]. Seceleanu et al. have introduced a behavioural modelling language, called REMES, which is a state-machine language for analysis of resource-constrained behaviour of a system [25]. ˇCauˇsevi´c et al. in-troduces an extension of the REMES language [10] towards SOS. The extension inin-troduces service-oriented features, such as service interface description (type, capacity, time-to-serve, status, pre-, and postcondition), Hierarchical Language for Dynamic Service Composition (HDCL), as well as means to check service compositions, making REMES suitable to be-havioural modelling and analysis of SOS. The benefit of having pre-, and postconditions lies in the fact that the constrains imposed during the system development, can be easily proven by checking the Boolean expressions for a given service setup. Also, by using HDCL, new services can be created, added, deleted, as well as connected sequentially, or in parallel. The requirements can be proved by checking the correctness of service compositions (Boolean relation between invoked services are being checked).
In the design framework developed within this thesis work, we have considered be-havioural description provided in the language REMES. The constructs provided by REMES have enabled us to build a graphical environment for behavioural modelling of services and support for easier manipulation and reasoning about system requirement specification us-ing formal techniques. Our framework comprises specialized cross-platform standalone Java tools and components to enhance the potential of SOS by focusing on intuitive service ma-nipulation. The dynamic and scalable aspects of service composition are integrated as a textual description language, providing the user with an easy mechanism to address on-the-fly manipulation of services.
1.1
Purpose
The purpose of this thesis is to provide a service-oriented design framework, by developing a Graphical User Interface (GUI) for service behaviour modelling based on the resource-aware timing behavioural language, called REMES. The thesis also contributes with an automated way of ensuring traceability between visual models and the textual description language, which intends to facilitate efficient design.
1.2
Outline
The thesis is divided in six chapters. In Chapter 2, we provide the background for the basic concepts of REMES language, its extension towards SOS and the description of the library used for displaying visual models. Chapter 3 describes relevant key concepts of im-plementation such as architecture, internal structure of the tool, composition of the internal visualization model. Chapter 4 comprises a detailed description of the GUI. In Chapter 5, we describe some ideas for possible further extensions of the provided framework. Chapter 6 discusses the achieved results and concludes the thesis.
Chapter 2
Preliminaries
In this chapter, we provide some preliminary explanations of a service behavioural modelling, tools and concepts used to develop this framework. Also, in order to choose the most appropriate underlying graphical management system, we have evaluated some popular available technologies and chose the one suitable for our purposes.
2.1
Behavioral Modeling of Services
When designing software systems one has to respect functional and non-functional require-ments. They should be the main driver and impact on the software architecture under construction. There exist a number of approaches used to describe SOS architectures [3, 4]. Many of these approaches end up at the level of individual services without providing the detailed internal behavioural description of a service.
In SOS, there is a clear separation between its interface and its behavioural description. Interface information is available to a service user. It specifies relevant informations, such as capacity, time-to-serve, pre-, and postconditions, etc., such that an available service is visible to other service users. On the other hand, service behavioural description (functional representation, enabled actions, used resources), is hidden from the service user, but avail-able to service developers. One may say that this approach is beneficial in terms of efficiency when a service is changed to fit with newly given user requirements. Also, developers can reuse existing services, significantly reducing time to develop new systems.
SOS is a new paradigm that evolves from the object-oriented computing and CBS paradigms, which makes it appropriate to try to adapt and extend existing approaches to fit with concepts of SOS. Also, as pointed out in [11] there are practical means for relat-ing SOS and CBS in the context of behavioural modellrelat-ing with support for formal analysis.
ˇ
Cauˇsevi´c et al.[10] have proposed an extension of the existing behavioural modelling lan-guage, called REMES. Since the work in this thesis is based on the REMES lanlan-guage, that was initially introduced for CBS, in the following we first describe the REMES language in context of CBS.
2.1.1
Behavioral Modeling of CBS
The basic units of CBS are component models. Component models are used in the develop-ment of component to describe their interfaces, dependencies, and composition mechanisms. CBS aims at supporting component reusability and efficient software development. In most
CBS, the design description usually ends up at the detailed description of behaviour in terms of interfaces, connectors, and protocols [27]. Also, in CBS components and con-nections between them are composed in advance, before the actual system is provided to users.
An approach that treats specification and modelling in component-based fashion is Pro-Com (A Pro-Component Model for Distributed Embedded Systems) [26]. The approach defines models as a group of hierarchical interconnected components. The components have well defined interfaces that provide a separation between data and control flow. ProCom model solely doesn’t include a formal definition of its behavior. To enable formal behavioural mod-elling and analysis Seceleanu et al. [25] have introduced a Resource Model for Embedded Systems (REMES) that provides a model and a state-machine based language for analysing resource-constrained behaviour of a system. In addition, REMES is used for specification of both functional and extra-functional behaviour of the components (timing, resource us-age, reliability etc.). REMES models can be transformed into the formal Timed Automata (TA) [24] or Priced Timed Automata (PTA) [6], and analysed with UPPAAL1or UPPAAL
CORA2tools. In the next section we provide more details about REMES.
2.1.2
Behavioral Modeling in REMES
The purpose of REMES behavioural language is to provide a meaningful foundation for timing and resource analysis within embedded systems. The language provides support for different types of resources, ”discrete such as memory, or continuous such as energy”. Initially the language was introduced for the specification, modelling, and analysis of CBS. The component behaviour is described by a REMES mode. A mode can be atomic (does not contain any sub-modes) or composite (it contains an arbitrary number of sub-modes). For transferring data between modes, REMES uses a data interface that consists of global and local variables of type Boolean, natural, integer, or array. The timing properties are expressed via clock variable, a special kind of variable that evolves at rate 1.
The control flow in a mode is defined by a set of directed lines called edges that connect modes at control points. REMES enable modelling of two types of actions, discrete and delayed actions. The first corresponds to a delayed/timed event action, while the latter is triggered by an instantaneous action that can be executed if the corresponding action guard holds. If the mode is decorated with an invariant, then one can say that its execution is bounded from above. In order for the mode to be executed invariant must hold. When it stops holding the mode is immediately exited through the exit point.
A mode can be defined as Urgent, meaning that no delay is allowed within a mode. Also it is possible to define a conditional operator that enables the selection of one edge out of two or more, based on a Boolean condition that guards the action. An action can be taken only if the guard evaluates to true. For more details on REMES language we refer the reader to [25].
One of the main features of REMES is the possibility to specify, model and reason about resource-wise continuous behaviour of systems. Every mode can be annotated with corresponding resources. The consumption of a resource represents the resource usage that occurs instantaneous in time, whereas the utilization of a resource is the rate of consumption over time. Consumption and utilization can be of monotonic or non-monotonic nature. Consumption can be considered as discrete or continuous. Also, resources can be classified on whether they are referable or non-referable. Based on this definition, Seceleanu et al.
1The UPPAAL tool is available at http://uppaal.com/
2.1. Behavioral Modeling of Services 5
[25] give a straightforward classification of resources. For example the energy resource is continuous and non-referable because it cannot be dynamically allocated and manipulated at run-time. For more details on this classification we refer the reader to [25].
2.1.3
REMES extension for SOS
Due to many similar concepts that SOS and CBS rely on, it might be useful to use a unified behavioural model for both paradigms [11]. So, rather than focusing the attention on how to develop a new service-oriented modelling environment, there are solid means to extend an already developed behavioural model for CBS. For this purpose, ˇCauˇsevi´c et al. [10] have identified REMES as suitable language for describing, modelling, and analysing SOS, for two main reasons: i) has precise semantics, ii) it is used for describing functional and non-functional behaviour of components. By extending REMES, the aim is to provide a service behaviour description needed for proper understanding of SOS. Unlike CBS that are composed offline, in SOS services are published, invoked, composed, and destroyed on-the-fly. They are more loosely coupled and more independent of implementation attributes than components are. This means that the service developer can create new services out of existing ones, on-the-fly, and that the newly created services should be able to comply to a desired QoS. The price to pay for all the mentioned benefits, is a list of challenges related to QoS prediction, lack of methods and tools for formally checking the correctness of service composition. It is obvious, that this paradigm of SOS still remains to be fully explored, developed, and utilized.
A service can be represented as an atomic or composite mode in REMES. For a service to be published and discovered, a list of attributes are exposed at the interface of a REMES mode. This attributes are defined as follows [10]:
– service type: defines if a service is a web service, database service or network service;
– service capacity: quantifies the capability of a service to process messages per time unit (∈ N);
– time to serve: defines the worst-case time needed for a service to respond and serve a given request (∈ N);
– service status: describes the current service status, passive, idle or active;
– service precondition: it is a predicate that conditions a service start and must hold in order for a service to be executed;
– service postcondition: is a predicate that must hold at the end a service execution.
By using this attributes, services can be discovered and retrieved based on the require-ments of the system. It is a case that services have to synchronize their executions. To pro-vide modelling of synchronized behaviour a special type of REMES mode, called AND/OR mode is introduced into the language [10]. These modes finish their execution at the same time from a service user perspective, but from an internal behaviour perspective, AND mode assumes that sub-services are entered at the same time, while the execution of sub-services in an OR mode is conditioned with a guard on their entry points. Also, AND/OR modes can be used with either ”and” synchronization (containing services are finalizing their ex-ecution at the same time), or ”max” synchronization (AND/OR mode exex-ecution come to an end when the slowest service terminate its execution). For more details about AND/OR modes we refer reader to [10].
Operation’s Syntax Command
create service name create : T ype × N × N × ”passive” ×(P → bool) × (P → bool) → service name
del service name service name → N U LL
create service list create list : service list → service list, service list = List()
delete service list del list : s list → N U LL add service name to service list add : s list → s list
del service name from service list del : service list → service list replace service name1 with service name2 replace : service list → service list insert service name1 in service list add : service list → service list
Table 2.1: REMES interface operations.
Hierarchical Dynamic Composition Language (HDCL) was introduced to support service composition [10]. In order to support run-time manipulation there is a need for defining a set of operations. As depicted in Table 2.1, one can create and delete a service. The symbol P represents the set of service states. Also, services can be added, removed, or replaced in a service list [10]. An example of a service list is given as follows:
service list = [service name1, ..., service namen] (2.1)
The service list is created empty, while services are added later. Also, the user can access elements by using a index position p, facilitating the usage of operations like replace service or insert service.
Services can be viewed as independent and distributed units that can be composed to create new services (to fulfil requirements that often evolve continuously and there for require adaptation of an existing solution). A dynamic service composition, that facilitates the modelling of nested services, is defined in [10] as follows:
DCL = (service list, P ROT OCOL, REQ); (2.2)
HDCL = (((DCL+, P ROT OCOL, REQ)+, P ROT OCOL, REQ)+, ....); (2.3) The formulas 2.2 and 2.3 describe an infinite degree of nesting. The positive closure operator + is used to express that one or more DCLs are nested to form an HDCL. The PROTOCOL defines the way services are composed (the type of the binding between services), as follows:
P ROT OCOL ::= unary op service name|service name1 binary op service name2 (2.4)
The operators defined in formula 2.4 are:
unary op = exec f irst (2.5)
binary op = ; (sequential) | || (parallel) | || SY N C and | || SY N C or. (2.6)
2.2. Graphical Libraries and Frameworks Evaluation 7
– exec f irst: specifies witch service should be initially executed in a composition;
– sequential composition(; ) : the services are executed in the specified sequence, one after the other, uninterrupted;
– parallel composition(||): one or more services can be executed;
– parallel composition with AN D synchronization: services are entered at the same time;
– parallel composition with OR synchronization: one or all constituent services are entered;
The requirement REQ, as represented in formulas 2.2 and 2.3, is a predicate that includes both functional and extra-functional proprieties of the system. It identifies the required attributes constrains, capability, characteristics, or quality of a system such that it exhibits the value and utility requested by the user.
Service refinements are done by weakening or strengthening the service pre- and post-condition in order to check if the result of the correctness check does not satisfy the REQ given by a service user. The strongest postcondition technique that facilitates the forward analysis technique is used to provide the correctness check. In [10] forward analysis tech-niques are used to provide correctness check of a REMES service. Assuming p and q are predicates that describe the initial and the final state of the service, and S is a service, the notation {p} S {q} means that if p holds, than S is guaranteed to finish with the condition q true. An example of an assignment statement can be given as follows:
{p(x)} x = e {q(x)} (2.7)
{x = 0} x = x + 2 {x = 2} (2.8)
The strongest post condition sp.S.p states that if p holds than the execution of S results in sp.S.p being true. This means that sp.S.p ⇒ q. For our example in formulas 2.7, 2.8 the strongest postcondition can be determined as follows:
sp.(x = e).p(x) ≡ x = e ∧ (∃x · p(x)) (2.9)
sp.(x := x + 2).(x = 0) ≡ x = x + 2 ∧ (∃x · x = 0) ⇒ x = 2 (2.10)
The correctness proof is reduced to checking the strongest postconditions as determined in 2.10. For a more thorough description of correctness check for a REMES service refer to [10].
2.2
Graphical Libraries and Frameworks Evaluation
A part of this thesis work is to investigate which standard libraries to employ, and which adaptations are required, in order to create a standalone Java application for modelling REMES services. In the past 20 years, we have witnessed a huge expansion in visualization design, which is the underlying technology of every modelling tool. Some of the popular technologies are: TreeMaps [20], Graph Visualization Framework(GVF) [5], infovis toolkit [15]. Numerous visualization libraries and frameworks exist, either commercial (yFiles [28]
and Tom Sawyer Visualization) or open-source( Prefuse [19], NetBeans Visual Library API, JGraph [2], Eclipse Graphical Editing Framework [9])
In the following, we provide an evaluation on several approaches that were chosen as the possible candidates. We describe how the evaluation was realized by stating the candidates and explaining the result of the assessment.
2.2.1
Motivation
In a modelling tool, the GUI is designed such that a user can draw diagrams on the screen almost as one would on paper. These drawing structures cannot be managed by a regular interface structures like tables, trees or lists and the capabilities go beyond regular GUI libraries like AWT or Swing [13]3. We have decided to evaluate different approaches for this
standalone modelling tool before going into the actual development process.
2.2.2
Comparison of Graphical Libraries and Frameworks
Although visualization or graphical frameworks technologies have been proven indispensable tools for creating and representing complex structures, it is often difficult to find or to build a software framework for creating dynamic visualizations of both structured and unstructured data. In order to get satisfactory level of performance, usability, and possibility for further development, the library that is to provide this, should be based on the standard libraries that can operate with other Java GUI technologies like Swing.
We have found four libraries that are the most customizable and easiest to use. We have further investigated and compared each by different criteria in order to determine the best library for our needs. The assessed criteria includes customization, API documentation, samples, stability and license. In the following we provide a short description of each of these four libraries.
Prefuse is a set of software tools for creating rich set of features for data modelling, visu-alization, and interaction. It supports components for layout, panning, zooming, interaction and rendering, and also provides data structures for tables, graphs, and trees. It is only available in a beta version and the documentation is not as complete as we might expect.
NetBeans Visual Library is intended for visualization purposes with support for graph-oriented modelling. It is a part of the NetBeans Platform [7], but it is possible to used it as a standalone library by adding the .jar files to the Java application class-path. The library comes with comprehensive documentation and there is a growing community behind it. It is based on the JFC Swing and has a similar programming representation. It supports zoom in/out, collapse/expand, and the possibility to encapsulate Swing components inside the visualization.
Eclipse Graphical Editing Framework(GEF) allows developers to build rich graphical editors from an existing application model. It consists of plug-ins to the Eclipse Platform [14] provided for use only within the Eclipse. There is an extensive documentation on how to use and extend GEF.
JGraph is a feature-rich, standard-compliant, and open-source graph component, recom-mended by the open-source community [2]. It has an extensive documentation [1] on how to use the API. It is a low level library and is oriented more towards design layout. JGraph is a full-size library that provides a broad functionality set. It supports various back ends such as XML, database, edge editing, drag and drop, selection and many other functionalities.
2.3. Visual Library API 9
Criteria Prefuse Visual Library Eclipse GEF JGraph API Documentation No Yes Yes Yes Model Customizability No Yes Yes Yes Release status Beta Yes Yes Yes
Standalone Yes Yes No Yes
Table 2.2: Libraries compared
In Table 2.2, we show and overview of each candidate based on the chosen criterion. After some initial investigation, we have eliminated Prefuse due to lack of documentation and orientation on low level design layout. The major drawback of Eclipse Graphical Editing Framework’s (GEF) is its native integration with Eclipse Platform. In order to use it within a standalone application the designer should develop an underlying modification program that has to be updated with every new version of GEF. JGraph has an extensive manual and a thorough collection of modelling features. However, JGraph is oriented on the design layout and the programmer needs a lot of experience to get a usable application in a short time.
NetBeans Visual Library was chosen since it provides the best overall performance, it is constructed in a Swing-like composition, a superior functionality, and complete documen-tation. It is also a high level API which makes it less complicated for large applications. Regardless of the fact that the implementation would be possible with any of these libraries, the work in this thesis related to graphical modelling of services is designed with Visual Library API as an underlying base.
2.3
Visual Library API
The NetBeans Visual Library API is a high-level graphical library. It is designed to support applications that need to display editable diagrams or graphs. The library can also be used by applications that are not built upon the NetBeans Platform. The libraries that are needed for running a Visual Library API application are openide-util.jar and org-netbeans-api-visual.jar.
As shown in Table 2.3, the API provides a set of reusable packages. By using them the developer is creating visualization diagrams. Each package contains a set of predefined widgets, models and actions. In the next sections, we explain these reusable components.
2.3.1
Visual Library API Architecture
The Visual Library API is comparable in implementation to Swing library. It provides a large set of reusable pieces or widgets. A Widget is very similar to Swing’s JComponent. The main class of all graphic components is the widget class. A widget can also be a container for other widgets. Each widget has a location relative to its parent. The widget main class is responsible for representing the border and background.
A widget has a certain layout responsible for the positioning of its childs. They depend upon each other in order to be notified about changes and can also be linked to a series of actions that are executed when specific user events occur.
Figure 2.1 shows a class diagram representing a top level architecture of the Visual Li-brary API. The topmost widget is always a widget called scene. It forms the bridge between
Package Description
org.netbeans.api.visual.action Built-in widget actions.
org.netbeans.api.visual.anchor Defining an edge’s source and target point. org.netbeans.api.visual.animator Controlling animations on a scene.
org.netbeans.api.visual.border Border graphics for a widget. org.netbeans.api.visual.export Export a Scene to an image file.
org.netbeans.api.visual.graph Contains Built-in graph-oriented models. org.netbeans.api.visual.graph.layout Built-in graph-oriented layout algorithms. org.netbeans.api.visual.laf Style definition for colors and borders. org.netbeans.api.visual.layout Widget-layouts.
org.netbeans.api.visual.model Model-objects with widgets on the scene. org.netbeans.api.visual.router Defines a router or a path for an edge. org.netbeans.api.visual.widget Widget class.
org.netbeans.api.visual.widget.general High-level widgets.
Table 2.3: Visual Library API abstract packages
Swing and the Visual Library API, by providing a JComponent using the createV iew() method that displays the contents of scene. In comparison with Swing components, widgets have a non-fix shape.
2.3.2
Widget Class
In Visual Library API the central graphical component is a widget. This class provides information relevant to different functionalities like preferred size, foreground, background, tooltip, and font. A widget is a graphic super class equivalent to the JComponent class in Swing. From the widget, many classes are derived (see Figure 2.2), each with different visual representation and behaviour. Table 2.4 provides an outline of various predefined widgets types. For more comprehensive descriptions of these classes, see the Visual Library API documentation, found within the Javadoc of the Visual Library [23]. Each widget has different interfaces used to provide different graphical functionality. Below, we provide the description for the most important.
Every widget can be displayed with a border. The default setting is an empty border. By using the method setBorder() another border can be used. The border corresponds to a interface implements numerous sub-classes like LineBorder, ImageBorder, ResizeBorder, and SwingBorder.
Widgets can have a layout defined by the interface called Layout. The layout defines how the child widgets are arranged. There are four different layouts available: AbsoluteLayout, FlowLayout, CardLayout, and OverlayLayout. With AbsoluteLayout, the child widgets are arranged corresponding to the coordinates of the parent widget. By default a widget has this kind of layout. The FlowLayout is used for arranging widget in sequential order in vertical or horizontal direction (createHorizontalFlowLayout() and createVerticalFlowlayout()). It is possible to enable the alignment with a gap between individual widgets. A CardLayout determines the currently active widget and makes the other widgets invisible. OverlayLayout shows the widget and the child widgets in a minimum area and arranged on top of each other. A widget is defined by a static information like content, position or size. When working on a GUI application the developer needs to use in some way the behaviour of a widget.
2.3. Visual Library API 11
Class Description
ComponentWidget This widget is used for displaying and updating the SWING components.
ConnectionWidget This widget is used to connect two points.
ImageWidget This widget is used to represent an image within a scene. LabelWidget This widget is used to display a text.
LayerWidget Transparent Widget.
LevelOfDetailsWidget Containter for multiple widgets. Offers some visibility functionality when zoom action is used.
Scene Is a widget used as a super-class for the displayed widgets. ScrollWidget Scrollable widget.
SeparatorWidget This widget is used to display a separator object. IconNodeWidget This widget is used for displaying an image and a label
in the same element.
Table 2.4: Visual Library API widgets subclasses
Figure 2.1: NetBeans Visual Library Architecture as a Class Diagram
A widget in Visual Library API can hold a behaviour by means of adding an action that corresponds to a specific event. Many of the predefined actions are automatically performed
Figure 2.2: Simplified widget hierarchy
(moving, selecting or resizing of a widget). Actions are usually created using ActionFactory class. They are specified by the WidgetAction interface. An event like clicking the left mouse button can trigger a method corresponding to this interface. Table 2.5 illustrates some of the actions used frequently in this work.
2.3. Visual Library API 13
Action Description
AddRemoveControlPointAction This action can be used by ConnectionWidget widgets. By using it, you add or remove control points by double-clicking them.
MoveAction By using the MoveAction, a widget can be moved by drag-drop method. The only constraint is that the parent widget has the default layout.
ResizeAction By using this action, the developer can change the size of widgets on the scene.
This action is useful when you want to create expandable widgets or widgets with
other widgets inside.
ConnectAction By using the ConnectAction, the developer can connect two widgets.
HoverAction With the HoverAction, the developer can use an action when the user is hovering
the mouse over a widget.
SwitchCardAction The action is used for switching between child widgets that are contained in a CardLayout.
Table 2.5: Widgets Actions Types
2.3.3
ConnectionWidget Class
To connect two widgets we can use another class, named ConnectionWidget. This class holds a source and a target, that corresponds to two widgets, as anchors. They are used to represent a path between two specified points.
The visual appearance of the connection can be modified by using different anchor shapes or routers . The router specifies a line path, which is by default a straight line between source and target. An orthogonal router can be also applied instead, and multiple intermediate points can be set or deleted. For more information about router for connections refer to Visual Library API documentation [22].
2.3.4
LayerWidget Class
An important type of widget is the LayerWidget. Similar to JGlassPane from Swing, it is a transparent layer that can be used to manoeuvre some temporary layers that are being changed very often in a scene.
2.3.5
The Scene: The Root Element
All widgets, when created are children of a scene. A scene is an extension of a widget that contains functions for rendering and repainting all objects on the screen. When a widget is updated these functions are automatically called to repaint the scene. One can think of the scene class as the root node of a tree hierarchy of widgets. Scene widget has a number of methods useful for GUI integration, one of them is createV iew() which provides a JComponent view that can be embedded into any Swing components.
The Scene class is extended by various classes like ObjectScene, GraphScene, and the most relevant for our work, GraphPinScene.
2.3.6
Model-View and GraphPinScene
Widgets in Visual Library API are not generically associated with a data model. That is, a widget owns only information about the graphical flow of data. In order to extend the scene, classes like GraphScene or GraphPinScene are used. Building a data model on top of a scene and making available some specific methods for assignment to a data model, are important features for widget management.
GraphScene and GraphPinScene are two abstract classes, suitable for graph-oriented modelling. The only task is the creation and management of data models and widgets. Creating the widget is achieved by using the relevant abstract methods within the subclasses. GraphPinScene is using a model with nodes, pins and edges. One or more pins can be attached to a node and edges can connect a source pin with a target pin. Also, there is a biding between the widget model and the graph objects by using a unique id and entity, attributes, and relations.
The attachNodeWidget() method is used to create nodes. Similar to creation of edges the method attachEdgeWidget() is used. ConnectionWidget class is used as parent widget for every connection when drawing edge paths. Also, it enables a router to determine the correct path for an edge, so that no intersections occur. To simplify the developer’s creation of routers, Visual Library API comes with a built-in class named RouterFactory. Pins are created with the attachPinWidget() method. As explained in this section, a pin can be an input or output of a node to which an edge can be connected. One or more pins are assigned to a node. The developer can use findWidget() method for support in determining what node is the parent widget in which the created pin is added. To specify a start and an end point for an edge, Visual Library API is using two methods to specify a start and an end point for an edge: attachEdgeSourceAnchor() and attachEdgeTargetAnchor().
Chapter 3
Implementation
In this chapter, we describe the implementation of Java GUI application for service be-haviour modelling based on REMES resource model. As depicted in Figure 3.1 the GUI is based on NetBeans Visual Library API to display the models and Swing Library1 as the
user interface toolkit.
The tool is implemented as a client frontend for behavioural modelling of services. The model implemented is based on REMES language and REMES extension for SOS, both introduced in Chapter 2.
The tool is developed to facilitate concepts of behavioural modelling of both components and services, introduced in REMES language.The client frontend is responsible for graphical specification of services and their attributes, and composed them at runtime. It provides graphical environment to specify, model and compose REMES services.
3.1
Tool Architecture
In this section, the GUI architecture is explained. Also, a description of the traceability between the REMES model and a hierarchical language for service composition is provided. The application is split into several functional units. Here is a list of all top-level units:
– Diagram Editor View (DEV): Top level unit in charge for opening a new diagram editor. It is responsible for displaying the diagram. It uses the NetBeans Visual Library API to render the scene. Contains the Display Model used internally by the tool for the graphically enriched graph.
– Console View (COV): Supports diagram for HDCL transformation, where services and their correctness conditions can be specified.
– Data Model: Is used for diagram storing purposes. It saves the data from DEV to a XML2 document file.
Data model and display model are used for representing and manipulating the diagram. Both models are based on the REMES service behaviour model. The main container for the
1Is a rich set of components for building GUIs and adding interactivity to Java applications. Swing is part of the Java Foundation Classes (JFC).
2XML is a standard way of encoding text and data so that content can be processed and exchanged across diverse hardware, operating systems, and applications[17].
Figure 3.1: Design Framework and Technology Utilization
editor is the diagram that contains services, AND modes, OR modes, parallel connectors, and service list constructors.
3.2
Scene hierarchy of elements
Table 3.1 describes some requirements based on REMES model [25] and service extension specifications [10]. A container is defined as the root element of the hierarchy of displayed elements. The main container is represented by a REMES service diagram. The diagram contains six special child elements: atomic and composite service, AND/OR mode, parallel connector, and list constructor.
The services are connected via edges on control points. Let us assume that two services (be it atomic or composite) are invoked at some point in time. Their instances can be composed as follows:
3.3. Models for REMES Service Diagram Manipulation 17
Container(Scene) Child
REMES service diagram REMES composite service REMES atomic service AND mode
OR mode
Parallel connector List constructor REMES composite service REMES atomic service
Conditional connector AND/OR mode REMES atomic service
Table 3.1: Container (Scene) representation definition
Elements Properties
REMES composite service Name, control points ( init point, entry point, exit point, write point), service attributes, constants, variables, and resources
REMES atomic service Name, control points (entry point, exit point), service attributes, constants, variables, and resources AND/OR mode Name, control points (Entry point, exit point) Parallel connector Control points (entry point, exit point) List constructor Name, requirement
Conditional connector Control points (entry point, exit point)
Table 3.2: Displayed element’s properties
that are executed in a sequence, uninterrupted;
– Parallel composition - services are composed in a connection using parallel connec-tors;
– AND/OR synchronization - services are added inside a AND/OR mode for syn-chronization;
The composite service can be seen as a container for another hierarchy structure of atomic modes and conditional connectors. Inside it, edges are defined with the following properties: action guard (contains the condition that should be fulfilled in order to execute the edge) and action body (information to be updated by the edge execution). Also, we can consider AND/OR modes as composite modes that contains as sub-modes the services that need to be synchronized.
In Table 3.2 we define the elements and requirements to design the data model. We use this information when defining the constituent components of every scene.
3.3
Models for REMES Service Diagram Manipulation
The tool uses two different models for representing and manipulating the diagram: data model for the transfer of data from DEV to COV and display model for displaying the diagram. Data model is converted into display model whenever a diagram is opened in
DEV. The advantage of using two different models comes from the practical issue of diagram representation and storing. For example, the information related to border displaying of a node is undefined in the data model but it’s predefined in the display model.
The tool saves every node in display model to a corresponding node in data model. Every new node in display model represents exactly one node in data model. Figure 3.2 shows a lifecycle diagram of interactions between the two employed models. Generating a data model from the display model is useful for storing the diagram. Therefore, a predefined structure needs to be created in order to represent the data model file. As depicted in Figure 3.2, GraphScene Manager is reading the data model and is building a memory representation of it. When DEV is opened from an existing data model it is converted automatically to a display model representation in order to be shown on screen. DEV uses NetBeans Visual Library API to show the display model. More details about these models are provided in the following sections.
Figure 3.2: Display and Data Models Lifecycle
3.3.1
Data Model Structure
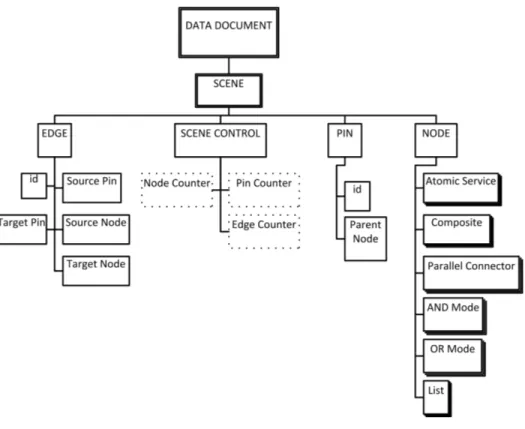
In order to store the diagrams we use an XML style document. Although, there are some disadvantages in using XML, such as slow access to data due to parsing and text conversion, it seems a natural choice to use it since it is portable and has a structured description. Figures 3.3, and 3.4 show the hierarchy of elements derived from the requirements defined in Section 3.2.
The top-level element, that contains a Scene child element, is called data document. We create a scene element for every diagram. As depicted in Figure 3.3, a scene element has exactly one scene control child element, which describes the number of nodes, number of edges, and number of pins stored in a diagram. This information is useful when the diagram is reloaded from the saved file.
A scene element can have an arbitrary number of node, edge, and pin child elements. There are six types of nodes included, which are shown in Figure 3.4: Atomic Service,
3.3. Models for REMES Service Diagram Manipulation 19
Figure 3.3: Data file Structure for Edge, Scene Control, and Pin element
Composite Service, Parallel Connector, AND Mode, OR Mode, and List. All of these types are in accordance with the requirements described in Section 3.2. Every node has a unique
Figure 3.4: Data file Structure for Node element
identifier. Additionally, every type of node has distinctive child elements. For example the Composite Service node has a name, service attributes (pre-, postcondition, time to serve,
capacity), mode properties (constants, variables, and resources), and one location element. The location stores the coordinates of the node in the diagram. A similar mechanism is used for edges; they are referenced via their unique ids. An edge is defined by the identifiers of its source and destination node and the id of the pin at which the edge starts and ends. Pin child elements are identified by a unique id and the id of the parent node where they are created.
3.4
DEV and Display Model
The display model is comparable in structure to the data model with the only distinction that it contains information about nodes, pins and edges important for DEV. When a new editor window is opened, the user can create a new blank display diagram or can load an existing data model file. There is no semantic difference concerning the diagram, between data and display model: every node, edge or pin produces exactly one output in the display model.
DEV is responsible for displaying the diagram. It uses the NetBeans Visual Library API to render the graph. The main class of DEV is named ConnectScene and it extends the GraphPinScene class. The management of elements is also included in ConnectScene class using widgets to hold reference information about the diagram. By having a GraphPinScene structure, ConnectScene is in charge of managing every diagram element as a node, pin, or edge.
The diagram in Figure 3.5 shows a simplified data structure of classes used in Con-nectScene. The class GraphPinScene is coloured with blue to show that it is a built-in Visual Library API class. ConnectScene widget is the root element in our diagram hier-archy. It is responsible for rendering the main diagram area. ConnectScene is composed of four layers of type LayerWidget: MainLayer (all nodes are defined and used within this layer), ConnectionLayer (all edges are defined and used within this layer), InteractionLayer (it is used when the user wants to connect two nodes by an edge), and BackgroundLayer. All layers are transparent and are used to organize different types of widgets.
As depicted in Figure 3.6 for managing edges we provide a separate LayerWidget named connectionLayer. The creation of edges is dependent on this layer’s subclasses and is reliant upon ConnectScene. The attachEdgeWidget() method is responsible for creating edges be-tween nodes. A ConnectionWidget is used to enable the use of a router for selecting a path of edges between two nodes.
For managing the interaction between nodes and edges we use a separate LayerWidget named InteractionLayer. Connections are added in ConnectScene when the user takes a specific action. Implementation of this action class executes the creation of edges between nodes. MainLayer is a separate LayerWidget where nodes are created in ConnectScene. As depicted in Figure 3.4, there are six types of widgets available as nodes: atomic service widget (equivalent to a REMES atomic service that implements a REMES atomic mode), composite service widget (equivalent to a REMES composite service that implements a REMES composite mode), AND composition widget (a REMES AND mode), OR composi-tion widget (a REMES OR mode), parallel widget, and list widget (a List Constructor). All elements have different attributes, properties, and descriptions depending on the require-ments defined in Section 3.2
3.4. DEV and Display Model 21
Figure 3.5: ConnectScene Structure as a Class and datatype diagram
3.4.1
An Atomic Service Widget
Figure 3.7 shows a schematic diagram representing an atomic service widget. The outer black border is the border of the widget. Inside the main widget, a VerticalFlowLayout is used to arrange the inner elements in a vertical layout. In the top part, the widget image and widget name are located. We use also some horizontal divider lines that are realized by using a separator widget. In the lower part of the atomic service widget, we have divided service attributes and mode properties in two specialized widgets. Inside these widgets, all sub-components are arranged in VerticalFlowLayout in order to stack them vertically.
Attributes widget is depicted in Figure 3.8. This widget is the visual representation of service attributes, as described in Section 2.1.3. It controls how attributes are drawn in ConnectScene. In the upper part of the widget, we have implemented a LabelWidget
Figure 3.6: Composition of the Connection Layer in the ConnectScene
Figure 3.7: Construction of an atomic service widget
named attributes label widget. When the user clicks on this label, a SwitchCardAction() method is called. This action is required for switching between widgets that are located in attributes container. When the user collapses attributes container, only the attributes label is shown in the parent widget. When expanding the active widget, all components contained in attributes container are shown. Inside attributes container, a vertical flow layout is used to arrange the inner elements. These inner elements are of type ComponentWidget and therefore used to display and update a Swing component.
Mode properties widget is depicted in Figure 3.9. This widget is the visual representa-tion of constants, variables and resources (also called mode properties) that are attached to a REMES mode. It extends the Widget class and controls how mode properties are drawn on the scene. In the upper part of the widget we have implemented a label named Mode-PropertiesLabel widget. When the user clicks on the label a SwitchCardAction() method is selected. This action is required for switching between widgets located in properties con-tainer. When properties container is collapsed, only the attributes label widget is shown. When switching the active widget, the widgets contained in properties container are shown. Inside this container, a vertical flow layout is used to arrange the inner elements.
Atomic service widget has two pins as control points: entry pin and exit pin. When created in the diagram, automatically this two pins are attached to an atomic service widget by calling attachP inW idget() method as shown in Figure 3.10.
3.4. DEV and Display Model 23
Figure 3.8: Attributes widget composition inside an atomic service widget
Figure 3.9: Mode properties widget composition inside an atomic service widget.
3.4.2
Parallel Connector Widget
Figure 3.11 shows a schematic diagram that represents a parallel widget. This type of widget is used to model a parallel connector. We consider that a parallel connector widget
Figure 3.10: Entry and exit widgets composition inside an atomic service widget
is a widget annotated with entry and exit points. In order to give it a circle-like form, we use a function name paintW idget() which uses the Graphics2D instance acquired from Scene.getGraphics method within the Visual Library API.
Figure 3.11: Parallel widget composition
In order to represent services in a parallel composition, two widgets are created, one at the start of the composition and the other at the end. Between two parallel widgets, services can be connected as a part of the parallel composition.
3.4.3
Composite Service Widget
Figure 3.12 shows a schematic drawing of a composite service widget. The outer black line is the border of the widget. Inside the widget, a vertical flow layout is used to arrange the inner elements in a vertical layout. In the top part, the image and name widgets are located. In the lower part of the composite service widget, we have divided the service attributes and mode properties in two specialized widgets. Inside these widgets, all sub-components are arranged in vertical flow layout in order to stack them vertically.
From the requirements defined in Section 3.2, we know that a composite mode can contain any number of atomic modes. Therefore, to implement a nested display model we use a ComponentWidget as a container. By using this type of widget another scene can be declared inside it. This sub-scene represents the connection between the composite service control points and the control points of its sub-modes. We define here the sub-scene as the inner container which shows the sub-modes.
3.4.4
AND/OR Mode
Figure 3.13 depicts an AND/OR mode widget, which is a display model of a AND/OR mode. A vertical flow layout is used to arrange the inner elements in a vertical layout. In
3.4. DEV and Display Model 25
Figure 3.12: Construction of a composite service as a widget
the top part, image widget and name widget components are located.
Figure 3.13: Construction of an AND/OR mode as a widget
AND/OR mode is a special kind of mode which contains as sub-modes services. There-fore, in the lower part of the AND/OR mode widget, we implement a nested display model that uses a ComponentWidget for representing the connection between the AND/OR mode control points and control points of its sub-modes.
3.4.5
List Widget
In order to implement a visual representation of a list we have composed a special kind of resizeable and transparent widget. The widget, as shown in Figure 3.14, is created with a resizeable border by using the class ResizeBorder in order to expand the widget over other widgets. In the top part of the list widget we include an image widget, name widget, and a requirement predicate widget. This requirement widget represents a requirement (REQ), as defined in Section 2.1.3.
Figure 3.14: Construction of a list as a widget
3.5
Composite Mode Scene
The main container for a composite service widget is modelled as a ComponentWidget. Within this class we use a JComponent, which serves as a placeholder and is responsible for displaying and updating the contained sub-scene. This sub-scene, as shown in Figure 3.15, is called SubModeScene and it extends the GraphPinScene abstract class. The function of SubModeScene is to manage widget mapping to an associated data model, which is in our case a structure with two types of nodes (atomic modes and conditional connectors), entry and exit pins, and edges annotated with guards and actions.
Figure 3.15: Construction of a SubModesScene for composite service widget
Four pins are attached to a composite service widget: entry, init, write, and exit. When composite service widget is created, four pins are graphically attached with the attachP inW idget() method, as shown in Figure 3.16. These pins are defined in Con-nectScene class, which is the external scene. Inside composite service widget, we create four additional pins defined in SubModesScene, which is the internal scene. These inner pins correspond to the outer pins. The idea behind this graphical container is to describe a control flow between ConnectScene and SubModesScene using Visual Library API.
The diagram in Figure 3.17 shows a simplified data structure of classes used in Sub-ModesScene. The abstract class GraphPinScene is coloured with blue to show that is con-tained in Visual Library API. SubModesScene is the root element of a composite service widget. It is responsible for control and representation of the rendered area inside a com-posite service widget. SubModesScene extends the GraphPinScene. Like ConnectScene, is represented by four transparent layers of type LayerWidget: MainLayer(atomic modes and
3.6. AND/OR mode scene 27
Figure 3.16: Composition of entry, init, write, and exit widgets inside the composite service widget
conditional connectors are defined and used within this layer), ConnectionLayer(edges are defined and used within this layer), InteractionLayer (used when the user wants to connect two nodes by an edge), and BackgroundLayer.
For managing edges inside SubModesScene we provide a separate LayerWidget named ConnectionLayer. The creation of edges depends on the layer’s subclasses and it relies upon the SubModesScene. As shown in Figure 3.18, all edges in SubModesScene are marked with guards and actions. For managing the interaction between nodes and edges in SubModesS-cene we use a LayerWidget. MainLayer is a separate LayerWidget used in the same way as described for ConnectScene.
3.6
AND/OR mode scene
An AND/OR mode contains as sub-modes services needed to be synchronized. In order to model the inner container, we have introduced a new ComponentWidget class, as depicted in Figure 3.19. Within this class we set up a JComponent, which serves as a container for the current hierarchy of displayed service widgets. Similar to composite service widget, we define a sub-scene inside the JComponent. The sub-scene function is to manage widget mapping to an associated data model, which is in our case a structure with one type of nodes (atomic services), entry and exit pins, and edges annotated with guards and actions. As shown in Figure 3.20, two pins are attached to the AND/OR mode widget: entry and exit pins. These pins are mapped to ConnectScene class. Internally we create two additional inner pins which are mapped in AND(OR)ModeScene. These inner pins are correspondent to the outer pins. The role of this container is to compose a control flow relationship between ConnectScene and AND(OR)ModeScene.
Like ConnectScene, AND(OR)ModeScene is represented by four transparent layers of type LayerWidget: MainLayer (atomic services are defined within this layer), Connection-Layer (edges are defined and used within this layer), InteractionConnection-Layer (it is used when the user wants to connect two nodes by an edge), and BackgroundLayer.
Figure 3.17: SubModesScene structure as a class diagram
3.7
Console View
Console View is a functional unit responsible for transforming a diagram model (data model) to a textual description of a service and their attributes. It supports also specification of service’s correctness conditions using strongest post condition predicate transformer [12]. Because our framework is based on Java, we have used parsing and manipulation of XML documents with one of the most well known standards called DOM (Document Object Model)3.
3.7.1
Parsing with DOM
DOM defines the API of a parse tree for XML documents. The org.xml.dom.Node interface specifies the basic features of a node in this parse tree. Document, Element, Entity, and Comment interfaces are defining the features of specific types of nodes.
3The DOM API is a standard defined by the World Wide Web Consortium (W3C); consists of the org.w3c.dom package and its subpackages.
3.7. Console View 29
Figure 3.18: Composition of ConnectionLayer in a SubModesScene
Figure 3.19: Construction of the AND(OR)ModeScene for AND/OR mode.
Figure 3.20: Composition of entry, init, write, and exit widgets inside the AND/OR mode widget
The DOM API enables the XML parser to specify a structure. The content of the XML document is parsed in the form of a tree. The DOM tree consists of several nodes that
represent elements, text, etc. defined in the XML document4. These nodes are arranged according to the structure of the XML document. The XML parser stores the DOM tree in memory. The DOM tree enables an application program to access and modify the XML document it represents.
There are couple drawbacks related to use of DOM processing model [18]:
– DOM is a memory intensive because the parsed document is instantiated into memory before it can be used;
– DOM is slow when used for processing large XML documents.
3.7.2
Generating the hierarchical language from the data model
An XML parser is a software module that reads an XML document and verifies that the con-tent and structure of the XML document conforms to the rules specified in its corresponding grammar(i.e. DOM). Data model is used to store the diagram in an XML document. Based on this stored model we can generate automatically the declarative part of the on-the-fly service composition defined in [10].
Figure 3.21: XML Data file as a class diagram
Figure 3.21 shows the XML Parser class. This class uses four types of classes in order to parse the XML file. The classes are defined as follows:
– Service class: stores the information for both atomic and composite services, and it has as parameters the service id, the service name, all 6 attributes (type, capacity, time-to-serve, status, pre-, and postcondition) and the X and Y coordinates for the location;
– Connect class: stores the information for the sequential connectors and has as pa-rameters the connector id, the source and the target of the connection;
3.7. Console View 31
– Parallel class: stores the information about the parallel connectors and has as pa-rameters the connector id and X and Y coordinates for the location in diagram;
– ServiceList class: stores the information about the list used in the diagram and has as parameters the list id, list name, the X and Y coordinates, height and width, and the DCL/HDCL name.
We use getElementsByT agN ame() method to return a node list of all elements defined in the data model. The node list is an abstraction of an ordered collection of nodes, without defining or constraining how this collection is implemented. From this node list we retrieved all the necessary child elements using the getAttribute() method.
The retrieved information is used to form a list of elements of different types like: Service, Connect, Parallel, and ServiceList. After all the information from the XML file has been organized we can start to manipulate the information. The needed services are introduced through the declarative part as follows:
declare service name ::=< name, type, capacity, time to serve, status, pre, post > (3.1)
The instances of the selected services and service lists are created:
create service name; create list name; (3.2)
After the lists are created we add to the list all the services that are modelled in the diagram:
add service name to list name; (3.3)
At this point we can establish which service belongs in which service list, by checking which service has its coordinates inside the service list area, that is calculated from X, Y coordinates, height and width elements retrieved from the data model. Finally, nested services are composed by DCL [10]:
DCL count ::= (list name, P ROT OCOL, REQ) (3.4)
To provide means to compose the existing DCLs with other services or DCLs, we introduce a HDCL nested composition as follows:
HDCL count ::= ((DCL count+, P ROT OCOL, REQ) (3.5) The ”+” operator is used to express that one or more DCLs and/or services are nested through HDCL. The protocol defines the way services are composed. Checking the require-ments is shown in the form of the strongest postcondition predicate transformer [12] as follows:
check(sp.(system composition).(system precondition) => (system requirements)) (3.6)
At this moment the algorithmic computation of strongest post-conditions for HDCL is not yet implemented, and therefore we only show that we can automatically derive the check operator in the correct form.
3.7.3
Generating the data model out of hierarchical language
There are cases when we want to generate data into the diagram from the HDCL declara-tions, for example when the user modifies some service attributes. We parse the information
contained in HDCL declarations and we convert them into the data model. HDCL decla-rations are saved in a file. We use two java.util5 classes: Scanner and regex. By using the
Scanner class we break the file into tokens using a delimiter pattern. The resulting tokens are converted into values by using various next methods.
We use nextLine() method defined in Scanner class to parse troughout every line in the HDCL file. Using hasN ext(String pattern) method we determine which lines are starting with ”declare”. Using the method:
f indInLine(”declare(.+) ::=< (.+), (.∗), (.∗), (.+), (.+), (.+) >; ”) ,
together with M atchResult result = scanner.match() method from regex6 package we
create a resulting array that contains the name and the attributes of every service declared in HDCL.
By providing this automated way of ensuring traceability between the diagram and HDCL declarations, we have intended to facilitate efficient design through run-time of service compositions.
5Contains the collections framework, legacy collection classes, event model, date and time facilities, internationalization, and miscellaneous utility classes (a string tokenizer, a random-number generator, and a bit array).
Chapter 4
User Interface
The user guide introduce the most important functionalities of the GUI for service behaviour modelling. The tool is implemented completely in Java, it is platform independent, and thus requires Java Runtime Environment (JRE)1. The user interface is implemented with
NetBeans IDE. In the first stage of the project some testing has been performed on building a GUI with the drag and drop form editor2. However, we have experienced that the code generated automatically by NetBeans GUI design tool has not been efficient and it was difficult to extend its functionality any further. Therefore the user interface was coded from ”scratch” (using Swing JFC and Visual Library API as base libraries).
The tool consists of a Java application which is used to design, display and analyse ser-vices and their attributes. It has to be mentioned that no continuous scenario is considered in this chapter. Also, it is important to mention that in the user guide the explanations will be restricted to a user interface perspective.
4.1
GUI Overview
When the tool is launched a main view is opened. As depicted in Figure 4.1, this view is dominated by a large modelling area, also called Diagram Editor View (DEV). The main concern during implementation was testing and manipulating the Visual Library API in DEV, in order to make sure that screen actions attached to elements functioned correctly. Apart from this, there is a menu bar at the top of the view, a Palette at the right side, and a Console View in the bottom side. In the next sections we will give a short description of the containing components.
4.1.1
Diagram Editor View
The Diagram Editor View contains a Main Menu at the top, a Palette at the right and a Diagram Scene at the center. Figure 4.1 shows DEV and the corresponding containers.
Main Menu
The menu consists of two top menus, the file menu and the help menu (to open the User Manual). The file menu has the following menu items:
1The tool requires that a Java Runtime Environment (JRE) be installed on your machine to run. Java SE 5 or greater is recommended.
2GUI design tool in NetBeans, formerly known as project Matisse.