SAFETY EVALUATION OF FREEWAY BASIC SEGMENT BASED ON
CPMs AND LOSS
MENG Xiang-hai
School of Transportation Science and Engineering, Harbin Institute of Technology 202 Haihe Road, Nangang District, Harbin, China
Phone: + 86 13030083885 E-mail: mengxianghai100@126.com QIN Wei, Harbin Institute of Technology; LI Xin, Harbin Institute of Technology
ABSTRACT
Safety evaluation of basic segments of freeway plays an important role in freeway safety management. Common methods for dividing basic segments were introduced and compared at first, and then a dynamic cluster segment division method was put forward based on where crashes located. Based on the numbers of crashes on divided segments, the statistical distribution of crashes was analyzed, and the result showed that the number of crashes on the divided segments followed the Negative Binomial (i.e., NB) distribution. Hence, Crash Prediction Models (i.e., CPMs) based on the NB distribution were established, and a method to evaluate the safety situation of freeway was proposed. Furthermore level of service of safety (i.e., LOSS) was introduced and the classification standard was determined, then a segment safety evaluation method based on LOSS was put forward. Both methods based on CPMs and based on LOSS were applied to the Jingzhu freeway, and the comparison showed that 57.8% segments were under the same level while the other were different. What’s more, it also could be find that the evaluation result based on CPM methods is more in line with actual situation. Safety evaluation method based on NB distribution considers traffic volume and geometric alignment, so it is more suitable for the freeway with complex geometric alignment conditions, mountainous freeway as Jingzhu freeway for instance. On the other hand, the safety evaluation method based on LOSS considers traffic volume and crash number, so it is more suitable for the freeway with good geometric alignment conditions.
1.
INTRODUCTION
The safety evaluation of freeway segment is one of the important tasks of freeway safety management. Ahmed et al. proposed a segment division method based on geometric conditions, and segments that have the same properties were clustered into a certain type [1]. Zhong Liande et al. proposed a ordered
cluster analysis method which can be used in segment division [2]. These methods all focused on a
certain property of sections, did not pay special attention to the distribution of crashes.
The four basic safety evaluation methods are the crash frequncy method, the crash rate method, crash frequency and crash rate method, and quality control method (QCM) [3], which are widely applied in
engineering practice, but their limitations are the neglect of alignment index. Liu et al. proposed an index called freeway safety integrated evaluation index, which combined the indexes of speed coordination index, geometry alignment continuity index and drivers’ psychological load etc.[4]. Dong
et al. discussed the correlation between consistancy evaluation with designed speed and operating speed, and freeway safety evaluation [5]. Fu et al. presented a fuzzy integrated evaluation method to
evaluate the safety of freeway alignment [6]. Parka et al. carried out safety evaluation by using the
Bayesian multiple regression model [7]. Qin et al. pointed out that the relationship of traffic crash and
traffic volume was nonlinear, and evaluated the safety with variance analysis method [8]. Kononov et
al. proposed a kind of LOSS [9]. Zhang et al. applied the LOSS for evaluation of intersection [10].
This paper proposed two freeway segment safety evaluation methods. Firstly, segment divided methods were analyzed and compared, and a dynamic cluster unequal-length segment division method was proposed and applied. Then, the statistical distribution charactors of crashes were analyzed, CPMs were calibrated based on NB distribution, which can be used to evaluate segments safety. Furthermore, the concept of LOSS was put forward, indicators of the service level were selected and the standard was determined, then the safety evaluation method of freeway segment based on LOSS was proposed. Finally, both safety evaluation methods were applied to a case freeway, and the results were analyzed and evaluated.
2.
DATA SOURCES AND DESCRIPTION
2.1. Data sources
The data, including geometric alignment, traffic flows and crash records, were collected from Yuegan freeway and Jingzhu freeway. Both freeways are located in Guangdong Province, with lengths of 136km and 109km, respectively all. Moreover, both freeways are located in mountainous and rolling ares, and their design speed are 100km/h.
2.2. Data description
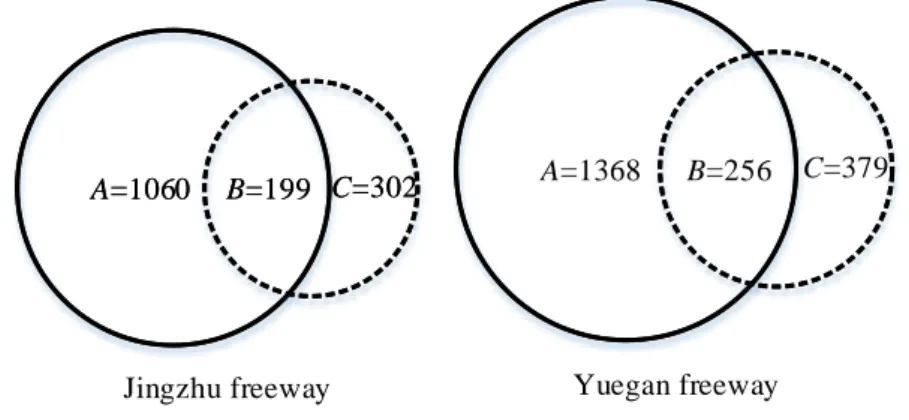
Crash data are mainly obtained from the data banks recorded by police and the Ministry of Freeway Administration. However, the crash data obtained from police only have the information on fatal and injury crashes, and the property damage only crashes (i.e., PDO crash) are not involved in. The crash data collected from the Ministry of Freeway Administration record more information on the loss of property than on the casualties. Hence, it is necessary to integrate these two kinds of crash data. The integration of the two types of crashes in Jingzhu and Yuegan Freeway is shown in Figure 1. For Jingzhu freeway, the crashes only recorded by the Ministry of Freeway Administration, denoted by A, is 1060. The crashes recorded only by the police, denoted by C, is 302. The crashes recoeded by both agencies, denoted by B, is 199. For Yuegan freeway, A, C and B are 1368, 379 and 256, respectively. The data used in this paper was the sum of crashes recorded only by the Ministry of Freeway
Administration and police minus crashes recorded by both, that is, the crash data used is equal to A+C-B.
A=1060 B=199 C=302 C=379
Jingzhu freeway Yuegan freeway
A=1060 B=199 C=302
A — Crashes recorded only by the Ministry of Freeway Administration
C — Crashes recorded only by the police
B — Crashes recorded by the both agencies
A=1368 B=256
Figure 1: Crash data sources
Based on two GIS systems, freeway geometry GIS and freeway crash GIS, each crash is matched with a group of geometric alignment indexes and the crash data are listed in Table 1 and Table 2, respectively.
Table 1: Geometric alignment indexes
Freeway Yuegan freeway Jingzhu freeway
Minimum length of tangent /m 200 145
Minimum radius of horizontal curve /m 712.378 500
Maximum deflection of horizontal curve /° 70.16 100.69
Maximum longitudinal gradient /% 4.0 5.0
Minimum radius of crest vertical curve /m 10000 8000
Minimum radius of sag vertical curve /m 8000 7000
Table 2: Traffic crash data
Freeway Yuegan freeway Jingzhu freeway
Year 2007 2008 2009 2010 2011 2012 2010 2011 2012
No. of crash 503 219 108 313 201 147 365 436 362
No. of fatality 24 23 11 14 12 4 53 49 25
No. of injury 131 21 21 19 10 4 96 104 28
3.
SEGMENT DIVISION
3.1. Purpose of segment division
In order to evaluate the safety situation of freeway from the aspect of geometry, it should be firstly to divide the freeway into segments which shorted length. There are mainly two kinds of segment
division methods, which are unequal-length method and equal-length method. The equal length method can separate the freeway into several segments almost having the same length and one km long of each segment is widely used in freeway. The unequal length method divides the freeway according to the distribution of crashes and the characteristics of geometry conditions. Hence, the length of each segment is not equal to others. This paper proposed an unequal length method for freeway segment division based on the distribution of crashes, and a dynamic clustering algorithm is introduced in.
3.2. Dynamic cluster method for segment division
First, select the middle position of each segment of one kilometer long as the center of initial clustering center. Then, take the position of each crash as the variable, calculate the distance between the crash position and initial clustering center, respectively, and determine the category of each crash according to the shortest distance to form new category. For new category, weighted calculation was carried out to calculate new clustering centers, then calculating the distance between these new centers and crash points to form new category again. Repeating the abovementioned processes till the category and clustering center converging, which meant the final segment division was completed.
3.3. Segment division results
By the aforementioned method, segment division was carried out on Yuegan freeway and Jingzhu freeway, and the results were shown on Table 3 and Table 4. There were a total of 136 segments on Yuegan freeway, among which the shortest was 325m and the longest was 2140m, and the average was 1000m; while there were a total of 109 segments on Jingzhu freeway with unequal-length, among which the shortest was 384m, the longest was 3270m, and the average was 1002m.
4.
STATISTICAL DISTRIBUTION OF CRASHES AND HYPOTHESIS
TESTING
4.1. Statistical distribution of crashes
In many early findings, the crash was in accordance with the Poisson distribution [11], which mean that
the probability of the occurrence of the crashxon each segment is,
( ) ! x e P X x x (1) Whereis the mean value of crashes.
The Poisson distribution required that the mean denoted by E x( ) and the varianceVar x( )are equal,
and they are equal to. When the variance is much larger than the mean, that is the crash sample appeared to be over dispersion, Poisson distribution shows large deviation. Under such conditions, NB distribution is proved to be more suitable by recent research results [12], the probability of occurrence
of x crashes on the road is:
( ) 1 ( ) ( ) ( ) ( ) ! 1 / x x P X x x g (2) Where g( ) is the gamma function; and
are the parameters of NB distribution, by Bayesian estimation, the parameters are given as:( ) E x (3) ( ) / [ ( ) / ( ) 1] E x Var x E x (4) WhereE x( )andVar x( ) are the mean and the variance of crash data.
In order to determine the statistical distribution characteristics of crashes on the basic segments of the freeway, this paper presents the actual distribution and the distribution fitted by Poisson distribution and NB distribution of equivalent crash number (i.e., number of crashes per kilometer per year)
(/km/year) on the Jingzhu freeway and the Yuegan freeway, which are shown in Table 3 and Table 4.
Table 3: Statistical distribution and hypothesis testing of crashes on Jingzhu segments
Equivalent crash number (/km/year) No. of segments 2 (QiEi) /Ei Actual distribution Poisson distribution NB distribution Poisson distribution NB distribution 1 15 12 15 0.750 0.000 2 16 18 18 0.184 0.247 3 30 22 24 2.965 1.500 4 16 21 18 0.897 0.129 5 12 15 13 0.591 0.108 6 2 9 9 5.657 5.270 7 5 5 5 0.004 0.023 8 3 2 3 0.251 0.000 9 5 1 2 17.997 7.401 10 1 0 1 1.272 0.058 Sum 105 105 105 2 6 2 1 ( i i) p i i Q E x E
2 14 2 1 ( i i) p i i Q E x E
Mean 3.69 3.64 3.71 =11.299 =7.277Variance 4.87 3.15 4.17 (degree of freedom)
v=8
(degree of freedom) v=7
Parameters =3.69 =3.69 P值=0.198 0.434
=11.64
Table 4: Statistical distribution and hypothesis testing of crashes on Yuegan segments
Equivalent crash number (/km/year) No. of segments Actual distribution Poisson distribution NB distribution Poisson distribution NB distribution 0 23 21 23 0.359 0.022 1 42 38 38 0.387 0.516 2 25 36 32 3.291 1.830 3 25 22 21 0.285 0.884 4 11 11 11 0.018 0.012 5 4 4 5 0.000 0.107 6 2 1 2 0.460 0.010 7 1 0 1 1.328 0.161 Sum 133 133 133 Mean 1.88 1.87 1.89 =6.128 =3.542
Variance 2.23 1.78 2.24 (degree of freedom)
v=6 (degree of freedom) v=5 Parameters =1.88 =1.88 0.445 0.640 =10.15 = P值 2 (QiEi) /Ei 2 6 2 1 ( i i) p i i Q E x E
2 14 2 1 ( i i) p i i Q E x E
P值= P值= Because the variance of crashes was greater than the mean, therefore, the distribution was more inclined to comply with the NB distribution.
4.2. Hypothesis testing
A Chi square test was used to determine whether the crash was in accordance with the distribution of Poisson distribution or NB distribution. The calculation formula of Chi square statistics x and the 2p
freedom degree v were given as follows:
2 2 1 ( ) k i i p i i Q E x E
(5) v=k-1-a (6) In the formula, Q is the actual sample observation value, E is the theoretical distribution value, k is the sample number, a is the number of parameters of the theoretical distribution (Poisson distribution a=1, NB distribution a=2).The chi square test results were shown in Table 3, from the P Value and the judging standard (confidence level of 0.05), the crashes of the Jingzhu freeway and the Yuegan freeway were both in accordance with Poisson distribution and NB distribution, but the P Value was more grater by NB distribution, thus NB distribution was more suitable.
5.
SAFETY EVALUATION BASED ON CPMs
5.1. Methodology to evaluate safety situations based on CPMs
According to the annual average daily traffic volume and geometric alignment index, the crash number prediction model was established based on the negative binominal distribution. According to the 95% confidence level, the upper and lower limit prediction model of crashes was established by negative binominal distribution. By comparing the actual number and the predicted number of crashes, the safety evaluation of freeway segment was carried out, the specific evaluation criterion were given as: if the actual crashes were less than the lower limit of predicted crashes, the safety situation of segment was grate. If the actual crashes were between the lower limit and the mean of predicted crashes, the safety situation of segment was good, if the actual crashes were between the mean and upper limit of predicted crashes, the safety situation of the segment was normal; if the actual crashes were more than the upper limit of the predicted crashes, the safety situation of the segment was pool.
5.2. CPMs based on NB distribution
As to crash prediction, the NB distribution function and the prediction model are given follows:
1 ( ) 1 ( ) ( ) ( ) ( ) ! 1 / j u j j j j j j u P u u (7) 10 0 1 exp( k k ) k x
(8) Where P u( j) is the probability ofucrashes on the segmentj;jis the mean number of crashes on the segment j;is an parameter of NB distribution; is the predicted value of crashes; x is the k-th k
There are 10 independent variables in the CPMs. They are the horizontal curve radius denoted by x1
and united in km, the length of horizontal curve denoted byx2and united in km, the angle deflection
denoted byx3, the total change of angle deflection of the horizontal curve denoted byx4, the radius of
vertical curve denoted byx5and united in 10
4m, the length of vertical curve denoted by
6
x and united in km, the longitudinal gradient denoted byx7and united in %, the total crashes of angle deflection of
vertical curve denoted byx8and united in %, the average annual daily traffic (i.e., AADT) denoted by 9
x , and the length of the segment denoted byx10and united in km.
Where
1 min 11, , 1i, , 1n x x x x (9) 2 2 1 n i i x x
(10)
3 max | 31|, ,| 3i|, ,| 3n| x x x x (11) 1 4 3( 1) 3 1 || | | || n i i i x x x
(12)
5 min 51, , 5i, , 5n x x x x (13) 6 6 1 n i i x x
(14)
7 max | 71|, ,| 7i|, ,| 7n| x x x x (15) 1 8 7( 1) 7 1 || | | || n i i i x x x
(16) Wherex1iis the i-th horizontal curve radius;x2iis the length of the i-th horizontal curve;x3iis the i-thdrift angle, right bias is positive, the left bias is negative;x5iis the i-th vertical curve radius;x6iis the
length of the i-th vertical curve;x7iis the i-th gradient, grade is positive, downhill is negative.
The calibration results of 2 freeways are shown in Table 4 and Table 5, respectively, z is the statistical test value, P is the significant level. After calibration, 2 freeway’s CPMs are obtained.
11 exp(0.2194x7 0 5067x9 1.6323x10 3.445) . (17) 21 exp(0.1159x7 0.7658x9 1.3548x10 2.7731) (18) 31 exp(0.0124x7 1.0249x9 1.0773x10 2.1012) (19) 12 exp(0.0145 -0.0268x3 x5 0.3438x7 0.5919x9 0.9841x10 1.3448) (20) 22 exp(0.0085 -0.1118x3 x5 0.2439x7 0.2026x9 0.7619x10 0.0580) (21) 32 exp(0.0024 -0.1968x3 x5 0.1439 -0.1867x7 x9 0.5398x10-1.2288) (22)
Where11,21and31are the upper limit value, the mean value, and the lower limit value of predicted values for the Yuegan freeway.12,22,32are the upper limit value, the mean value, the lower limit
value of predicted values for the Jingzhu freeway. Table 5: Results of model calibration of Yuegan freeway
Classification Coefficient Standard Deviation z P>z 95% Confidence Interval
Longitudinal gradient 0.1159 0.0528 2.19 0.028 0.0124 0.2194
AADT -0.7658 0.1322 -5.79 0.000 -1.0249 -0.5067
Segment length 1.3548 0.1416 9.57 0.000 1.0773 1.6323
Constants 2.7731 0.3428 8.09 0.000 2.1012 3.445
0.3195 0.0509 0.00 0.000 0.2338 0.4366
Table 6: Results of model calibration of Jingzhu freeway
Classification Coefficient Standard deviation z P>z 95% Confidence Interval
Deflection of horizontal curve 0.0085 0.0031 2.73 0.006 0.0024 0.0145
Radius of vertical curve -0.1118 0.0434 2.58 0.010 -0.1968 -0.0268
Longitudinal gradient 0.2439 0.0510 4.78 0.000 0.1439 0.3438
AADT 0.2026 0.1986 1.02 0.308 -0.1867 0.5919
Segment length 0.7619 0.1133 6.72 0.000 0.5398 0.9841
Cnstants 0.0580 0.6565 0.09 0.030 -1.2288 1.3448
0.2770 0.0463 0.00 0.000 0.1996 0.3844
6
SAFETY EVALUATION BASED ON LOSS
6.1. Concept of LOSS and evaluation index
Referring to the level of service (i.e., LOS), the concept of level of service of safety (i.e., LOSS) is put forward to evaluate traffic safety of freeway. Number of crashes and number of casualties which were under a range of traffic volume could be used as evaluation indexes of LOSS. In order to keep in line with the segment safety evaluation based on the NB distribution, hence the equivalent number of crashes was selected as evaluation index.
6.2. Degrees of LOSS
LOSS were divided into four grades. LOSS-I means that the safety situation is in very good condition, the number of crashes is obviously lower than average, and it is unlikely to be further lower. LOSS-II means that the safety situation is in good condition, the number of crashes is lower than average. LOSS-III means safety is in poor condition, the number of crashes is higher than average, and measures need to be taken to improve the safety situation. LOSS-IV means safety is in much poor condition, the number of crashes is higher than average, the sections can be considered as hazardous locations, which should be taken as soon as possible measures to improve the safety situation.
6.3. Safety evaluation standards
According to the maximum and minimum traffic volume of segments, the traffic volume was divided into na intervals, then segments and crashes subordinated to each interval were counted, then the mean
a
E , standard deviationa ,Ea1.5a andEa1.5a of the “a” interval’s crashes were calculated,
data were used to calibrate the 3 regression curves of crashes, the upper limit curve, the mean curve and the lower limit curve. According to the traffic volume, the 3 curves could divide the crashes number into 4 groups, which are the 4 safety service levels. LOSS could be determined by traffic volume, crashes number and safety evaluation standard. Both Yuegan freeway and Jingzhu freeway are four-lane freeway, moreover, both freeways are located in mountainous and rolling ares, and their design speed are 100km/h, therefore, the data of the Yuegan freeway and the Jingzhu freeway were merged. According to the method mentioned above, the classification standard of LOSS of the Yuegan freeway and Jingzhu freeway were determined, which are shown on Figure 2.
Fig.2 Safety performance function of freeway
The form of LOSS boundary function of these two freeway was , where was the equivalent number of crashes. Results of curve calibration and testing were shown in Table 7
Table 7: Results of model calibration and testing of Yuegan freeway
Curve of LOSS α β R2 F
Upper limit curve 0.0038 0.7073 0.8881 F0.975 F 17.22F0.025
Mean curve 0.0007 0.8042 0.8482 F0.975 F 14.62F0.025
Lower limit curve -5
2 10 0.9807 0.8552 F0.975 F 2.73F0.025
7.
ANALYSIS OF EVALUATION RESULTS
Take Jingzhu freeway for instance. The application of method based on NB distribution, that is, method 1 and method based on LOSS (i.e., method 2) were carried out to evaluate segments’ safety, respectively. Results were shown in Figure 3 and Figure 4.
The results of evaluation showed that, in the 109 segments, 63 segments showed the same result under the two evaluation methods, took 57.8 percent, while the other were different. By method 1, the segments amounts under the 4 safety grades grate, good, normal and poor were 5, 63, 36, and 5. By method 2 the number were 1, 64, 26, and 18, respectively.
=
Method 1 established the division standard from geometric alignment, hence the information of alignment was needed and leaded to complicated calculation process. Method 2 established 6 macro-standards according to the average AADT, simple arithmetic. Main influence factors on the evaluation results of method 1 were alignment indexes and traffic volume, the influence of alignment indexes was GREAT. The main influence factor on method 2 was traffic volume. Method 1 is more suitable for the freeway with complex geometric alignment conditions, such as mountainous freeways.
8.
CONCLUSION
The dynamic cluster segment division method could divide the freeway into segments with unequal-length, hence it overcame the shortcomings of strong subjectivity. The safety evaluation method of freeway segment based on NB distribution not only took traffic volume into account but also geometric alignment, hence it would be more suitable for the freeways in mountainous and rolling areas with complex geometric alignment. The main defect of this method would be its complicated algorithm and poor portability. The safety evaluation method based on LOSS can rapidly carry out evaluation according to traffic volume and equivalent crashes number after classification standard was determined, this method would be more suitable for the freeway with good geometric alignment condition, plain freeway for instance (traffic volume would be the main factor for crashes in such areas), its defect would be the negligence of geometric alignment.
How to consider the subjective factors such as the driver in the safety evaluation is a problem always under research. Traffic safety problem involves quantity and severity, quantity means crashes number, severity means casualties. This paper discussed the safety evaluation only involved quantity, severity factors need to be involved in further research. Furthermore, these two proposed safety evaluation methods need to be tested, verified and improved.
0 20 40 60 80 0 400 800 100 K20 K40 K60 K80 K100 1 1 K0 1 1 1 1 K10 K30 K50 K70 K90 K110 Position
LOSS-I LOSS-II LOSS-III LOSS-IV
Height (m) Crash n um ber Vertical Alignment
Figure 3: Safety evaluation results based on NB distribution
LOSS-I 0 20 40 60 80 K0 0 400 800 100 K20 K40 K60 K80 K100 1 1 K10 K30 K50 K70 K90 K110
LOSS-II LOSS-III LOSS-IV
Position Crash n um ber Height (m) Vertical Alignment
REFERENCES
[1] Ahmed, M., Huang, H., Abdel-Aty, M., Guevara, B. (2011). Exploring a Bayesian hierarchical approach for developing safety performance functions for a mountainous freeway. Accident Analysis & Prevention, Vol. 43, No 4, pp. 1581-1589.
[2] Zhong, L., Chen, Y., Sun, X., Liu, X., He, Y. (2008). Research on section division of freeway with ordinal clustering method. In Proceedings of International Conference on Transportation Engineering, Vol. 32, No 1, pp. 43-46.
[3] MENG Xiang-hai, SHENG Hong-fei, CHEN Tian-en. (2008). Essence and an Approach to
Identify the Hazardous Locations of Urban Arterial Link Based on BP Artificial Neural Network. Journal of Highway and Transportation Research and Development, Vol. 25, No 3, pp. 124-129.
[4] LIU, J. P., GUO, Z. Y., HU, J. B., ZHANG, Y. (2010). Safety Evaluation Method and Standard of Highway Alignment Design. China Journal of Highway and Transport, Vol. 23, No S, pp. 28-35.
[5] DONG, C., ZOU, J., GAO, Q., LI, Z. (2009). Study on The Highway Alignment Audit Based on Operating Speed. Highway Engineering, Vol. 34, No 4, pp. 64-67.
[6] FU Xin-sha, LONG Yu. (2008). Fuzzy synthetic evaluation of highway alignment safety.
Highway, Vol. 32, pp. 88-92.
[7] Park E S, Park J, Lomax T J. (2010). A fully Bayesian multivariate approach to before-after safety evaluation. Crashes Analysis & Prevention, Vol. 42, No 4, pp. 1118-1127.
[8] Qin X, Ivan J N, Ravishanker N, et al. (2005). Hierarchical Bayesian estimation of safety performance functions for two-lane highways using Markov chain Monte Carlo modeling. Journal of Transportation Engineering, Vol. 131, No 5, pp. 345-351.
[9] Kononov J, Allery B K. (2004). Explicit consideration of safety in transportation planning and project scoping. Transportation Research Record: Journal of the Transportation Research Board,
Vol. 1897,pp. 116-125.
[10] Zhang L, Prevedouros P D. (2003). Signalized intersection level of service incorporating safety risk. Transportation Research Record: Journal of the Transportation Research Board, Vol. 1852, pp. 77-86.
[11] Lord D, Washington S P, Ivan J N. Poisson. (2005). Poisson-gamma and zero-inflated regression models of motor vehicle crashes: balancing statistical fit and theory. Crashe Analysis & Prevention, Vol. 37, No 1, pp. 35-46.
[12] MA Zhuanglin, SHAO Chunfu, HU Dawei, MA Sheqiang. (2012). Temporal-spatial analysis model of traffic crashe frequency on expressway. Journal of Traffic and Transportation Engineering, Vol. 02,pp. 93-99.