INFLUENCE OF RED MOTORCYCLE BOX
TO THE TRAFFIC CONFLICT AND TRAFFIC FLOW
AT THE AHMAD YANI-LASWI SIGNALIZED INTERSECTION
Agah Muhammad Mulyadi
Institute of Road Engineering, Ministry of Public Works of Indonesia Jl. A.H. Nasution 264, Bandung, Indonesia
Tel. +62-22-7802251
agah.muhammad@pusjatan.pu.go.id Sri Amelia
Institute of Road Engineering, Ministry of Public Works of Indonesia Jl. A.H. Nasution 264, Bandung, Indonesia
Tel. +62-22-7802251 sri.amelia@pusjatan.pu.go.id
ABSTRACT
Nowadays, motorcycle is the most popular mode of transportation in Indonesia. At the end of 2011, the population of motorcycles reached 67.83 million units and increased the composition of motorcycle on the road approximately from 60 to 70%. The huge number of motorcycles showed the changing of traffic flow characteristics and decreased signalized intersection performance. Motorcycles movement at intersection approach is usually caused traffic conflict between motorcycle and other types vehicles. The traffic conflict is potential to cause the accident. Therefore, red box for motorcycle at signalized intersection is designate a space for motorcyclists to wait at a red light. Motorcyclists stop in front of other types vehicles and can proceed through the intersection first when the light turns green. This is one of the solution to reduce conflict between motorcycle and other types vehicles and increase intersection performance.
Aim of this paper to analyze the influence of red motorcycle box to the traffic conflict and traffic flow at intersection. The traffic flow analysis method used MKJI (Indonesia road capacity manual) while the traffic conflict analysis used Bagulay C.J. method.
One of red motorcycle box was implemented at Ahmad Yani-Laswi intersection in Bandung in year 2010. Data collection from before to after implementation of red motorcycle box has surveyed at this intersection in order to determine the influence of red motorcycle box. The data which was collected are traffic volume and traffic conflict. Analysis result show that traffic flow rose up to 13% and the traffic conflict which involved motorcycle at intersection felt up to 39%. All in all, the traffic conflict has decreased and the traffic flow has increased at Ahmad Yani-Laswi intersection due to red motorcycle box implementation.
1. INTRODUCTION
Nowadays, motorcycle is the most popular transportation mode that dominated traffic on the road. Research was conducted by Institute of Road Engineering (IRE) of Indonesia shows the
composition of motorcycle on the road approximately 60-70% during period from 2007 to 2012. The number of motorcycle sales has increased for almost 100% in last six years. In year 2011, motorcycle population has reached 67.83 million units and motorcycle sales has reached 8 million units. Motorcycle sales was dominated by scooter matic (51.6%) then followed by underbone (40.35%) and sport (8.05%) while moped does not have market sales in Indonesia. Moped is not popular and it does not widely reconized in Indonesia. In general, the population and sales of motorcycle in Indonesia is shown in Figure 1.
Figure 1 :Sales and population of motorcycle in Indonesia (Source: Indonesia Motorcycle Industry Asosiation, 2012)
The increasing number of motorcycle has negative impact to the intersection. Performance of signalized intersection has declined due to large number of motorcycle at intersection. Motorcycle tends to disorderly movement when approaching at signalized intersections. This disorderly movement will cause traffic conflict between motorcycle and other types vehicles. Therefore, there are many motorcyclist break the traffic rules during waiting at red light. For instance, motorcycle stop over the stop line, block the left turn lane and block zebra cross for pedestrian crossing. Disorderly queue of motorcycles has decreased the performance of signalized intersection. Disorderly queue condition at signalized intersection which is caused by motorcycles is shown in Figure 2.
Figure 2 :Disorderly queue by motorcycles at signalized intersection (Source: Idris, 2007)
To increase the performance of signalized intersection, it is possible to make some traffic engineering approach by providing red motorcycle box which separating between motorcycles and other types vehicles at red light. This separation is expected to reduce the problem which comes from the motorcycle flow. This method is used to improve the traffic flow. Red motorcycle box is designate a space for motorcyclists to wait at a red light. Motorcyclists stop in front of other types vehicles and can proceed through the intersection first when the light turns green. The signalized intersection is expected become more orderly, more organized, and more smoothly. Furthermore, aim this paper to analyze the influence of red motorcycle box to the traffic conflict and traffic flow at intersection.
2. RED MOTORCYCLE BOX
Red motorcycle box at signalized intersection basically developed from the concept of Advance Stop Lanes (ASLs) for bicycle. An ASLs, also called advanced stop box or bike box, are road markings at signalised road intersection allowing certain types of vehicles to head start when the traffic signal changes from red to green. Advanced stop lines for bicycle are implemented widely in the United Kingdom, the Netherlands, Denmark, and other European countries. Therefore, this concept is try to implement for motorcycle. The red box is an alternative solution to increase signalized intersection performance. Red motorcycle box which is developed to split queue between motorcycle and other types vehicles when waiting at red light (Source: Idris, 2007).
In general design the red motorcycle box, firstly red motorcycle box is designed by provide front stop line for motorcycle and back stop line for other types vehicles. Both stop lines are separated by red area with solid marking. Secondly, red motorcycle box also has continues boundary road marking on the left and right side. Thirdly, there is motorcycle logo in the center of red motorcycle box. That motorcycle logo is shown in red area to make motorcyclists are easy to understand what the meaning of thee red box.
There are two types of red motorcycle box, the box type and the P type. Box type is designed with box shape and it is applied if the proportion of motorcycle at each lanes are relatively the same. Nonetheless, P type is designed with P shape which is added by
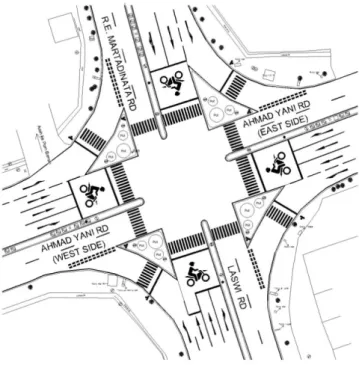
extension area at the left lane. This extension area is designed to accommodate the large proportion of motorcycle that moves on the left lane. P type is only applied when the proportion of motorcycle on the left lane is greater than 60% and 70% for two lanes and three lanes of red motorcycle box. On the contrary, if less than that value then apply the box type. At this intersection, P type only used on Laswi Rd. while other intersection approach used box type on Ahmad Yani Rd. (west and east side) and R.E Martadinata Rd. All red motorcycle box was designed with length 8 m. Scooter matic, underbone, and motorcycle sport have average length around 2 m. Thus, design red box with length of 8 m is able to accommodate four rows of motorcycles. Types of red motorcycle box are shown in Figure 3 while the design of red box at the Ahmad Yani-Laswi intersection is shown in Figure 4.
.
Figure 4 :Design of red motorcycle box at Ahmad Yani-Laswi intersection (Source: Amelia, 2009)
Bandung is one of the cities that was selected for first trial of red motorcycle box in Indonesia in 2010. City of Bandung is one of the major cities in Indonesia with rapid growth of motorcycles. Nowadays. Bandung has many activities centers, such as shopping malls, apartments, factory outlets, and office centres. Those people activities within the city has attracted and generated the vehicles movement. As time goes by, the city of Bandung has the problem at the signalized intersections which caused by disorderly queue from motorcycles when light turns red. As a result, Bandung was selected for red motorcycle box trial. Furthermore, the red motorcycle box trial has also applied in other cities, such as Denpasar, Badung, Bekasi, Tangerang, and Bogor.
The growing of motorcycle population has affected the traffic flow at signalized intersection. At Ahmad Yani-Laswi intersection, it can be seen from the Figure 5 that Ahmad Yani road and Laswi road has traffic volume more than 3000 vehicles per 30 green light cycles while R.E Martadinata road has the lowest traffic volume at this intersection approximately 1700 vehicles per 30 green light cycles.
Figure : 5 Traffic volume at Ahmad Yani-Laswi intersection
Ahmad Yani-Laswi intersection is a centre point which is passed by road user from easter part of Bandung to the city center. According to the data colection, the number of vehicles that queuing at red light is quite dense in the morning and afternoon for around 100 vehicles per green light. Furthermore, Detail Engineering Design (DED) for red motorcycle box was made in 2009. A year after, the red motorcycle box was implemented at Ahmad Yani-Laswi intersection in August 2010. The implementation of red motorcycle box is shown in Figure 6.
Figure : 6 Implement of red motorcycle box at Ahmad Yani-Laswi Intersection
3. METHODOLOGY
Research methodology is divided into traffic survey method and data analysis method which are explained as follows.
3.1 Traffic Survey Methods
Traffic survey was conducted before and after implemented red motorcycle box. In addition, both data before and after implement red motorcycle box will be analyzed to be used as a comparison data to determine the influence of implementation red motorcycle box to the traffic conflict and traffic flow. Traffic survey has taken in three segmentation times. Three
segmentation times are morning session, day session and afternoon session. The survey was conducted as many 10 traffic signal cycles in each session due to meet minimum requirement is 30 cycles of traffic signals per day. Survey time was conducted on weekday.
Data collections technique by using video camera device. Video camera is designed to record the movement of traffic flow at the intersection. Video camera is installed at high place that can cover the whole vehicles movement which is observed at the intersection. Video camera is installed at the pole with a height approximately 6 meter above road surface. The distance from red motorcycle box to the pole around 20 meter behind the red box. Figure 7 is shown video camera placement at the intersection.
Figure 7 : Illustration of Video Camera Placement for Monitoring red motorcycle box
3.2 Analysis Method
In this research, the data will be analyzed the traffic conflict and traffic flow before and after implementation of red motorcycle box.
3.2.1 Traffic Conflict Analysis
Traffic conflict analysis is focus on the frequency of traffic conflict which occurs at the intersection approach when light turns green. Traffic conflict is analyzed before and after the implementation of red motorcycle box. The level of traffic conflict is determined as the ratio of the number of traffic conflict which involved motorcycle at intersection approach that classified in traffic conflict per 1000 vehicles movement.
In general, typical of traffic conflict that might appear are classified by the typical of traffic conflict forms according to the Table 1. There are fifteen forms of traffic conflict (Bagulay CJ (1984)). Furthermore, in order to make proses data analysis more simple, the fifteen traffic conflict form are simplified into five types of traffic conflict forms. The grouping of the traffic conflict forms are based on similarity forms. A classification of traffic conflict forms is shown in Table 1:
Table 1 : Typical traffic conflict forms (Source: Bagulay CJ (1984)) with modification
Category
Remarks
Types Forms
TC1
Vehicle 1 moves to the other lane from the left or right lane. Vehicle 1 must brake to avoid a collision with vehicle 2 that moves straight.
TC2
Vehicle 1 moves to the other lane from the left or right lane and cut vehicle 2 straight movements. As a result, vehicle 2 must break to avoid collision with vehicle 1.
TC3
Vehicle 1 moves straight slowly and at the back there is vehicle 2 moves straight fast. As a result, vehicle 2 must break to avoid collision with vehicle 1.
TC4
Vehicle 1 moves to merge lane from the left or right lane. As a result, vehicle 2 must break to avoid collision with vehicle 1.
Table 1 : Typical traffic conflict forms (Source: Bagulay CJ (1984)) with modification (continue) Category Remarks Types Forms TC5
Vehicles 1 turns right or turns left and must break to avoid a collision with the vehicle 2 that moves straight.
Vehicles 1 turns right or turns left. Vehicle 2 that moves straight must break to avoid a collision with the vehicle 1.
Vehicle 1 moves slowly when turns right or turn left. At the back there is vehicle 2 moves straight fast. As a result, vehicle 2 must break to avoid collision with vehicle 1.
Vehicle 1 moves slowly U turn. At the back there is vehicle 2 moves straight fast. As a result, vehicle 2 must break to avoid collision with vehicle 1.
3.2.2 Traffic Flow Analysis
In order to find out that red motorcycle box is able to make traffic flow more orderly and more smoothly at signalized intersection, the traffic flow data was collected per 5 minutes to analysis the number of traffic flow at green light. Traffic volume must be converted from number of vehicles per hour to passenger car eqivalent (pce) per hour. The pce values are determined for bus or truck is 1.3, passenger car is 1, and motorcycle is 0.2. Those pce values are based on Indonesia Road Capacity Manual (MKJI, 2007). Traffic flow related to the performance of signalized intersection.
It can be seen from Figure 8 that the traffic flow starts from 0 second at the green light and reached a peak after 12-18 seconds. After that the traffic flow will decrease slightly and remained stable until the end of green light. At the beginning of traffic flow, lost time will occurs. Start-up lost time happens when a traffic signal changes from red to green. Some amount of time elapses between the signal changing from red to green and the first queued
vehicle moving through the intersection. There is then an additional amount of time for the next vehicle to begin moving and pass through the intersection. The total time taken for all waiting drivers to react and accelerate is the start-up lost time. Clearance lost time is the time lost to stopping a line of vehicles at the end of a green light.
Figure 8 : Traffic Flow Diagram (Source: Indonesia Road Capacity Manual, 1997)
4. ANALYSIS
The influence of red motorcycle box to the traffic conflict and traffic flow at Ahmad Yani-Laswi intersection will be analysed in this paper. The analysis will compare the data between before and after red motorcycle box implementation Data collection was conducted to determine traffic conflict and traffic flow at 30 cycles of green light. Firstly, cycles from number 1 to 10 in the morning session. Secondly, cycles from number 11 to 20 in the day session. Thirdly, cycles from number 21 to 30 in the afternoon season.
4.1 Traffic Conflict Analysis
Traffic conflict analysis has determined the level and types of traffic conflicts which are explained as follows.
4.11 Level of Traffic Conflict
It can be seen from Figure 9 that before red motorcycle box implementation, the frequency of traffic conflict was fluctuated from 0 to 7. Meanwhile, after implemented of red motorcycle box, the frequency of traffic conflict was remained stable around 1 to 4. The frequency was more fluctuated in morning seassion and afternoon seassion (cycle number 1 to 10 and number 20 to 30). The fluctuated frequency has correlation with high volume of vehicles in the morning and afternoon that caused traffic conflict at the signalized intersection.
Figure 9 : Traffic Conflict Frequencies
The number of traffic conflict per green light will be converted into the number of traffic conflict per 1000 vehicles. For example, the calculation of the frequency of traffic conflict on Laswi Road intersection approach before red motorcycle box implementation has recorded 93 traffic conflicts per 30 green lights while the total of traffic volume is 3073 vehicles per 30 green light cycles. It can be calculated that the level of traffic conflict on Laswi road intersection approach is 30.27 traffic conflicts per 1000 vehicles. The calculation is shown in Equation 1 while the resume of the level of traffic conflict is shown in Table 2.
Level of traffic conflict = Total Traffic Conflict × 10
3
Traffic Volume
=
93 x 103
3073 (Equation 1)
= 30.27 traffic conflicts/1000 vehicles
0 1 2 3 4 5 6 7 8 0 5 10 15 20 25 30 N u m b e r o f T ra ffi c C o n fl ic ts
Number of Green Light Cycles R.E. Martadinata Rd. Number of Traffic Conflicts per Green Light
Before After 0 1 2 3 4 5 6 7 8 0 5 10 15 20 25 30 N u m b e r o f T ra ffi c C o n fl ic ts
Number of Green Light Cycles Ahmad Yani Rd. (east side) Number of Traffic Conflicts per Green Light
Before After 0 1 2 3 4 5 6 7 0 5 10 15 20 25 30 N u m b e r o f T ra ffi c C o n fl ic ts
Number of Green Light Cycles Ahmad Yani Rd. (west side) Number of Traffic Conflicts per Green Light
Before After 0 1 2 3 4 5 6 7 0 5 10 15 20 25 30 N u m b e r o f T ra ffi c C o n fl ic ts
Number of Green Light Cycles Laswi Rd.
Number of Traffic Conflicts per Green Light
Table 2 : Resume of level of traffic conflict
Intersection approach
Traffic conflict / 30 green light cycles
Level of traffic conflict (traffic conflict per 1000
vehicles) Change (%)
Before After Before After
Laswi Rd. 93 69 30.27 20.94 -30.81
R.E Martadinata Rd. 72 55 43.10 31.63 -26.60
Ahmad Yani Rd.(east side) 127 84 32.90 21.80 -33.74
Ahmad Yani Rd.(west side) 121 75 34.97 21.28 -39.13
Total 413 283 141.23 95.66 -32.27
According to the Table 2 shows that the implementation of red motorcycle box has decreased a number of traffic conflict from 141.23 to 95.66. The level of traffic conflict has felt with an average 32.27%. The most significant feature is the data from Ahmad Yani Rd. (west side) whereas the level of traffic conflict has decreased for almost 40%. Meanwhile, the lowest is 26.6% has occurred at RE Martadinata Rd intersection approach. To sum up, all intersection approachs felt the traffic conflict which involved motorcycle with a change significantly. Based on those data, the implementation of red motorcycle box has already proved that red motorcycle box is effective to reduce traffic conflict at signalized intersection.
4.1.2 Types of Traffic Conflicts
Figure 10 shows that the distribution of types of traffic conflicts. The most noticeable data is type TC3 which dominated before and after implementation of red motorcycle box. It means that there were many of vehicles that move straight together whereas one vehicle moves straight slowly and the other vehicle behind moves straight fast. As a result, the vehicle behind must break to avoid collision with front vehicle. Traffic conflict type TC3 has dominated of all types of traffic conflicts then followed by type TC1 and type TC2. However type TC4 and type TC5 are the least.
Figure 10 : Types of traffic conflicts distribution
After implementation of red motorcycle box, there are decreased significanly of type TC2 from 24.2% to 13.4% and increased significantly of type TC3 from 38.5% to 54.8% as seen in Table 3, In contrast, type TC 1, type TC4, and type TC5 are more remained stable before and after implementation of red motorcycle box. As a result, it can be seen that red motorcycle box has decreased the motorcycles that move to the other lane from the left or right lane and also decreased the motorcycles that cut the other vehicles that move straight. Even though the proportion of type TC3 has increased, but the number of traffic conflicts of type TC3 has slightly decreased. After implementation of red motorcycle box, type TC3 is the only significantly traffic conflict types while the other types are not significant.
Table 3 : Proportion of traffic conflicts types
Types of traffic conflicts
Before After
Number of
traffic conflicts Proportion (%)
Number of
traffic conflicts Proportion (%)
TC1 95 23.0 71 25.1 TC2 100 24.2 38 13.4 TC3 159 38.5 155 54.8 TC4 19 4.6 4 1.4 TC5 40 9.7 15 5.3 Total 413 100 283 100 0 5 10 15 20 25 30 35 40
Type TC1 Type TC2 Type TC3 Type TC4 Type TC5
N u m b e r o f T ra ff ic C o n fl ic ts R.E. Martadinata Rd. Types of Traffic Conflicts
Before After 0 10 20 30 40 50 60 70
Type TC1 Type TC2 Type TC3 Type TC4 Type TC5
N u m b e r o f T ra ff ic C o n fl ic ts Laswi Rd. Types of Traffic Conflicts
Before After 0 10 20 30 40 50
Type TC1 Type TC2 Type TC3 Type TC4 Type TC5
N u m b e r o f T ra ff ic C o n fl ic ts
Ahmad Yani Rd. (east side) Types of Traffic Conflicts
Before After 0 10 20 30 40 50 60
Type TC1 Type TC2 Type TC3 Type TC4 Type TC5
N u m b e r o f T ra ff ic C o n fl ic ts
Ahmad Yani Rd. (west side) Types of Traffic Conflicts
4.2 Traffic Flow Analysis
Figure 11 shows the traffic flow per green light which is divided per 5 minutes. The data shows that Laswi Rd has the longest green time which is 60 seconds while the other intersection approach such as Ahmad Yani Rd (east side), Ahmad Yani Rd (west side) and R.E Martadinata Rd. are 50 seconds, 45 seconds, and 40 seconds. It can be seen from the graph that traffic flow after implementation of red motorcycle box is higher than before implementation. Table 4 shows that the highest increase is R.E Martadinata Rd and Ahmad Yani Rd (east side) approximately 13% while Ahmad Yani Rd (west side) and Laswi Road only increased around 3%. The average traffic flow before red motorcycle box implementation is 46.65 pce/green light and after red motorcycle box implementation is 50.13 pce/green light. Furthermore, the average of traffic flow has increased 7.44%.
Figure 11 : Distribution of traffic flow per 5 minutes
The most noticeable data at green light is from 0 second to 10 seconds. In that period the number of vehicles that move from intersection approach after red motorcycle box implementation is higher than before implementation. It means that provided the red motorcycle box caused motorcyclists stop in front of other types vehicles and can proceed through the intersection first when the light turns green. The green light time period from 10 to 20 seconds tends to remained stable and from 20 seconds to the end of green time tends to slighty declined. As a result, the implementation of red motorcycle box has increased the traffic flow and makes traffic flow at intersection become more smoothly and more orderly as shows in Table 4. 0 2 4 6 8 10 0 5 10 15 20 25 30 35 40 45 N um be r o f V e hi c le s (pc e /g re en lig h t)
Green light time (seconds)
Ahmad Yani Rd. (west side) Traffic Flow (pce/green light)
Before After 0 1 2 3 4 5 6 0 5 10 15 20 25 30 35 40 N um be r o f V e hi c le s (pc e /g re en lig h t )
Green light time (seconds)
R.E. Martadina Rd. Traffic Flow (pce/green light)
Before After 0 1 2 3 4 5 6 7 8 9 0 10 20 30 40 50 N um be r o f V e hi c le s (pc e /g re en lig h t)
Green light time (seconds)
Ahmad Yani Rd. (east side) Traffic Flow (pce/green light)
Before After 0 2 4 6 8 10 -5 5 15 25 35 45 N um be r o f V e hi c le s (pc e /g re en lig h t)
Green light time (seconds)
Ahmad Yani Rd. (west side) Traffic Flow (pce/green light)
Table 4 : The Changing of traffic flow
Intersection approach
Traffic flow (pce/green light) Change
(%)
Before After
Laswi Rd. 56.13 57.72 +2.82
R.E Martadinata Rd. 26.89 30.63 +13.91
Ahmad Yani Rd.(east side) 50.19 57.07 +13.70 Ahmadi Yani Rd.(west side) 53.41 55.10 +3.17
Average 46.65 50.13 +7.44
5. CONCLUSION
It is needed to address the phenomenon of disorderly motorcycles queue at the signalized intersection by providing red motorcycle box. According to the analysis data, it can be concluded that the red motorcycle box implementation at Ahmad Yani-Laswi intersection has an influence to decrease traffic conflict and increase traffic flow as mention as follows: a. Head start motorcycle movement at the signalized intersection caused other types of
vehicles are easily to move. As result, it reduces the probability of traffic conflict. The percentage of the average traffic conflict from before to after implement of red motorcycle box has felt significantly. The traffic conflict has felt up to 39% and also declined the motorcycles that move to the other lane from the left or right lane and cut other vehicle movement that move straight.
b. There are changing in the motorcycles traffic flow at the signalized intersection due to red motorcycle box implementation. The most noticeable data is green light time from 0 second to 10 seconds. In that period the number of vehicles that move from intersection approach after red motorcycle box implementation is higher than before implementation. It means that provides a space for motorcyclists to stop in front of other types vehicles and can proceed through the intersection first when the light turns green caused many motorcycles move first, so the traffic flow is higher at the beginning. According to the trial results of red motorcycle box implementation, the traffic flow has increased up to 13%. This research only analysis the influence of red motorcycle box to the traffic conflict and traffic flow. Furthermore, further research can be done to analyze the influence of red motorcycle box to the intersection capacity or the influence to the motorcyclist behavior.
REFERENCES
Bagulay, C.J. (1984), The British Traffic Conflict Studies, Proceedings of The NATO Advanced Research Workshop on International Calibration Study of Traffic Conflict Techniques, Copenhagen.
Ministry of Public Works (1997), Indonesia Road Capacity Manual (MKJI), Jakarta
Idris, M. (2007), The effect of advanced stop lines for motorcycles on traffic conflict at one
Amelia, S. (2009), Final Report of Detail Engineering Desain (DED) of motorcycle lane at