TOWARD AN INDOOR WINTER TIRE
CLASSIFICATION TEST
F. Bruzelius, M. Hjort, H. Andersson
Swedish National Road and Transport Research Institute SE-58195 Link¨oping Sweden
email:fredrik.bruzelius@chalmers.se,tel. 031-750 26 05
November 5, 2012
ABSTRACT
From a traffic safety perspective it is highly motivated to define winter tires in terms of their performance in icy road conditions. The present definition of winter (snow) tires, introduced in the EU in 2012, is based on packed snow performance. The present paper investigates the feasibility of an indoor winter tire classification test on ice. Results presented here indicates that a test procedure in an indoor hockey rink is possible, with relatively high repeatability. However, further field test is required to fully establish feasibility of the procedure.
Keywords: Winter tire classification, Tire testing
1 INTRODUCTION
Many accidents occurring in winter conditions in northern Europe are due to loss of control in slippery road conditions, see e.g. [1]. This fact motivates an introduction of tires specially designed for winter conditions to achieve a better grip. Up till now there has not been any proper definition of a winter tire in terms of performance from authorities or road administrators. Even though, Sweden have had a winter tire legislation since 1999 requiring the use of winter tires during the winter season. The definition of winter tire used here is the tread pattern label “mud + snow” and in addition requiring the tire manufacturer to ensure that the tire has been designed for winter condition. The STRO, The Scandinavian Tire & Rim Organization, provides a list of tires that has been designed for winter conditions to make the selection process for the end customer easier. However, this definition has shortcomings; the responsibility is completely put on the tire manufacturer making it impossible to verify any enforcement, the definition does not state any requirement on performance also making it impossible to verify enforcement.
The situation is very much similar across Europe, with only 9 countries not requiring winter tires, [2]. The European Union uses, since 2012 adopted in [3], a definition of snow (winter) tires that is based on a performance measure often called the snowflake test [4]. This test is measuring the traction (or in an modified version) baking performance relative to the Standard Reference Test Tire (SRTT16) on packed snow. Even though the test method prescribe procedures for testing performance on ice, the method is only deployed for packed snow. The surface characterisation of snow is also well developed in the test
method in comparison to ice conditions and the repeatability of the test is well established for snow surfaces.
It is clear the ice like conditions (thick ice, thin ice, hard packed snow, etc.) represent a higher risk for traffic accidents than snow like conditions (loose snow, loosely packed snow etc.) see e.g. [1]. Snow-like conditions are also , compared to ice-like conditions, relatively rare on public roads. This is due to the fact snow is rapidly packed to ice-like conditions by tires on the road pavement. For trucks there is an ongoing discussion in Sweden to introduce snow tires on the propelled wheels [5]. This is mainly motivated by accessibility and traffic flow, i.e. preventing trucks to get stuck in fresh snow. From a traffic safety perspective involving cars and light trucks, it is clear that it is desirable to have a winter tire definition based on at least the ice grip performance. A test on ice could also be used to discrimination between tires developed for Nordic conditions versus tires designed for central European conditions and communicate the difference to the end customer.
The possibility of having a performance test on ice is presently being investigated by the The European Tyre and Rim Technical Organisation (ETRTO) as well as in the presented project. The properties of ice, compared to snow, makes it difficult to achieve required repeatability and reproducibility of the results. A major effect are the low force levels that can be extracted in the contact patch between the ice surface and the tire. These low levels make testing on ice more sensitive to measurement noise and imperfections in measurement principals etc. The low levels also imply that small absolute changes in the surface will lead to radical relative changes. Examples of such changes are changes in the humidity level, temperature etc. Performing outdoor tire classification tests on ice is hard as the conditions can change rapidly and are almost impossible to compensate for.
The present project is investigating the possibility to reduce the influence of envi-ronmental parameters (temperature, humidity etc.) by conducting in-door tests in ice hockey arenas. Hockey arenas have a controlled climate (ice temperature, and sometimes control of humidity) and the ice is most often produced in a controlled and repeatable manner. The hockey rinks however do not offer the flexibility in terms of space. Indoor hockey ice rink testing states some obvious questions that the project aims to address, e.g., is hockey ice representative with respect to ice found on winter roads, is it possible to scale down speeds (to fit hockey ice) of the test and maintain representative results, is the indoor environment controlled enough such that repeatability and reproducibility can be achieved. Also general testing design issues are addressed like the influence of test equipment (test car) etc.
2 TEST SETUP
A series of tests was performed in Link¨oping Ice-hockey arena (“Cloetta Center”) over 5 different occasions and over a two week period in the beginning of April 2012. The ob-jectives of the tests was to investigate test equipment, for example the influence of using different test vehicles to perform the test, as well as the variability in between test series, i.e. the number of repetitions needed as well as between test series.
2.1 Test equipment
The test equipment constitutes of a test vehicle as well as a measurement wheel. The test vehicles are standard production cars without any modifications made to them. The following test cars has been used,
• A Volvo V70, all wheel driven, D5 engine • A Volvo V70 front wheel driven, D5 engine • A Ford Focus, front wheel driven, 1.6D engine
All tests, except where explicitly stated, was performed with the first option.The test cars was fitted with the tires to be tested with pressure according to what the test vehicle is prescribing in their user manuals.
The braking distance was measured with a, for the purpose designed, fifth wheel. The fifth wheel was mounted in the towing eyelet with a spring system pressuring the wheel to the ice to minimize the influence of wheel slip against the ice surface. An encoder is mounted to the wheel hub with high resolution. Reference measures against a measuring tape on the ice showed a maximum discrepancy of ≈ 5 cm on a ≈ 30 m distance for a series of 6 tests. The test vehicle and the fifth wheel is shown in figure 1.
Figure 1: The fifth wheel, mounted on the test vehicles towing eyelet
2.2 Test environment and conditions
The test ice was the practice hall of the Link¨oping hockey team, except for the first test series which was conducted in the main rink. Both rinks are hockey rinks of standard international dimensions.To achieve a maximum straight line acceleration and brake path, the diagonal was used. This distance measure just under 67m. After a suitable acceler-ation distance( roughly half the distance), rubber cones was placed to mark the braking engagement and to keep track of the path. The test vehicle was driven manually by a test driver and the baking was done manually as well. The test driver was instructed to drive as straight as he could (no steering compensation) and to brake fully at the cones. It is believed by the authors that the influence of non-perfect zero steering angle is neglectable in this context. The influence of different brake applications (time and effort) was eliminated in the measurements by not using the initial application part of the braking manoeuvre. One corner of the rink had an opening in the board which made it perfect to catch misses and badly planed breakings. The straight line was run over a repeated number of times with braking to achieve a well polished ice. This procedure was repeated after lunch brakes etc. to keep the ice in an as steady condition as possible.
2.3 Test implantation
The tested tires were chosen to represent a wide span of tires available on the market, without going for extremes. Six unstudded tires was tested and one studded. The six main tires further denoted T1 to T6 was chosen from the categories,
• “Nordic winter tires: T1 and T2 • “European” winter tires: T3 and T5 • Summer tires: T4 and T6
where “Nordic” and “European” refers to tire designed, according to the tire manufac-turer, for Nordic and central European conditions respectively. It should be pointed out here that Nordic winter tires are specifically designed for ice performance while European tires are designed mainly to perform well on other surfaces and conditions (e.g. cold wet asphalt).
The tests was performed at 4 occasions separated over a 2 week period. The first one was performed in the main hall with a significantly lower humidity (≈ 35% relative humidity) compared to hall used at the other occations (70 − 80% of relative humidity). The ice temperature was monitored frequently by probes penetrating the ice surface. The
ice temperature did not vary noticable (between −2 to −4.5o
C) over time. In fact, the closeness to the cooling pipes of the cooling system had a higher significance. In addition to the reference tire measurement a friction measurement was performed frequently using the portable friction tester (PFT), see [6], but no significant change was noticed. The reference tire used was the Standard Refernce Test Tire SRTT16, the UniRoyal Tiger Paw 225/60 R16.
3 RESULTS
On all the following plots, the order of appearance reflects the order which the tests was performed, except for the summarizing figure 6. The braking distance is taken between 25km/h down to 10km/h except where it is stated otherwise. From some combinations it was not possible to reach speeds above 25km/h, and hence a somewhat lower speed was used. It is believed that the ABS system strategy differ radically for low speeds between different car brands (ABS suppliers), which potentially can lead to an undesirable favoring of certain types of tire/test car combinations. It is also known that the wheel encoders in the ABS systems looses their resolution for low speeds. The different strategies of the braking system for low speeds does not represent performance in higher speeds. Hence, the relatively high speed of 10km/h was chosen as the “stopping” speed. To the left in figure 2
ref1 T1 ref2 T2 ref3 T3 ref4
0 2 4 6 8 10 12 14 16 18 20 Tested Tires
Brake distance [m] and 95% conf interval
Braking distance from 25km/h down to10km/h
T1 T2 T3 0 20 40 60 80 100 120 140 Tested Tires
Performance [%] and 95% conf interval
Braking distance (25to10km/h) relative to ref tire
Figure 2: Test results of the first occasion, conduced in a different hall with different conditions (humidity)
is the braking distance from 25km/h down to 10km/h along with the 95% confidence intervall of each test run plotted. These tests was performed in the main rink, while all following results was performed on the second rink. The relatively large confidence interval of the second reference run (ref2) originates from an outlayer, an uncompleted braking before ending up outside the ice rink. To the right a relative performance to an average of the neighbouring reference tire runs, an index taken from the snowflake test. An “equivalent” 95% confidence interval for the relative measure (using the max
and min of the corresponding reference runs and tire runs) is also plotted to the right in the figure. The relatively large intervals of the first two tested tires originates from the second refernce run. With this uncertainty, one ambiguous repetition of one run it is hard to separate the performance between the first (T1) and the second (T2) tire and the first and the third (T3), even though the high number of repetitions on each run (round 10 repetitions). The results of the second occasion is plotted in figure 3.
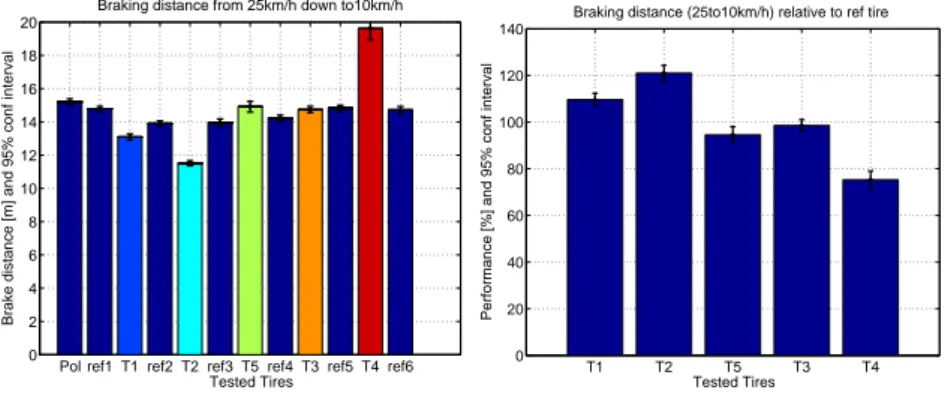
Pol Ref1 T1 Ref2 T2 Ref3 T3 Ref4 T5 Ref5 T4 Ref6 0 2 4 6 8 10 12 14 16 18 20 Tested Tires
Brake distance [m] and 95% conf interval
Braking distance from 25km/h down to10km/h
T1 T2 T3 T5 T4 0 20 40 60 80 100 120 140 Tested Tires
Performance [%] and 95% conf interval
Braking distance (25to10km/h) relative to ref tire
Figure 3: Test results of the second test occasion.
There is the effect of the polishing illustrated by relatively large confidence interval of the first bar (Pol) compared to the first reference tire run (ref1). It is also noticeable that the confidence intervals are relatively small, except for the summer tire (T4). A likely explanation is the the longer braking distance of the summer tire lead in to parts of the ice that have been exposed to less polishing. However, the big difference in braking distance compensates the relatively large confidence interval. It is clear that all three groups of tires can be discriminated with clear margins to the confidence interval; the Nordic tire performing well over 110%, the European around 100% and the summer tire well below the rest of the tire at a level around 80% relative to the reference tire. The
Pol ref1 T1 ref2 T2 ref3 T5 ref4 T3 ref5 T4 ref6 0 2 4 6 8 10 12 14 16 18 20 Tested Tires
Brake distance [m] and 95% conf interval
Braking distance from 25km/h down to10km/h
T1 T2 T5 T3 T4 0 20 40 60 80 100 120 140 Tested Tires
Performance [%] and 95% conf interval
Braking distance (25to10km/h) relative to ref tire
Figure 4: Test results of third test occasion.
performance of the third occasion in figure 4 shows remarkable resemblance of the second occasion. The ice rink, test vehicle etc was all the same at both occasions, but they were separated by 13 days. Worth noticing is that all tires performance worse on this occasion compared to the second occasion with longer braking distances. This indicates that the normalization with the reference tire is working rather well. However, the reference tires brake distances are varying between in between occasions but also within one occasion. This is most noticeable for the tire (T5) where the performance index is roughly 100% for the second test occation while it is radically reduced for the third occation (notice the
swap in positions). This is due to that the tested tire (T5) performs worse compared to the reference tires. On the other hand, compared to the reference tire runs ref4 and ref5 suggest that the something have happend with the ice surface and that (T3s) performance is effected by this change. For the fourth test occasion, see figure 5, the conditions were
Pol ref1 T1 ref2 T2 ref3 T3 ref4ref5 T5 ref6 T4 ref7 T6 ref8 0 2 4 6 8 10 12 14 16 18 20 Tested Tires
Brake distance [m] and 95% conf interval
Braking distance from 25km/h down to10km/h
T1 T2 T3 T5 T4 T6 0 20 40 60 80 100 120 140 Tested Tires
Performance [%] and 95% conf interval
Braking distance (25to10km/h) relative to ref tire
Figure 5: Test results of the fourth test occasion.
more stable in terms of braking distance variability of the reference tire. An additional summer tire was tested and is easily identified by its performance, well below 100% around 80%. T1 T2 T3 0 20 40 60 80 100 120 140
Performance of three tested tires and 4 test days
Tested tires
mean relative performance [%]
T1 T2 T3 0 20 40 60 80 100 120 140
mean performance of three tested tires and 4 test days
mean (over the days) relative performance [%]
Tested tires
Figure 6: Comparison of test results, mean values of performances at different test occa-sions (left).Mean value over the test occaocca-sions along with the confidence interval of the mean values from each test occasion (right).
In figure 6 are the results of the 4 test occasions compiled in one bar graph for the three first tested tires. It should be noticed that the confidence intervals between the mean performance results for each occasions is of same magnitude as the confidence intervals of each tested tire and occasion. This suggests that the result of a tested tire will be the similar whenever the test was performed, even though the ice properties have changed. However, more round robin kind of tests is needed to be conducted to support this statement especially with significantly different outside weather conditions.
In figure 7 is the test runs preformed with different test vehicles. In the left figure is the reference tire tested with an all wheel driven (AWD) Volvo V70 and with a one with front wheel drive (FWD) and with a Ford Focus with front wheel drive in the right figure. It turned out that it was difficult to reach a speed of 25km/h and to keep the safety margin to the ice rink board at the end of the straight with both the front wheel driven test vehicles. Hence, a lower start speed of 23km/h was used to produce the braking
VolvoV70_AWD_ref VolvoV70_FWD_refVolvoV70_FWD_Studd 0 2 4 6 8 10 12 14 16 18 20 Tested Tires
Brake distance [m] and 95% conf interval
Braking distance from 23km/h down to10km/h
ref1 T2 ref2 0 2 4 6 8 10 12 14 16 18 20 Tested Tires
Brake distance [m] and 95% conf interval
Braking distance from 23km/h down to10km/h
Figure 7: Test results of comparing different test vehicles, (left) front wheel driven Volvo V70 (D5 engine) versus all wheel driven Volvo V70 (D5 engine), (middle) test performed with a Ford Focus 1.6 liter diesel engine, (right) ice after one brake with studded tires. Observe the donut shaped pieces of ice in grey.
distances. This somewhat shorter distance due to the lower entrance speed will influence the statistical proprieties and increase the variability, but is not further investigated.
In the left figure it can be observed that the reference tire performs a significantly longer barking distance with the front wheel driven test car than for the all wheel driven one. This suggest that the influence of test car might have significance to the outcome of the test and that a test car should be specified in a future test procedure. This statement is also supported by the right figure were the performance index is approximately 130% to be compared with the one obtained in figure 6 for (T2) of 122%.
In the left figure 7, a studded tire was tested using the front wheel driven test vehicle. It should be noticed that the performance of the studded tire was radically worse than expected, just slightly shorter than the reference tire. It is believed that this is due to properties of the ice. When the ice is produced, the ice machine is poring a thin layer of hot water to the existing ice to prevent the ice to be build up by layers. However, for a car with the normal load and forces this is not true. The studs was pealing of the top layer of the ice leaving donut shaped pieces of ice, see right in figure 6. This ice property is a synthetic phenomena created as discussed above by the production process of the ice and does not represent ice occurring on public road pavements. Hence, it is concluded that it is not suitable to do performance tests of studded tires in indoor hockey rinks.
4 CONCLUSIONS
The present paper present some results from 4 test occasions in an indoor ice hockey rink in Link¨oping Sweden in mid April 2012. The test setup uses a standard car fitted with the test tires and with a fifth wheel measuring speed and traveled distance with high accuracy. No indication in the performed test suggest that the accuracy of this relatively simple measurement device is insufficient for a future test protocol for classifying or categorizing winter tires. On the other hand, a measurement principal other than a fifth measurement wheel would introduce more uncertainties and potentially jeopardize the feasibility of indoor tire performance tests on ice.
It is clearly shown in the result that the braking distances have a relatively high variability between test occasions (and environmental conditions). This suggest a need to relate the braking distances in a fashion similar to the one in the snowflake test, i.e. the relative performance to a standard reference test tire. Results here suggest that it is possible to normalize the test results and reduce the effects of the variability. However, it should be pointed here that the properties and performance of a standard reference test
tire (SRTT) will be embedded in the measure. Hence, the properties of the frequently used SRTT16 should be investigated in different ice conditions (temperature, humidity) to ensure that its properties are adequate to relate to.
The results here suggest that the specific test car will have significant influence to the test results of the tire. This indicates that the test car to be used in a future test procedure should be specified on a detailed level, possibly multiple to enable testing of a wider range of tire dimensions. It is also desirable to have a test car that is all wheel driven to achieve a higher testing speed, given that the acceleration phase needs to be located on the ice as well. It is undesirable to use low speed (0 − 10km/h) data as the ABS strategies differs between cars and that this part of the braking differs substantially from high speed. Further testing is required to investigate individual variations of test vehicles.
Even though new ice is produced by putting hot water on top of the old ice to melt them together layers are created. The consequence when testing studded tires is that the top layers comes loose and the braking performance of these tires are highly underestimated compared to real road conditions. Hence, hockey rink ices are not suitable for performance testing of studded tires.
The importance of polishing the surface is clear in the test results. Repeated polishing using for example the reference tire seems to be sufficient to achieve stable results. The number of repetitions done in the tests varied between 10 to 20 between test occasions. No significant reduction in confidence interval was observed between these to extreme values, indicating that 10 − 15 repetitions are sufficient.
Using the test equipment suggested here and measuring the braking distance from 25km/h down to 10km/h and relate this distance to a reference tire it is possible to di-vide the performance into winter/non- winter tire classes and even further refine the scale to non-winter tires, winter tires design for ice conditions (Nordic tires) and winter tires not designed for ice conditions (European tires). The variability within each test occasion is of the same magnitude as the variability from test occasion to test occasion. However, further testing in different settings are required to fully establish the feasibility of this classification test.
ACKNOWLEDGMENT
The authors would like to thank the Swedish road administration (Trafikverket) for fund-ing support of the project and Allan Ostrovskis from Nokian (and STRO) and Lennart Lomaeus of Michelin (and STRO) for valuable input and discussions.
REFERENCES
[1] Wallman, C.-G., Tema Vintermodell - Olycksrisker vid olika vinterv¨aglag, VTI notat 60-2001. available at www.vti.se
[2] The European Tyre & Rubber manufacturers association, www.etrma.org.
[3] REGULATION (EC) No 661/2009 OF THE EUROPEAN PARLIAMENT AND OF THE COUNCIL of 13 July 2009. Official Journal of the European Union. 31.7.2009. [4] ASTM F1805 - 06. Standard Test Method for Single Wheel Driving Traction in a
Straight Line on Snow- and Ice-Covered Surfaces. DOI: 10.1520/F1805-06.
[5] Hjort, M. Vinterd¨ack p˚adrivaxel till tunga fordon en v¨aggreppsstudie. VTI notat
N23-2012. available at www.vti.se
[6] Bengt W¨alivaara, Validering av VTI-PFT version 4. VTI notat N16-2007. available at www.vti.se