'4 1 särtryck
Nr 251 * 1995
What is happening to the number of
fatalities in road accidents? A model for forecasts and continuous monitoring of development up to the year 2000
Ulf Bräde
Reprint from Accident Analysis & Prevention, Vol. 27, No. 3, pp. 405-410, 1995 1500 -+59 TRAFFIC INDEX 1000 FATALITIES NU MB ER OF FA TA LI TI ES 500 1970 1975 1980 1985 1990 1995 2000 YEAR
Swedish National Road and J Transport Research Institute
VTI särtryck
Nr 251 ' 1995
What is happening to the number of
fatalities in road accidents? A model for
forecasts and continuous monitoring of
development up to the year 2000
Ulf Bri'lde
Reprint from Accident Analysis & Prevention, Vol. 27,
No. 3, pp. 405 410, 1995
db
Väg- och
transport-farskningsinstitutet
,
ISSN 1102 626XPergamon Accid. Anal. and Prev., Vol. 27, No. 3, pp. 405 410, 1995Copyright © 1995 Elsevier Science Ltd Printed in the USA. All rights reserved 0001 4575/95 $9.50 + .00
0001-4575(94)00062 X
BRIEF COMMUNICATIONS AND RESEARCH NOTES
WHAT IS HAPPENING TO THE NUMBER OF
FATALITIES IN ROAD ACCIDENTS? A MODEL FOR
FORECASTS AND CONTINUOUS MONITORING OF
DEVELOPMENT UP TO THE YEAR 2000
ULF BRUDE
Swedish Road and Transport Research Institute (VTI), S-581 95 Linköping, Sweden
(Received 11 March 1994; Accepted 21 June 1994)
Abstract A model for successively forecasting and monitoring the development in the number of fatalities in traffic is presented. The model has been created through time series analysis covering the years 1977 1991. The model is simple, with the number of fatalities as the dependent variable and with time and traffic as the only predictors. The time factor describes the cumulative effect of changes such as better roads, vehicles, drivers, etc. The model is multiplicative and permits a nonproportional relationship with traf c volume. Taking into account the purely random uctuations in the number of fatalities, the historical t for the period
1977 1991 is very good. Also the forecasts for 1992 and 1993 have proved very accurate. The model will be
revised as new annual data are received. At present, the model points to a favorable development in the
reduction of the number of fatalities up to the year 2000, assuming a moderate increase in traf c.
INTRODUCTION
In accordance with the WHO guidelines, the
Swed-ish Parliament and traffic safety authorities have
de-clared that the number of killed and injured in traf c accidents must be reduced. In the case of fatalities, the goal is a maximum of 600 by the year 2000. To enable continuous monitoring of progress towards this goal, some sort of forecasting method is re-quired. In particular, information is needed for de-termining whether further actions are necessary. The general responsibility for traf c safety work in Sweden is nowadays handled on both central and regional levels by the National Road Administration.
HISTORICAL DEVELOPMENT
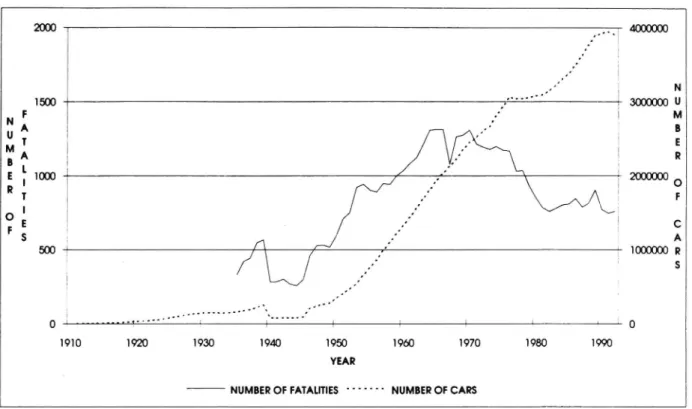
As shown in Fig. 1, the number of fatalities in
traf c in Sweden increased successively up to about
1,300 in 1970. A large decrease occurred temporarily during the Second World War and also in connection with the changeover to right hand traf c in 1967.
During the 19705 and early 19805, the number
of fatalities decreased. Legislation on using seat belts in front seats was introduced in 1975 after a campaign lasting a number of years. However, the latter part of the 19805 saw an increase again. At
this point, it was feared that the traf c safety goal
would prove dif cult to achieve without extraordi-nary measures, even if traf c increased only moder ately up to the year 2000.
Figure I also shows that, except during the Sec-ond World War, the number of cars on the roads increased successively up to the beginning of the 19905. The pattern of development in fatalities and
traf c in Sweden agrees closely with that in several
other countries (Oppe 1989).
Table 1 shows the development in fatalities in
Sweden for the 15-year period 1977 1991 and the
development in index form for traffic mileage,
esti-mated with the aid of petrol consumption data. The
period 1977 1991 has been considered suf ciently recent and long enough to provide a basis for a fore-casting model. In addition, the period has not been disturbed by individual major events affecting the number of fatalities.
Table 2 and Figure 2 show the development in the death risk, de ned as the number of fatalities divided by the traf c index. The absolute decrease in the death risk diminishes with time. What is hap-pening to the relative decrease? As can be seen with
the aid of the table, this is on the order of 3.5%
on the average. How long this will continue is of course unknown. At the time of writing, it can be
seen that the change in 1991 1992 was +0.2% and
406 Brief Communications and Research Notes 1500 F N A U T M A B I. E 1000 R | T 1
C: e
Ssoo 1.
0 1 -AA-- 3 L ji i 1 l I 0 1910 1920 1930 1940 1950 1960 1970 1980 1990 YEARNUMBER OF FATALITIES """" NUMBER OF CARS
Fig. 1. Number of fatalities and number of cars during the 20th century. Source: Statistics Sweden.
decreased death risk appears to have had a more
favorable deveIOpment at times when traf c has
been unchanged or has decreased compared to when
it has increased.
MODEL
Several attempts have been made to use
regres-sion models in adaptation to historical development
and also to use the models in forecasting the number
Table 1. Number of fatalities and traf c index based on petrol consumption, 1977 1991
Year Fatalities Traf c index
1977 1,031 100 1978 1,034 103 1979 926 102 1980 848 99 1981 784 97 1982 758 98 1983 779 100 1984 801 104 1985 808 105 1986 844 111 1987 787 115 1988 813 119 1989 904 124 1990 772 117 1991 745 120
Source: Statistics Sweden.
of fatalities. This is described in several articles in
a special issue of Accident Analysis & Prevention
(Haight 1991).
The model chosen in this study has the following
structure:
Fatalities = a )( by
>< Trafficc,
(1)
which can alternatively be written as
Fatalities = exp(a + ,B >< Year + y x ln Tra ic) (2)
wherea=lna,,8=lnbandy=c.
Table 2. Death risk 1977-1991
Year Death risk Annual change (%)
1977 10.31 1978 10.04 2.6 1979 9.08 9.6 1980 8.57 5.6 1981 8.08 5.7 1982 7.73 4.3 1983 7.79 +0.8 1984 7.70 1.2 1985 7.70 rO 1986 7.60 1.3 1987 6.84 10.0 1988 6.83 0.1 1989 7.29 +6.7 1990 6.60 9.5 1991 6.21 5.9
Brief Communications and Research Notes 407 10 ;x! Constant traffic \ DE AT H RI SK O ,
DEATH RISK = FATALITIES/TRAFFIC
Increasing traffic
Decreasing traffic
1977 1978 1979 1980 1981 , 1982 1983 1984 1985 1986 1987 1988 1989 1990 1991
YEAR
Fig. 2. Death risk 1977 1991. (Solid line indicates actual development. The broken line indicates adjusted development for the three subperiods with different traffic development).
The regression coef cients a, 1), and c are esti-mated with the aid of the GLIM computer package and assume that the number of fatalities follows a Poisson distribution (which naturally is not strictly applicable).
Model 1 (i) is simple and interpretable, (ii) shows directly the number of fatalities without need-ing to use the death risk, (iii) permits a nonpropor-tional relationship to traffic volume for fatalities (as well as for the death risk).
Coefficient [7 indicates the average annual change in number of fatalities (in unchanged traf c) resulting from better roads, vehicles, drivers, etc. Coef cient b also pays attention to other changes over time, such as speed changes and changes in the age composition of the population.
Coef cient c indicates how the number of
fatalities varies with traffic volume, which in turn is
strongly correlated with business cycle fiuctuations.
ESTIMATED MODEL COEFFICIENTS
For the 15-year period 1977 1991, the following regression model has been obtained.
Fatalities = 0.2091 x 0.9562 * >< Traf d851 (3)
where Year = 1 for 1977, 2 for 1978 . . . and 15 for
1991. Traf c is equal to traf c (mileage) index with 1977 as base year (index = 100). The value of coef -cient b (= O.9562*) means that in the event of un-changed traffic mileage, the number of fatalities is expected to decrease by just under 5% from one year the next. The value 1.851? for coef cient c means that the number of fatalities in a particular year is expected to increase (or decrease) just over 1.5% if the traf c increases (or decreases) by
1%. The relationship between fatalities and traffic
is therefore somewhat stronger than purely proportional.
On the basis of equation (3), it is also understood that the death risk has a positive relationship to traffic. In a certain given year, the death risk may be expected to increase with increased traffic and decrease with decreased traffic. This was already evident in Figure 2.
Owing to the intercorrelations between esti-mates of coef cients b and C, the numerical value of the regression coef cients should be interpreted with caution. From the predictive aspect, the inter-correlations fortunately need not play an important part. In addition, the credibility of the regression coefficients is strengthened in a further inspection
.*Approximately 95% confidence interval: 0.9487 09639. +Approximately 95% confidence interval: l.4159 2.2861.
408 Brief Communications and Research Notes 1500 TISO x lll o ; Z Q 1000 +100 0 | 1 I
a
!
3
Il-O n: m Q 5 i% 500 + 50
0 f 1975 1980 1985 1990 1995 YEAR' OBS + PRED _. TRAFFIC INDEX
Fig. 3. Observed and predicted numbers of fatalities and traf c index, 1977 1991.
of the fatality development from 1977 onwards (cf.
Table l).
During 1977 1983, traffic was almost un-changed (increased on average by 0.02% per year). The number of fatalities decreased by an average of
4.4% per year.
During 1983 1989, traf c increased on aver-age by 3.7% per year. The number of fatalities in creased by an average of 2.7% per year.
During 1989 1991, traf c decreased on aver-age by 1.5% per year. The number of fatalities
de-creased by an average of 9.1% per year.
The observed and predicted fatality numbers
for the study period 1977 1991, i.e. the years used
to estimate the regression model, are described
to-gether with traf c development in Fig. 3. It is striking
how well the pattern of variation in traf c is re ected
by variations in the number of fatalities.
HOW WELL IS THE HISTORICAL
DEVELOPMENT EXPLAINED?
The agreement between the actual and pre dicted number of fatalities is naturally not
com-pletely perfect. This cannot be expected for a
vari-able regarded as random.
The coef cient of determination, R2, i.e. the squared correlation coef cient between observed and predicted fatalities in 1977 1991, is calculated as 0.92. In other words, 92% of the variation in number of fatalities is explained by the factors, Year
and Traf c.
On the assumption that the annual expected
values agree fully with the predicted values and that the number of fatalities in a given year follows a
Poisson distribution, the maximal coef cient of
de-termination can be expected (Briide and Larsson
1993):
Rim = V(pred)/[E(pred) + V(pred)]
= 0.90, i.e. 90% From this, it follows:
(1 Råm) x 100%
= 10% constitutes purely random variation.
As can be seen, the coef cient of determination,
R2, actually obtained exceeds Rim, and therefore
no remaining unexplained variation can be
demon-strated. (This is also indicated by the fact that the
anal-Brief Communications and Research Notes 409
1500 TRÅFFIC |NDEX
&
E 1000 _|:S
5.
( 5 Ek FATALlTlES & »_______________ Z 500 0 1970 1975 1980 1985 1990 1995 2000 YEARFig. 4. Forecasts for 1992, 1993, and 2000. (Solid rectangles indicate observed fatalities. Open rectangles indicate predicted and forecast values.)
ysis, 11.3, closely agrees with the value of 12 degrees of freedom).
According to this approach, the model de-scribes historical development very closely.
FORECASTS AND MONITORING UP TO
THE YEAR 2000
Figure 4 shows the observed and predicted
val-ues for 1977 1991, as well as forecasts for 1992,
1993 and 2000.
In recent years, traf c has (temporarily?) stag-nated and even decreased somewhat. However, it is
probable that traf c will increase again in the coming
years. According to the forecast of the Swedish Na-tional Road Administration, traf c will be about 10%
greater in 2000 than in 1990.
It is important to emphasize that, with regard to future traf c, this gure can be reviewed if
necessary. It is also important to emphasize that
the model is intended to be continuously updated. Up to the year 2000, the time series will be extended annually.
For 1992 and 1993, the actual traf c index was
122 and 116, respectively. Given this traf c index,
743 and 647 fatalities, respectively, would have been forecast. The actual number of fatalities was 759 and 632, respectively. In passing, it should be noted that
in 1992 an accident with an empty runaway tram
killed 13 people.
For 1994, 619 fatalities are forecast, given the same traf c as in 1993 (traf c index 116). If the traf c index were to increase by 5%, the forecast would be 679 fatalities, and if traf c decreased by 5%, 561 would be killed.
On the assumption of about 10% more traf c
in 2000 compared with 1990, which would mean a
traf c index of 129 in 2000, 576 fatalities are forecast for the year 2000. If so, this would mean that the traf c policy goal for fewer fatalities was achieved. This type of monitoring will be performed annually up to the year 2000.
For unchanged traf c in the year 2000 compared with 1990, 481 fatalities are forecast and if a 20% increase in traf c is assumed, 670 fatalities.
By using the covariance matrix, a con dence range can be calculated for the forecasts (the
ex-pected values). An approximately 95% con dence
range for the predicted value in 2000 (given a traf c
index of 129) of 537 618 is then obtained. A predic-tion interval for the observed outcome would of course be somewhat larger still.
UNCERTAINTY OF THE FORECASTS
The forecasts for the numbers of fatalities are uncertain in several respects. First, it is assumed
410 Brief Communications and Research Notes
that history repeats itself and that future traf c safety work will be as extensive and successful as
before.
The fact that the model has a very good coef
-cient of determination for the data used to estimate
the model is no guarantee that the model will be as reliable in the future. Different models can be
estimated with almost the same coef cient of
deter-mination, but which nevertheless produce different
forecasts. _
Making forecasts entails extrapolating the
re-gression model outside the area where the
observa-tions were made. Making forecasts differs consider-ably from taking a random sample from a
well-de ned population and performing statistical
infer-ence, i.e. point and interval estimates of expected
values within the range of observations. This
re-quires calculated con dence intervals for forecasts
and the prediction intervals for observed outcomes to be regarded with some caution.
As has already been pointed out, the model is intended to be updated successively as new annual
data become available.
FURTHER NOTES
The model will probably be used also with a division based on fatalities among motorists and
un-protected road users and a division between children and adults. According to the goals, priority is to be given to unprotected road users and, in particular, to children.
The same type of model can also be used for injured persons, although forecasts will be comparatively uncertain compared with those for fatalities. However, a small part of the varition in
the number of injured depends on random
varia-tion. On the other hand, the coef cient of determi-nation is also small and the unexplained variation thereby fairly large. A contributory cause may be a varying degree of reporting of injured persons over time. Another cause may be that further
predictors are required.
Acknowledgements Valuable opinions and suggestions for pro-cessing have been received from Mats Wiklund, VTI. Rune Elvik, Institute of Transport Economics in Norway, has contrib-uted useful information on earlier studies in this eld.
REFERENCES
Brude, U.; Larsson, J. Models for predicting accidents at junctions where pedestrians and cyclists are involved.
How well do they t? Accid. Anal. Prev. 25 1499 509;
1993.
Haight, F. A., editor. Theoretical models for traf c safety.
Special issue. Accid. Anal. Prev. 23(5); 1991. Oppe. S. Macroscopic models for traf c and traf c safety.