Rapport 1 - 2012
Fish, shellfish and fish products
-
analysis of nutrients
Content
Summary ... 2
Background ... 3
Materials and methods ... 4
Sampling ... 4 Farmed fish ... 8 Wild-caught fish ... 9 Fish products ... 10 Shellfish ... 12 Sample handling ... 13
Quality assurance of analytical methods ... 13
Analysed nutrients ... 14
Calculation of nutritional values ... 16
Food classification ... 16
Other information regarding samples... 17
Quality control of published data ... 17
Assessment of nutritive content ... 18
Results and discussion ... 20
Energy and macronutrients ... 20
Fatty acids ... 20
Vitamins ... 22
Trace elements ... 23
Comments regarding nutrients in focus for fish ... 24
Fatty acids ... 24
Vitamin D ... 25
Thank you ... 26
References ... 26
Summary
The Swedish food composition database contains nutritional values of foods in Sweden. In recent years, new fish species have appeared in the fish counters and the nutritional content, for example the fat quality, has been questioned in some of those. In 2010 the National Food Agency therefore analysed the nutrient content of 33 selected fishes, fish products and shellfishes. The selected products
accounted for about 65 percent of the fishes, fish products and shellfishes purchased by consumers in 2009.
The high content of n 3-fatty acids, vitamin D, iodine and selenium in fish and shellfish is an important reason for the Swedish dietary advice "eat fish often, preferably three times a week". Almost all analysed fishes, fish products and shellfishes were rich in n 3-fatty acids. However, the content of n 3-fatty acids was low in the farmed species tilapia and striped catfish as well as in fish balls and fish fingers that are commonly consumed by children. For some fish such as mackerel in tomato sauce, pickled and fresh herring, arctic char and gilt headed bream, the entire recommended daily intake of n 3-fatty acids was covered by one serving (100-150 g).
Only half of the analysed fishes, fish products and shellfishes had a high content of vitamin D, defined as more than 1.6 micrograms per 100 grams. On the other hand, most of these fishes and fish products contained more than the entire recom-mended daily intake per serving. The highest content of vitamin D was found in the lean fish tilapia, which contained about three times the recommended daily intake of vitamin D per 100 grams.
All the analysed fishes, fish products and shellfishes were sources of selenium, and about two-thirds were also sources of iodine. One serving of tuna, mussels or hoki was sufficient to meet the recommended daily intake of selenium, while one serving of cod, saithe or mussels was sufficient for iodine.
The analyses also showed that fish, fish products and shellfish can be classified as sources of protein, vitamin B12 and phosphorus. In particular, concentrations of
vitamin B12 were high and two-thirds of the analysed samples contained more
than the entire daily recommended intake of vitamin B12 per 100 gram.
The analyses were part of the annual analytical project carried out by the Swedish National Food Agency to update the food composition database with nutritional values of commonly consumed foods.
Background
The National Food Agency encourages high levels of fish consumption with the dietary advice "Eat fish often, preferably three times a week". It is therefore important that the nutritional values presented for fish are updated and of good quality. The Swedish food composition database was missing values for certain fish, shellfish and fish products that have increased in popularity in Sweden, e.g., striped catfish, scallops and such a common Swedish product as pickled herring. Therefore an analytical project ”2010 Mat från hav, damm och sjö” (2010 Food from the sea, ponds and lakes) (ref. no. 381/2010) was conducted in 2010/2011. The purpose of the project was to produce new analysis data of missing products for the Ffood composition database, but also to update and complement the nutritional values for fish, shellfish and fish products that are being consumed in great amounts but have not recently been analysed by the National Food Agency. The project group included Veronica Öhrvik and Irene Mattisson from the
Nutrition Department (N) and Christina Åstrand and Sören Wretling from the Science Department, Chemistry Division 2. The analyses were conducted at Chemistry Division 2 by Rasmus Grönholm (fat-soluble vitamins), Anders Staffas (carotenoids), Maria Haglund (fatty acids, sugars), Anders Eriksson (starch, sugars, cholesterol), Anna von Malmborg, Kerstin Thorzell and Hanna Sara Strandler (water-soluble vitamins) and Christina Åstrand (metals). Other nutrients were analysed at the National Veterinary Institute (SVA) and ALcontrol AB Sweden. Head Analysts were Anders Staffas (fat-soluble vitamins and
carotenoids), Sören Wretling (fatty acids, sugars, starch, cholesterol and external analyses), Hanna Sara Strandler (water-soluble vitamins) and Joakim Engman (metals). Veronica Öhrvik and Irene Mattisson (N) planned the analytical project and conducted samplings, calculations and analysis of nutritional values and other information about fish. Rikard Åsgård (N) quality controled compiled data.
Materials and methods
Sampling
The choices of which fish, shellfish and fish products to include in the project were made in accordance with the following criteria:
- Missing foods
For example, tilapia, striped catfish, pickled herring and scallops were not included in the food composition database.
- Incomplete foods
The entries for certain fish, shellfish and fish products in the food composition database had out-dated nutritional values and the documentation was incomplete regarding e.g., the sampling. - High levels of consumption in the households
Based on interviews regarding the household purchases (kg) August 2008 to July 2009 (1).
- High turnover rate in the fish industry and restaurant chains Based on direct inquiries to the companies.
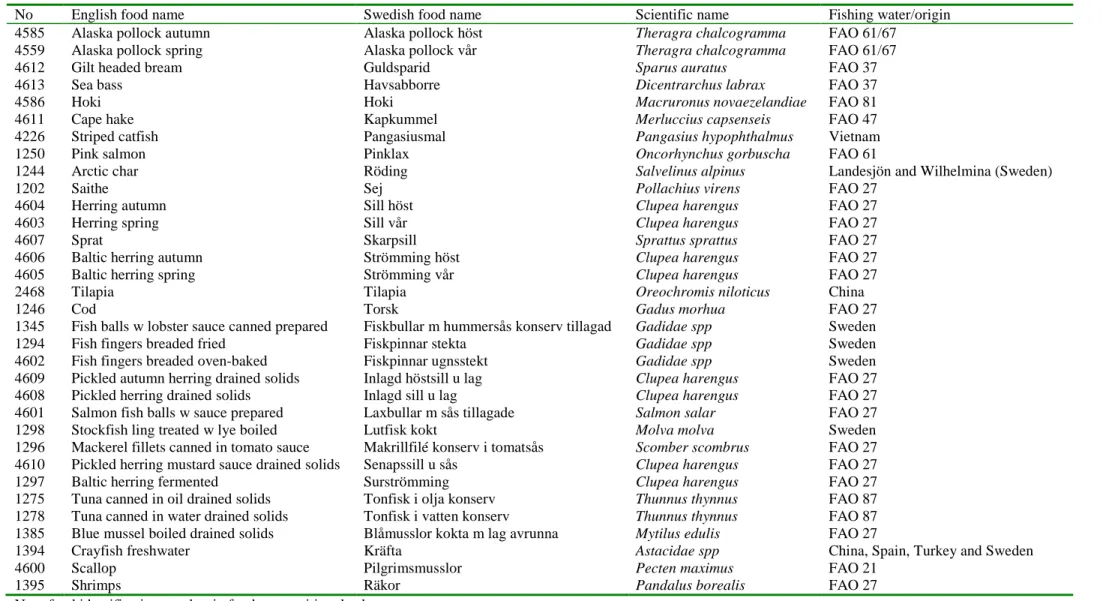
Table 1 shows analysed fish, shellfish and fish products, including their English and Latin name, as well as origin. For a more detailed description of the sub-samples, see Appendix I. The fish, shellfish and fish products that were selected for analysis (table 1) accounted for 65 per cent of the total purchases of fish in Swedish consumers in 2009 (1). Along with the salmon that was analysed at the National Food Agency in 2004, they account for 85 per cent of fish purchases. Several of the fishes are related (see Figure 1), which may explain similarities in nutritional contents.
The sampling is fundamental, and several important aspects that influence the nutritional contents must be taken into consideration in order to acquire high quality food data. For fish for example, the time of catch – before or after spawning – may have a great impact on the fat levels. To achieve averages with reasonable levels of confidence, the number of sub-samples needed per analytical sample is calculated (2). The number of sub-samples needed were calculated for key nutrients in fish – which in the projects was defined as the fatty acid DHA (20:6 n3), vitamin D and iodine in accordance with the formula:
Number of samples ≥ (t α n-1)2 ×standard deviation2/(precision×mean value)2
Where alpha is set at 0.05 and precision at 0.1. Standard deviation, mean value and n-1 for the calculation of DHA were borrowed from Torstensson et al 2003 (3) and Usydus et al 2009 (4). Values from Usydus et al 2009 (4) was also used
It was decided that each aggregate sample would consist of at least 12 specimens in order to obtain a representative sample for quantifying DHA and selenium. The aggregate samples weighed at least 1.5 kg which means that substantially more than 12 specimens of fish and shellfish were used for most species (see Appendix I).
Table 1. Food number, english, swedish and scientific name as well as fishing water/origin for analysed samples
No English food name Swedish food name Scientific name Fishing water/origin 4585 Alaska pollock autumn Alaska pollock höst Theragra chalcogramma FAO 61/67
4559 Alaska pollock spring Alaska pollock vår Theragra chalcogramma FAO 61/67
4612 Gilt headed bream Guldsparid Sparus auratus FAO 37
4613 Sea bass Havsabborre Dicentrarchus labrax FAO 37
4586 Hoki Hoki Macruronus novaezelandiae FAO 81
4611 Cape hake Kapkummel Merluccius capsenseis FAO 47
4226 Striped catfish Pangasiusmal Pangasius hypophthalmus Vietnam
1250 Pink salmon Pinklax Oncorhynchus gorbuscha FAO 61
1244 Arctic char Röding Salvelinus alpinus Landesjön and Wilhelmina (Sweden)
1202 Saithe Sej Pollachius virens FAO 27
4604 Herring autumn Sill höst Clupea harengus FAO 27
4603 Herring spring Sill vår Clupea harengus FAO 27
4607 Sprat Skarpsill Sprattus sprattus FAO 27
4606 Baltic herring autumn Strömming höst Clupea harengus FAO 27
4605 Baltic herring spring Strömming vår Clupea harengus FAO 27
2468 Tilapia Tilapia Oreochromis niloticus China
1246 Cod Torsk Gadus morhua FAO 27
1345 Fish balls w lobster sauce canned prepared Fiskbullar m hummersås konserv tillagad Gadidae spp Sweden 1294 Fish fingers breaded fried Fiskpinnar stekta Gadidae spp Sweden 4602 Fish fingers breaded oven-baked Fiskpinnar ugnsstekt Gadidae spp Sweden 4609 Pickled autumn herring drained solids Inlagd höstsill u lag Clupea harengus FAO 27 4608 Pickled herring drained solids Inlagd sill u lag Clupea harengus FAO 27 4601 Salmon fish balls w sauce prepared Laxbullar m sås tillagade Salmon salar FAO 27 1298 Stockfish ling treated w lye boiled Lutfisk kokt Molva molva Sweden 1296 Mackerel fillets canned in tomato sauce Makrillfilé konserv i tomatsås Scomber scombrus FAO 27 4610 Pickled herring mustard sauce drained solids Senapssill u sås Clupea harengus FAO 27
1297 Baltic herring fermented Surströmming Clupea harengus FAO 27
1275 Tuna canned in oil drained solids Tonfisk i olja konserv Thunnus thynnus FAO 87 1278 Tuna canned in water drained solids Tonfisk i vatten konserv Thunnus thynnus FAO 87 1385 Blue mussel boiled drained solids Blåmusslor kokta m lag avrunna Mytilus edulis FAO 27
Farmed fish
Tilapia
Tilapia is primarily farmed in China and, in 2009, accounted for 0.1 per cent of Swedish fish purchases (1). As tilapia was one of the most common fish for consumption in the USA, it was also expected to become increasingly common in Sweden. Tilapia were mainly sampled at the National Food Agency's border inspections, however, during the sampling period, the number of shipments of tilapia were too few for a complete sample, so tilapia was also purchased directly from three different retail chains.
Striped catfish
Striped catfish accounted for approximately 4 per cent of Swedish fish purchases in 2009 (1). Striped catfish is a fresh water fish farmed primarily in Vietnam. All of the farmed product is exported (6). Striped catfish were sampled from nine different shipments at the National Food Agency's border inspections in
Gothenburg and Helsingborg. Two samples were also purchased directly from a retail outlet.
Sea bass
Known also as bass. Sea bass is often sold fresh and whole at the fish counter. The fish are farmed around the Mediterranean and is primarily exported by Greece. Sea bass was bought fresh from fishmongers from three different Greek
deliveries.
Gilt headed bream
Also known as a gilt-head sea bream. Gilt headed bream is often sold fresh and whole at the fish counter. The fish are farmed around the Mediterranean and is primarily exported by Greece. Gilt headed bream was bought fresh from fishmongers from three different Greek deliveries.
Arctic char
Arctic char is found both wild and farmed in Sweden. It is becoming more common in fish counters and Sweden, and with its 500-800 tonnes per year, accounts for approximately 15-20 per cent of the total arctic char farming in the world (7). Arctic char farming in Sweden is expected to increase and it is estimated that the total production could reach 50,000 tonnes per year in the country's storage reservoirs (7). The water temperature needs to be below 15 degrees, therefore farms are mainly found in Jämtland and Västerbotten. The largest farm in Sweden is found in Wilhelmina and has a capacity of 2,000 tonnes, corresponding to the total Swedish consumption (7). Arctic char were sampled immediately after slaughter from three different fish farms in Sweden.
Wild-caught fish
Alaska pollock
Alaska pollock is globally the second most wild-caught fish. In 2008, 2.7 million tonnes of Alaska pollock was caught in the world (6). In Sweden, Alaska pollock accounts for more than 4 per cent of fish purchases (1). The price of Alaska pollock has doubled in the last ten years and is now priced at approximately 2 US$/kg (6).
Alaska pollock were sampled at the National Food Agency's border inspections in Gothenburg and Helsingborg. Samples of Alaska pollock caught in spring were taken from four shipments and autumn samples were taken from six shipments.
Hoki
In Sweden, hoki accounts for approximately 1 per cent of fish purchases (1). Hoki were sampled by the National Food Agency's border inspections, however, during the sampling period, the number of shipments of hoki were too few for a complete sample, so hoki was also purchased directly from three different retail chains.
Pink salmon
Pink salmon is also known as humpback salmon. Pink salmon belongs to the same family as the farmed salmon, i.e., salmonids (Salmondidae, Figure 1), but is of a different genus (Pacific salmon, Oncorhynchus, Figure 1). Pink salmon was purchased from two different retail chains on two separate occasions.
Cape hake
Cape hake from the waters outside Cape Horn (coast of South Africa) were sampled by the National Food Agency's border inspections in Gothenburg and Helsingborg. As there were too few shipments during the sampling period, cape hake was also purchased from two different retail chains.
Herring (Baltic herring)
The volumes of herring and Baltic herring fished in Sweden in the last 5 years have varied between 80,000 and 90,000 tonnes, making herring the most
important economic fish in Sweden (8). Herring caught north of Kalmar is called Baltic herring (9). Baltic herring are smaller and leaner due to the lower salt content in the Baltic Sea.
The fat content in herring varies greatly during the year as the herring do not eat when migrating to and from spawning. The fat content following migration can therefore be up to 3.5 times lower than during the summer (10). In order to get a more reliable sample of herring and Baltic herring, sampling was conducted both in spring and autumn. Herring were sampled during spring (March-April 2010) and autumn (September 2012) at weekly intervals directly from 4 different landings of herring caught in the Kattegatt or Skagerack. Baltic herring (spring, February-March 2010) came from the Dioxin Project (11) and had been fished in
the Baltic Sea from a total of 10 different locations (catch zone 25-28) on two separate occasions. Autumn sampling of Baltic herring was conducted by purchasing fresh herring in September 2010 from three different fishmongers.
Sprat
Sprat which is landed in Sweden, approximately 85,000 tonnes (8), is primarily used for fishmeal and oil, but also for anchovies and brisling (previously marketed as sardines). Sprat is popular as a food fish in Eastern Europe. The analysed sprat came from the Dioxin Project (11) and had been fished in the Baltic Sea from a total of 11 different locations (catch zone 25-28) on two separate occasions.
Cod and saithe
Cod and saithe account for approximately 7 per cent of the total fish purchases (1). Cod fishing in Sweden has remained constant at approximately 13,000 tonnes in the last five years, and saithe fishing has fluctuated between 1,500 and 2,000 tonnes per year (8). Cod was last analysed in 1984 for the food composition database but, owing to the high level of consumption, it was important to update the nutritional values for cod in the food composition database. In order to achieve an adequate spread of catch areas, fishermen and seasons, two fresh fillets of cod and two of saithe were purchased every week for six weeks in March and April 2010.
Fish products
Fish balls in lobster sauce
Fish balls account for approximately 4 per cent of fish purchases (1). Lobster sauce was chosen as it is the most common. Fish balls from five different batches of the same brand were included in the sampling. The fish balls with sauce contained 33 per cent meat from cod, haddock, saithe and hake and 0.5 per cent lobster meat. Other ingredients included milk, water, potato flour, rape-seed oil, salt, spice extracts, cream, modified starches, tomato paste, locust bean gum, fish broth extract and aromatics. The fish balls and sauce were heated to 65-70 ⁰C in a microwave prior to analysis, in accordance with the package instructions.
Salmon fish balls in west coast sauce
Salmon balls are becoming more common in stores. West coast sauce was chosen for the sampling as the fish origins in this product were more limited. Salmon balls from five different batches of the same brand were included in the sampling. The salmon balls with sauce contained 30 per cent fish meat (of which 52 per cent was salmon). Other ingredients included milk, water, potato flour, salt, cream, powdered milk, tomato paste, rape-seed oil, modified starches, crab, yeast extract, guar gum, dill and spices. The salmon balls and sauce were heated to 65-70 ⁰C in a microwave prior to analysis, in accordance with the producer's
Fish fingers
Fish fingers and breaded fish account for 6 per cent of Swedes' fish purchases (1). The values for fish fingers found in the food composition database were of
unknown origin and were registered prior to 1989. Since then, the fish content and the species of fish included in the fish fingers have partly been modified, which is why it was needed to update the nutritional values in fish fingers. Five different products were included in the sampling, all containing different species of cod (Figure 1) with around the same proportion of fish (61-65 per cent). In addition to the fish presented in Appendix 1, ingredients included: water, rape-seed oil or sunflower oil, wheat flour, starch, yeast, salt and spices. Fish fingers were analysed both fried in cooking fat and heated in the oven in accordance with the package instructions.
Mackerel fillets canned in tomato sauce
Mackerel is, after herring and tuna, the most common canned fish consumed in Sweden and accounts for approximately 4 per cent of all fish purchases (1). The mackerel sampled consisted of seven different brands of mackerel in tomato sauce. The fish content varied from 60-70 per cent. In addition to mackerel, the products contained water, tomato paste and salt, some products also contained oil, sugar and antioxidants.
Stockfish
Approximately 2 per cent of the Swedes' fish purchases are stockfish (1). Three different types of stockfish were included in the sampling, all containing additional water, lime and soda.
Fermented Baltic herring
Fermented Baltic herring accounts for approximately 0.2 per cent of all Swedish fish purchases (1). Four different fermented Baltic herring products were included in the sampling.
Pickled herring
Almost 15 per cent of the fish purchases are pickled herring (1). As the fat content for pickled herring varies significantly (10 to 16 g/100g in the samples), it was important to take many samples with different fat contents. Sampling were therefore carried out by the pickled herring producer ABBA. In addition to pickled herring, onions and water, the drained pickled herring sample included sugar, salt, onion, vinegar, carrots, spices, aromatics and preservatives (E211). In the pickled herring in mustard sauce sample, in addition to herring, ingredients also included water, rape-seed oil, ground mustard seed, salt, vinegar, a thickening agent, preservatives, spices and colouring. The drained pickled autumn herring sample contained our finest herring and, in addition to herring, ingredients also included water, sugar, rape-seed oil, ground mustard seed, salt, vinegar, a thickening agent, preservatives, spices and colouring.
Tuna
Canned tuna accounts for almost 5 per cent of Sweden's fish purchases (1). Until now, the majority of canned tuna sold is tuna canned in water, but since tuna in oil is becoming more popular, both tuna in water and tuna in oil were analysed. During the sampling, the 7 different production sites within the operations of the chains Axfood, Coop and ICA were taken into account. The tuna sold in 2010 came primarily from Thailand, but also from Colombia and Mauritius. In addition to tuna, the ingredients included water or sunflower oil, with most of the products also including salt. Tuna needed to be analysed as the old values for tuna were lacking documentation and were analysed or borrowed mainly from the USA prior to 1989.
Shellfish
Blue mussels
In 2009, blue mussels accounted for nearly 1 per cent of the shellfish purchases in Sweden (1). In Sweden, there are approximately 15 mussel farms, owned by five companies, two of which maintain the dominant share of the market (7). The National Food Agency regularly inspects elevated levels of algal toxins and E. coli bacteria in mussels (12). Blue mussels are harvested at the age of 18 months (7). Fresh (live) mussels from two different farming facilities were purchased from three fishmongers in Uppsala.
Scallops
The consumption of scallops in Sweden, measured in kilos, is low (1). In 2010, 2 kg of scallops were caught through commercial fishing in Sweden (8). Scallops were imported frozen from the USA, 1 sample a week for three weeks.
Crayfish
Sweden imports approximately 3,000 tonnes of processed crayfish every year, primarily from China, Turkey and North America (7). 1,500 tonnes of crayfish are caught/fished in Sweden (7). When selecting crayfish, the country of origin, size and the favourites in the year's crayfish test (2010) were taken into account. Swedish, Chinese, Spanish and Turkish crayfish were included in the sampling.
Shrimp
Shrimp accounts for approximately 70 per cent (1) of shellfish purchases and, as documentation was lacking regarding the values for shrimp presented in the Food composition database, it was important to update these values. The aggregate sample consists of a mixture of peeled and unpeeled shrimp of different sizes (from 44-66 pcs/kg to 80-100 pcs/kg) from six different batches.
Sample handling
Upon arrival of the samples to the laboratory, each sample was given a unique number, making it possible to trace the samples back to the producers. All samples were analysed as pooled samples (see Appendix 1).
The samples were handled as laboratory samples as soon as they had come to the laboratory, which includes taking into account factors that may affect stability, such as oxygen and temperature. Some analysed substances are also sensitive to certain wavelengths of visible light. Fresh and frozen fish, frozen fish products and shellfish were stored in their original packaging at -20 ºC. Pickled herring, mackerel, canned tuna, fermented Baltic herring, stockfish, fish balls, salmon fish balls and blue mussels were stored in a dark refrigerated room at a temperature of 3 ºC until the sample preparation.
At least 12 fillets of each fish species were sampled with a total weight of 1.5 kg per species.
It is essential that the samples for analysis are pulverised and homogenous, therefore a food processor was used during the homogenisation of all samples. Following homogenisation, the samples were divided into different jars depending on storage conditions and type of analysis.
Analyses of ash, total fat, nitrogen, water content, sodium, potassium, calcium, magnesium, phosphorus, molybdenum, selenium and iodine were performed at the National Veterinary Institute. The fat content of pink salmon was analysed at ALcontrol AB Sweden. Other analyses were conducted at Chemistry Division 2 at the National Food Agency. The principles that apply to the methods used and the methods which were accredited can be found in Appendix II. The nutrient values are presented in Appendix III, Table 1-6.
Quality assurance of analytical methods
The laboratory at Chemistry Division 2 has extensive experience, both with the analysis of nutrients and quality assurance. Many of the methods used have been accredited since 1995 by SWEDAC, the Swedish accreditation authority, but improvements in the methods used, accreditation of new methods and/or
supplementation of the accreditation is a continuous process. The quality system includes procedures, analytical methods and instructions. The quality of the analysis results is routinely inspected through analysis of internal control samples and, where possible, certified reference material. Recovery tests and analysis of blank samples are part of the quality assurance.
Chemistry Division 2 participates regularly in proficiency testing for laboratories, both with accredited and non-accredited methods, and has also organised
proficiency testing, the same sample was sent to a number of interested
laboratories that analysed the sample using customary analytical methods. The analysis results are then compiled by the person responsible for the proficiency testing and processed statistically. Each participant is given their own number so that, in the final report, the different results can be compared without the
possibility of linking the results to a specific laboratory.
Analysed nutrients
The fish, shellfish and fish products analysed for nutrient content are listed in Table 2. Logical zeros for fish and shellfish, i.e., nutrients not assumed to be present in fish and shellfish, were carbohydrates (fibre, sugars, starches), alcohol, trans fatty acids, vitamin D2 and vitamin C. Logical zeros for fish products were
alcohol, vitamin D2 and vitamin C.
Folate (total concentration) was analysed in a selection of samples:
Stock fish - analysed because some folate forms are very unstable at high pH values and folate values on stock fish are missing in other national food tables (13).
Drained pickled herring - analysed as folate levels can be affected by storage and loading. Folate values on pickled herring are missing in other national food tables (13).
Striped catfish - analysed because breeding involves only feedstuff of
vegetable origin. Folate values on striped catfish are missing in other national food tables (13).
Cape hake is analysed as there are no values available to borrow. Transferring data from the closest relatives, cod, Alaska pollock and saithe (Figure 1), does not provide reliable values, as fishing water and other factors differ.
Fish balls are analysed because the Swedes purchase a large amount of fish balls; 3.6 per cent of all fish and shellfish purchases (1). Missing in other national food tables (13).
Folate values for other analysed samples are transferred from similar food (pink salmon and sprat) or borrowed from other national food tables (other samples).
Table 2. Analysed nutrients
Macronutrients Water, fat, nitrogen, ash Carbohydrates (only
fish products and shellfish)
Starch, glucose and fructose (monosaccharides), lactose, sucrose and maltose (disaccharides)
Cholesterol Cholesterol
Fatty acids 4:0, 6:0, 8:0, 10:0, 12:0, 13:0, 14:0, 14:1, 14:1trans, 15:0i, 15:0 ai, 15:0, 15:1, 16:0i, 16:0ai, 16:0, 16:1, 16:1trans, 16:2n 4, 16:3, 16:4n 3, 17:0i, 17:0ai, 17:0, 17:1, 18:0 i, 18:0 ai, 18:0, 18:1, 18:1trans, 18:2, 18:2cis n 6, 18:2trans, 18:2 conj, 18:3n 3, 18:3n 6, 18:3trans, 18:4 n 3, 20:0, 20:1, 20:2n 6, 20:3n 3, 20:3n 6, 20:4n 3, 20:4 n 6, 20:5n 3, 21:5n 3, 22:0, 22:1, 22:2n 6, 22:4n 3, 22:4n 6, 22:5n 3, 22:5n 6, 22:6n 3, 23:0, 24:0, 24:1n 9 Fat-soluble vitamins Trans-retinol, carotenoids, (alpha- and beta-carotene,
beta-cryptoxanthin, lutein, lycopene, zeaxanthin), vitamin D3, vitamin K1 and K2 and tocopherols (alpha-,
beta-, gamma- delta-tocopherol)
Water soluble vitamins Thiamine (thiamine chloride HCl), riboflavin, niacin (total concentration), vitamin B6 (free and bound for fish
products, only free for other samples), vitamin B12 (total
concentration) and folate (total concentration in
stockfish, drained pickled herring, striped catfish, cape hake and fish balls)
Trace elements Phosphorus (P), iodine (I), iron (Fe), calcium (Ca), potassium (K), magnesium (Mg), sodium (Na),
selenium (Se), zinc (Zn), copper (Cu), chromium (Cr), manganese (Mn), molybdenum (Mo), nickel (Ni), cobalt (Co), cadmium (Cd), lead (Pb)
Calculation of nutritional values
The results of the analysis were transferred automatically to the Swedish Food System, the National Food Agency's internal IT system for food data. Each value was registered together with information such as the analytical method,
laboratory, and reference.
In the case of herring, Baltic herring and Alaska pollock, an annual average was calculated and published, representing an average of the nutritional values of the two analytical sessions.
Energy, protein, total carbohydrate levels, fatty acids, retinol equivalents, niacin equivalents and salt are calculated, see Table 3. As part of the calculations, the value zero is used for levels "below the detection limit".
Table 3. Calculation of nutritional values
Energy (kJ) Carbohydrates (g) × 17.0 + protein (g) × 17.0 + fat (g) × 37.0
Energy (kcal) Energy (kJ) × 0.129
Protein (g) Nitrogen (g) × 6.251
Fatty acids (g) Fatty acids (%) × fat ×factor2 Total carbohydrates (g)
(only fish products)
100 - (water (g) + ash (g) + protein (g) + fat (g)) Retinol equivalents β-carotene (μg) / 12 + (α-carotene (μg) +
β-cryptoxanthin (μg)) / 24
Niacin equivalents Niacin (mg) + protein (g) × 10 × 1.13 / 60
Salt/NaCl (g) Na (mg) × 2.5 / 1000
1 Factor for the calculation of nitrogen to protein in fish
2 Factors for the calculation of fatty acids: fat fish (> 5 % fat) 0.9; lean fish (< 5 % fat) 0.7 3 Factor for estimating the percentage tryptophan in fish/meat
Food classification
Fish, shellfish and fish products are classified in accordance with LanguaL (www.langual.org). LanguaL is a method employed internationally for the systematic description of food. This information is published with the nutritional values in the NFA's search function ‘Search nutrient content’
Other information regarding samples
In addition to nutrients and classifications, images displaying dimensions and pictures from sample preparation are published in the Swedish Food System. Records from sample preparation and any cooking processes, as well as portion weight, are also published in the Swedish Food System.
Quality control of published data
All the inputted data was checked prior to publishing the results from the analysis project, see Table 4.
Table 4. Quality control
Nutrient Control
Protein Factor was checked
Niacin equivalents Factor was checked
Logical zeros Checked
Carbohydrates (only fish products) Calculated carbohydrates (g) - (monosaccharides (g) + disaccharides (g) + starch (g)) = 100 ± 4
Macronutrients Σ (fat + protein + water + carbohydrates + ash) =
100 ± 0.5
Units Checked
Langual classification Checked
Nutritional values Checked
Detailed information on nutritional values
Checked
Portion weight Checked
Assessment of nutritive content
Assessment of the nutritive content in fish, fish products and shellfish was conducted in accordance with Commission Regulation (EC) No 1924/2006 (14). Concentrations of nutrients were compared with the conditions for nutrition claims regarding labelling, see Table 5.
Table 5. Nutrition claims and conditions of use
Low fat the product contains no more than 3 g of fat per 100 g for solids Low in saturated fat the sum of saturated fatty acids and trans-fatty acids in the
product does not exceed 1,5 g per 100 g for solids and must not provide more than 10 % of energy
Low sugar contains no more than 5 g of sugars per 100 g for solids Low salt contains no more than 0,12 g of sodium per 100 g for solids Source of protein at least 12 % of the energy value of the food is provided by
protein
High in protein at least 20 % of the energy value of the food is provided by protein
Source of
vitamins/minerals
at least a significant amount (15 per cent of the recommended daily intake) (see Table 6).
High in
vitamins/minerals
at least twice the value of ‘source of’ (see above as well as Table 6).
Source of omega 3 fatty acids1
at least 0.3 g alpha-linolenic acid per 100 g and per 100 kcal or at least 40 mg of the sum of eicosapentaenoic acid and
docosahexaenoic acid per 100 g and 100 kcal. High in omega 3 fatty
acids1
at least twice the value of ‘source of’ (see above). 1
In accordance with the supplement of Commission Regulation (EC) No 1924/2006 (14) and Commission Regulation (EC) No 116/2010 (15)
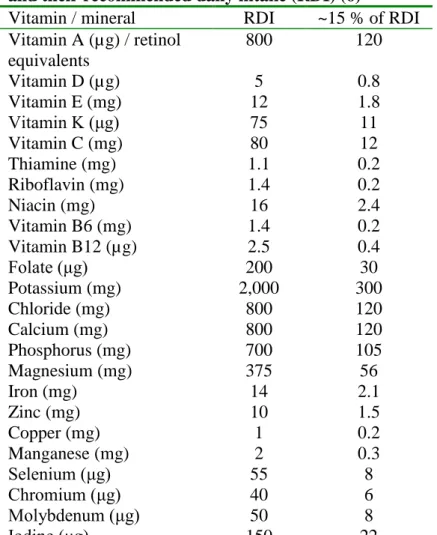
With regard to the assessment of vitamins and minerals, the levels were compared with RDI values for labelling specified in Commission Directive 2008/100/EC (16), see Table 6.
Table 6. Vitamins and minerals that may be declared and their recommended daily intake (RDI) (6)
Vitamin / mineral RDI ~15 % of RDI
Vitamin A (µg) / retinol equivalents 800 120 Vitamin D (µg) 5 0.8 Vitamin E (mg) 12 1.8 Vitamin K (μg) 75 11 Vitamin C (mg) 80 12 Thiamine (mg) 1.1 0.2 Riboflavin (mg) 1.4 0.2 Niacin (mg) 16 2.4 Vitamin B6 (mg) 1.4 0.2 Vitamin B12 (µg) 2.5 0.4 Folate (μg) 200 30 Potassium (mg) 2,000 300 Chloride (mg) 800 120 Calcium (mg) 800 120 Phosphorus (mg) 700 105 Magnesium (mg) 375 56 Iron (mg) 14 2.1 Zinc (mg) 10 1.5 Copper (mg) 1 0.2 Manganese (mg) 2 0.3 Selenium (μg) 55 8 Chromium (μg) 40 6 Molybdenum (μg) 50 8 Iodine (μg) 150 22
Valid per serving for individual packaged portions, otherwise per 100 g (16)
Correlations between various nutrients were checked using Pearson's correlation coefficient. Minitab® v. 15.1.0.0 (Minitab Ltd., Coventry, UK) was used for statistical analyses.
Results and discussion
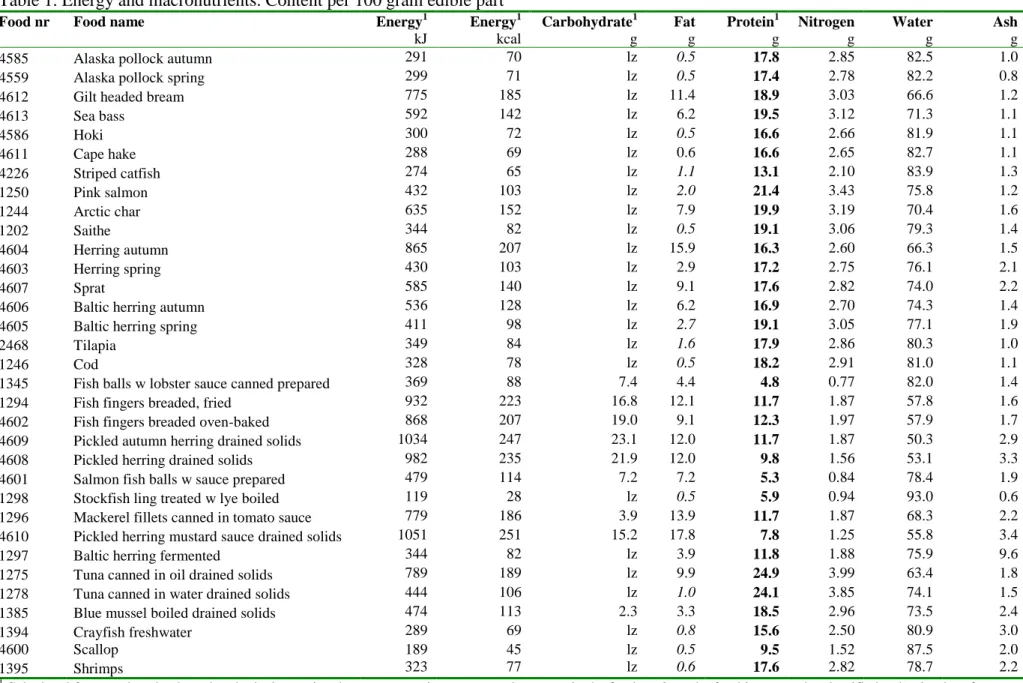
Brief information regarding analysed fish, fish products and shellfish is found in Table 1, with further information found in Appendix I. Nutrient levels per 100 grams are presented in alphabetical order for fish, followed by fish products and shellfish in Appendix III, Table 1-6.
Energy and macronutrients
Results concerning energy and macronutrients in all samples are presented in Appendix III, Table 1. All the analysed fish, fish products and shellfish can be classified as a source of protein. The levels in fish and shellfish varied between 15 and 20 g/100 g. Protein content was highest in pink salmon (21.4 g/100 g) and lowest in scallops (9.5 g/100 g). In the case of fish where seasonal samples were taken, the seasonal variation was less than 15 per cent, which, for example, can be due to sampling or measurement uncertainty during analysis. Protein content varied greatly between different fish products; canned tuna contained 24 g/100 g, while the content of the fish and salmon balls (whose fish content was approx. 1/3) was around 6 g/100 g.
Fat content varied greatly between fish (0.5-16 g/100 g) and for some species, fat content varied throughout the year. Autumn herring, which was the fattiest fish analysed, contained 16 g fat /100 g, while the fat content of herring in the spring was only one-fifth (3 g/100 g). The fat content for Baltic herring in the spring was 45 per cent of the fat content in the autumn, while Alaska pollock, being a leaner fish, did not present any measurable difference in fat content between spring and autumn samples. All fish in the cod family (Gadiformes, Figure 1) and shellfish had a low fat content of less than 1 g/100 g. The fish products were generally fattier than the fish and shellfish due to the common addition of vegetable oils such as sunflower oil (tuna and some fish fingers) or rape-seed oil (pickled herring in mustard sauce and some fish fingers).
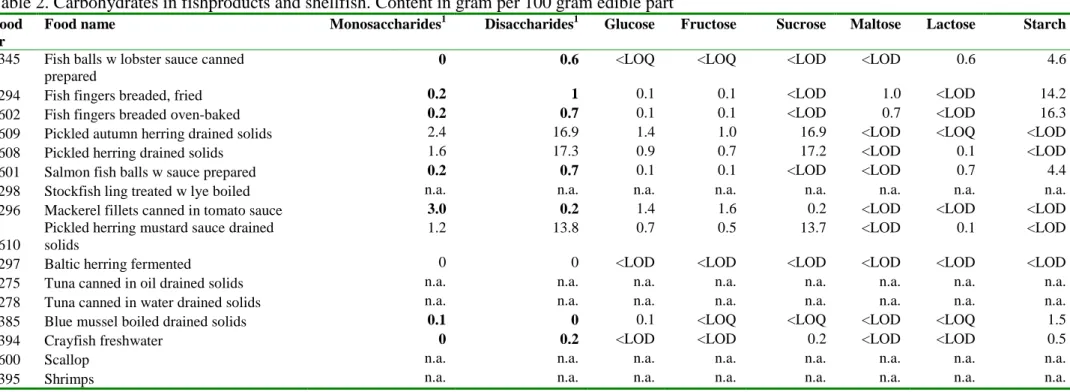
Results for carbohydrates in fish products and processed shellfish are presented in Appendix III, Table 2. The carbohydrate content was highest in pickled herring which mainly consisted of sucrose (16 g/100 g), and fish fingers which mainly contained starch (15 g/100 g).
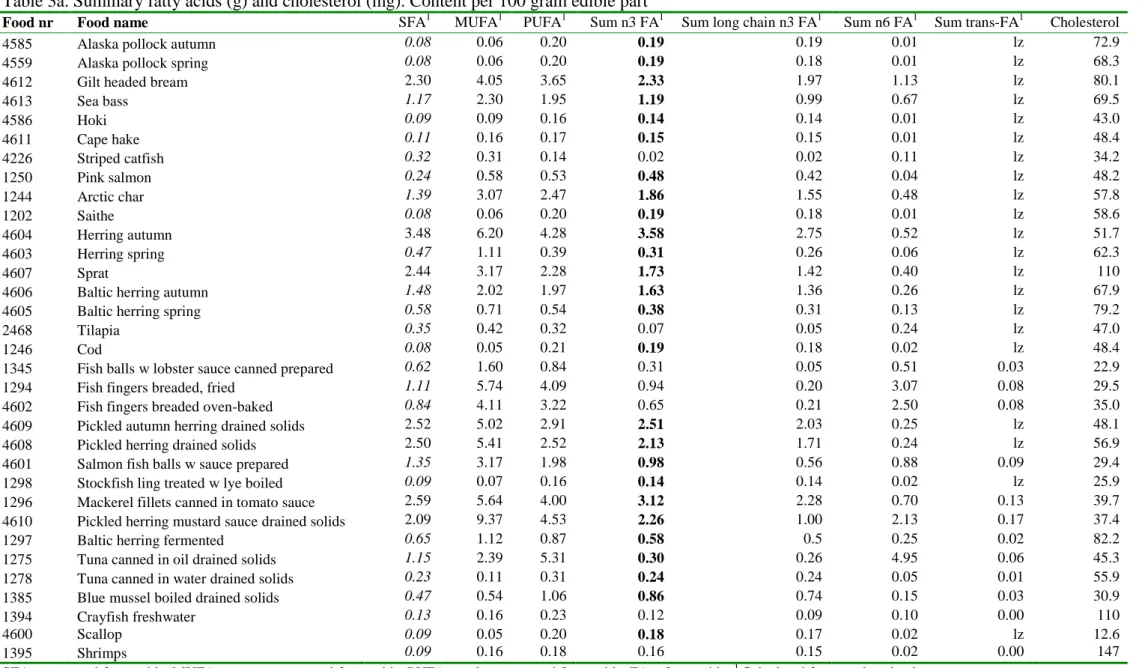
Fatty acids
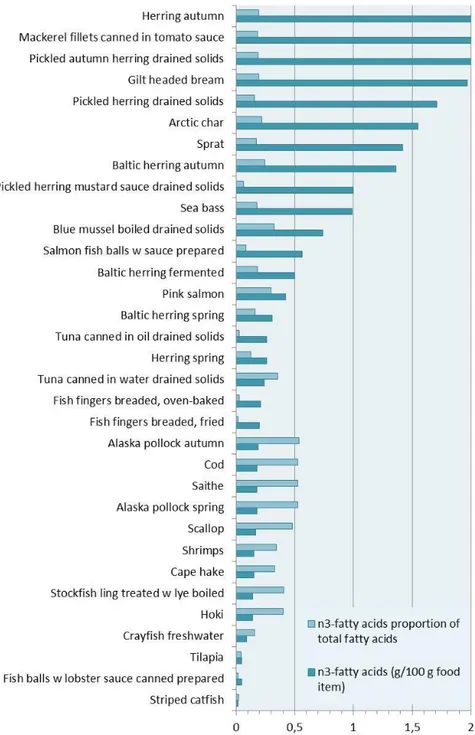
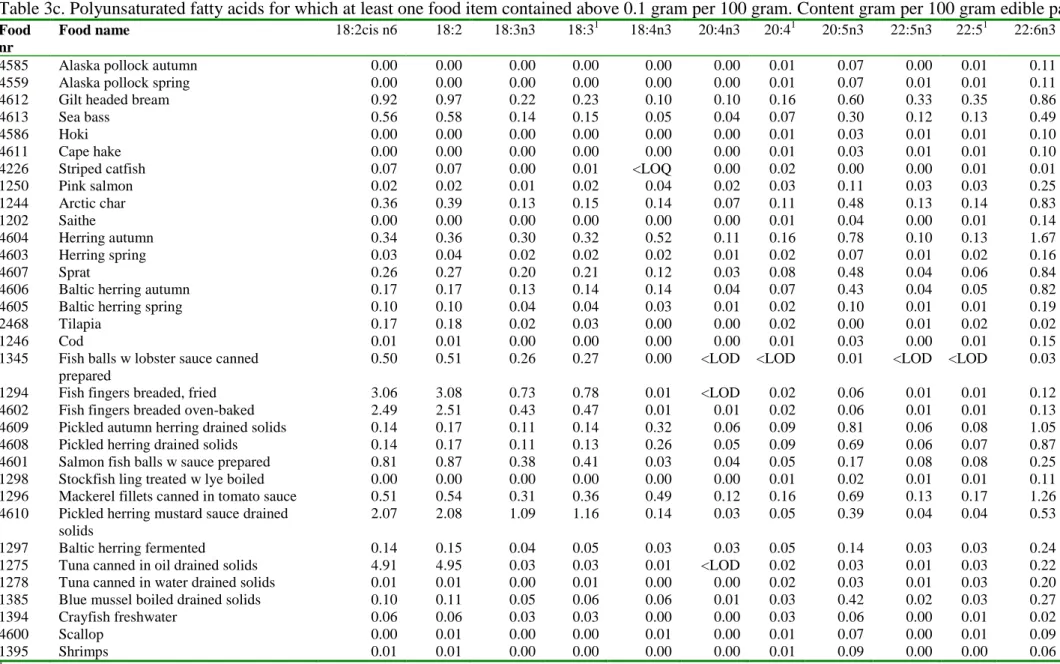
Results for all fatty acids, where samples contained more than 0.1 g/100 g, are presented in Appendix III, Table 3a-3c. In Figure 2, fish, shellfish and fish
times a week. The content of long-chain n-3 fatty acids strongly correlates to the fat content (p<0.001), however, the ratio of long-chain n-3 fatty acids to other fatty acids is approximately twice as high in the lean cod fish species
(Gadiformes, Figure 1) when compared with other fish (Figure 2).
Figure 2. Analysed fish, fish products and shellfish were ranked according to the content of long-chain n-3 fatty acids, i.e., the sum of 20:3 n-3 + 20:4 n-3 + 20:5 n-3 + 21:5 n-3 + 22:4 n-3 + 22:5 n-3 + 22:6 n-3. The red line marks the level of 20:5 n-3 + 22:6 n-3 required for a food to be classified as a source of n-3 fatty acids (0.04 g/100 g and 100 kcal). 20:5 n-3 + 22:6 n-3 in the analysed fish, fish products and shellfish constitutes between 74 and 100 per cent of the sum of long-chain n-3 fatty acids.
Vitamins
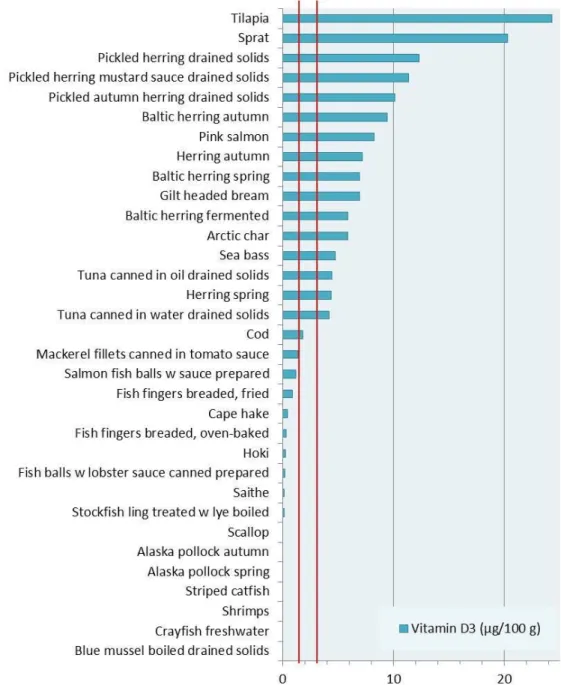
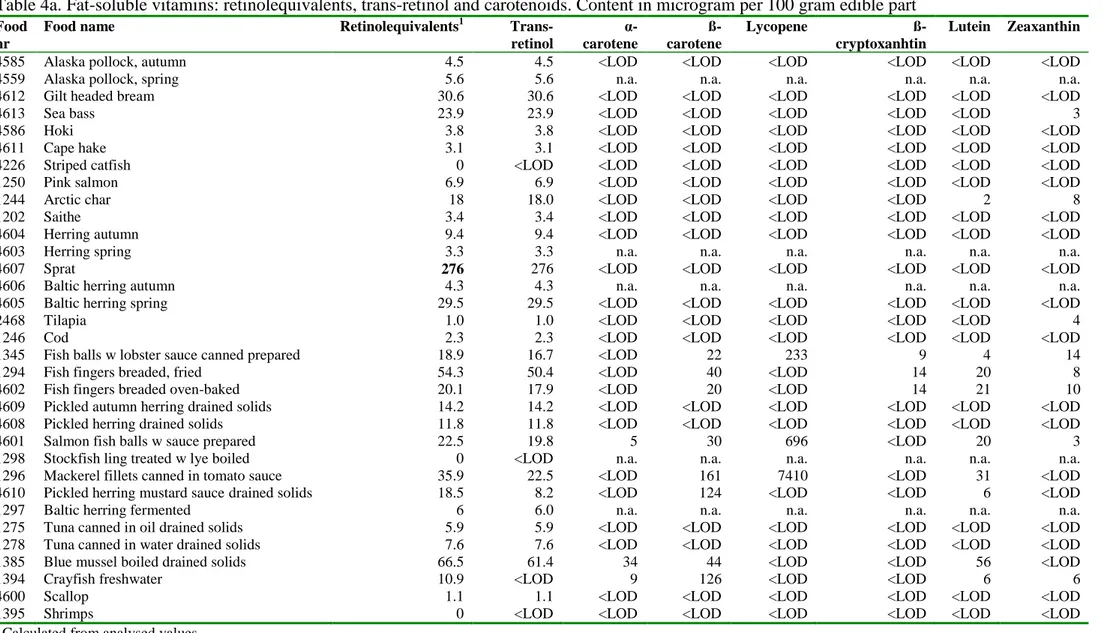
The results for fat-soluble vitamins are presented in Appendix III, Table 4a and 4b, and for water-soluble vitamins, Table 5. In addition to fatty acids, the content of vitamin D in fish is an important reason for the recommendation "Eat fish often, preferably three times a week." Approximately half of the fish, fish products and shellfish could be classed as a good source of vitamin D (Figure 3, Table 6). Whereas the other fishes, fish products and shellfish not could be classed as a source of vitamin D.
The higher the fat content, the higher the level of the fat-soluble vitamins D (p = 0.05), E (p = 0.02) and K (p = 0.04). However, the vitamin A content (trans-retinol) did not vary with the fat content. Only shellfish and fish products containing vegetable oil were a source of vitamin E and only sprat could be classed as a source of vitamin A. Pickled herring in mustard sauce was a source of vitamin K, which is likely due to the presence of rape-seed oil. The carotenoid content was below the detection limit for all fish and shellfish with the exception of lutein in Arctic char and zeaxanthin in the farmed fish sea bass, char and tilapia. The concentrations of carotenoids were high in some of the fish products, particularly lycopene in mackerel fillets canned in tomato sauce.
Of the water-soluble vitamins, fish is primarily a source of vitamin B12 (Table 6).
All the analysed fish, fish products and shellfish were a source of vitamin B12,
except for striped catfish and cooked stockfish, fish balls and salmon fish balls. Several of the fish including herring (Figure 1), shrimp and crayfish, contained the entire recommended daily intake of vitamin B12 per 100 grams. All the fish can be
classed as a source of vitamin B6, apart from species of cod (not saithe), tilapia
and striped catfish. Among the fish products and shellfish, only mackerel fillets canned in tomato sauce and the tuna were sources of vitamin B6. The content of
niacin correlated to the content of vitamin B6 (R = 0.94, p <0.000) and, with the
exception of saithe and tilapia, the same fish that were classified as a source of vitamin B6 could be classed as a source of niacin.
Trace elements
The results for trace elements are presented in Appendix III, Table 6a and 6b. Apart from salmon balls, all analysed samples were a source of selenium (Table 6). Salmon in itself does not contain less selenium than other fish. The low selenium content is probably explained by a dilution effect from other ingredients (approximately 1/3 of the salmon balls consist of fish). Tuna and blue mussels contained more than the recommended daily intake of selenium per 100 grams. The iodine content in food depends greatly on its origin. Mainly fish and fish products containing fish from the Baltic Sea, the Kattegat and Skagerrak (FAO 27, Table 1), i.e., herring fish (Figure 1), cod and saithe could be classed as a source of iodine. All analysed samples except pickled herring, fish balls, salmon balls and stockfish, were also a source of phosphorus, a vitamin of importance for skeletal development.
The fish products or shellfish could not, with the exception of stockfish, be classed as food with a low salt content according to the defining parameters of less than 120 mg sodium per 100 g (Table 6). Fish farmed in fresh water and caught in the Baltic Sea had a sodium content of less than 120 mg per 100 g, as expected. For example, Baltic herring only contains 1/3 the sodium of other herring. The high sodium content in striped catfish farmed in rivers was
surprising, but most likely due to the addition of stabilisers containing sodium (for example, sodium polyphosphate, E452) to retain water during processing. The
sodium content in striped catfish was in line with previously reported content from Italy (17). The highest sodium content was found in fish products requiring high amounts of added salt for microbiological reasons, and also in shellfish.
Comments regarding nutrients in focus for fish
Fatty acids
A human's production of long-chain n-3 fatty acids from short-chain n-3 fatty acids is limited (18) and it is therefore recommended that we eat food containing the long-chain n-3 fatty acids, such as fish. Of the analysed fish, fish products and shellfish in this project, most could be classed as having a high content of n-3 fatty acids (Appendix III, Table 3a). However, imported fish such as striped catfish and tilapia, fish products popular with children such as fish balls and fish fingers, and also shrimp and crayfish, did not have high a content of n-3 fatty acids. Several factors can affect the fatty acid composition and thus the proportion of n-3 fatty acids, among other things, feedstuff and cooking is discussed (18). Compared with the other analysed fish, the fatty acid composition of the farmed tilapia and striped catfish was more similar to fish products containing vegetable fats, such as fish fingers (percentage fat), fish balls and tuna in sunflower oil, with less than 2.5 per cent 22:6 n-3 (DHA) and less than 0.8 per cent 20:5 n-3 (EPA), as well as more than 30 per cent of 18:1 (Figure 2). This could partly be explained by the feedstuff's composition, about which we unfortunately did not have any information. It may also partly involve biological explanations, where fish in tropical waters require a lower proportion of n-3 fatty acids in order to move when compared to fish in colder waters such as herring and cod species (18). Studies on how nutritional values are affected by cooking are complex and often give
inconsistent results. In a study by Larsen et al (19), neither the steaming, microwaving, baking nor frying of salmon affected the fatty acid composition significantly. Only the deep-frying of fish in oil affected the fatty acid
composition, as the concentration of long-chain n-3 fatty acids decreased when the fish was removed from the frying oil (sunflower oil) (19). In a study by Sioen et al (20), however, the levels of n-3 fatty acids decreased when frying both cod and salmon in olive oil.
The calculated content of n-3 fatty acids presented in this report are also affected by the general factors used in calculating fatty acid composition for the content of individual fatty acids. In the case of oily fish (> 5 g/100g, Appendix III, Table 1), the general factor of 0.9 is used, while lean fish (<5 g/100g, Appendix III, Table 1), has a factor of 0.7. Factors are used for correction purposes, as all substances that are soluble in the fat-soluble part/phase of the food are not fatty acids – for example, cholesterol is fat-soluble but not a fatty acid.
Vitamin D
Fish is an important source of vitamin D (21). Previous experiments have demonstrated that the vitamin D content does not correlate to either fat content, size, gender or age (22, 23). The governing factor for vitamin D content is most likely diet. For example, farmed fish require vitamin D supplements for growth and wild salmon contain significantly higher levels than farmed salmon (24). Just as humans, zooplanktons convert 7-dehydrocholesterol into vitamin D3 when
exposed to UV light (23). In this project, vitamin D content correlated to fat content (p <0.05), but lean fish also contained high levels of vitamin D, the highest content being found in the lean farmed fish tilapia, which contained 24 µg/100 g. This high content has previously been recorded in Canada, where levels between 18 and 75 µg/100 g have been reported for tilapia (25). Even the lower concentration of 18 µg/100 g is considered a high vitamin D content, when compared with vitamin D levels in other fish in this analysis project. The fact that tilapia contains as much vitamin D may depend on the feed (23-27), but there are also studies that have shown that tilapia can convert cholesterol (7-dehydroxy cholesterol) into vitamin D3 when exposed to light, just as we humans do (26).
The researchers, however, believed that this production is not relevant to wild fish that live near the surface and fish without major exposure to sunlight (26). It is possible that the use of small rearing boxes affects these conditions. We lack data regarding the vitamin D content of the analysed tilapia's diet. During sampling, we sampled fish from different plants in China, as they may use different feed
composition. Salmon feed contains between 2,000 and 4,000 IU/kg (50-100 µg/kg) of vitamin D. In studies with tilapia, feed has contained around 2,000 IU/kg (50 µg/kg). However, the requirement has been calculated at 375 IU/kg (9 µg/kg) feed (27).
In the case of both Baltic herring and other herring, the content of vitamin D was higher in the fattier autumn fish than in the spring fish. The Baltic herring
contained 7 and 9 µg/100 g which is significantly lower than previously reported (22, 23); 23 and 32 µg/100 g for fish caught in 1995, and 18 and 16 µg/100 g for fish caught in 1993. Baltic herring in the experiments (22, 23) were analysed using the same method by the same research group and were approximately twice as fatty (average fat content in 1993 was 8.8 g/100 g, and in 1995, 10.6 g/100 g) as the spring and autumn samples of Baltic herring analysed in this project (2.7 and 6.2 g/100 g). In a pilot study for this analysis project, sampling from even earlier in the spring of 2010 (February) found the fat content to be 4 g/100g.
Thank you
We greatly acknowledge those who contributed with their expertise within the area before and during the sampling for this project: Eva Brännäs and Sofia Trattner (SLU), Ingrid Undeland (Chalmers), Björn Åsgård (Swedish National Board of Fisheries), Ilona Miglavs (the trade association Swedish Fish), Maria Åberg (ABBA), Odd Lindahl (Musselakademin (the Mussel Academy)),
Catharina Eriksson (Paul Mattson) and Tatiana Cantillana and Marie Aune from the Dioxin Project at the National Food Agency. We are grateful to the personnel at the border control in Helsingborg and Gothenburg who helped with sampling.
References
1. Inköpsuppgifter fisk och skaldjur svenska hushåll aug 2008 – juli 2009 (Purchasing details for fish and shellfish for swedish households August
2008 to July 2009)(2009) Growth from knowledge).
2. Greenfield H och Southgate DAT (2003) Food Composition Data production, management and use. 2nd ed. FAO, INFOODS.
3. Torstensen B, Bell JG, Rosenlund G (2005) Tailoring of Atlantic Salmon (Salmo salar L.) Flesh Lipid Composition and Sensory Quality by
Replacing Fish Oil with a Vegetable Oil Blend. J Agric Food Chem 53:10166-78.
4. Usydus Z, Szlinder-Richert J, Polak-Juszczak L et al (2009) Fish products available in Polish market – Assessment of the nutritive value
and human exposure to dioxins and other contaminants. Chemosphere 74:1420-28.
5. Eschmayer W & Fricke R. (red). Catalog of Fishes version 2011-07-14. 6. FAO Fisheries and Aquaculture Department (2010) The state of world
fisheries and aquaculture.
7. Statens officiella utredningar (National official investigations) (2009:26) Det växande vattenbrukslandet (The growing ’aquafarmcountry’)
8. Fångststatistik yrkesfisket (Catch statistics professional fishing) (2010) (https://www.havochvatten.se/en) 2010-01-22
9. Swedish Agency for Marine and Water Management (https://www.havochvatten.se/en) 2011-01-16
10. Nedenskov-Jensen K, Jacobsen C och Hauch-Nielsen H (2007) Fatty acid composition of herring (Clupea harengus L.): influence of time and place of catch on n-3 PUFA content. J Sci Food Agric 87:710-18.
11. Livsmedelsverket (National Food Agency) (2011) Gränsvärden för långlivade miljöföroreningar i fisk från Östersjöområdet. Bilaga 1: Aune M och Cantillana T, Sammanställning av haltdata för dioxiner (PCDD/F), dioxinlika PCB och icke dioxinlika PCB för prover av fisk från
Östersjöområdet. (Limit levels for persistent environmental pollutants in
fish from the Baltic Sea. Appendix 1: Aune M and Cantillana T, summary of concentrations of dioxin (PCDD/F), like PCBs and non dioxin-like PCBs for samples of fish from the Baltic Sea)
12. Nordlander I, Persson M, Hallström H, Simonsson M, Livsmedelsverket and B Karlsson, SMHI (2011) Årsrapport 2009-2010 Kontrollprogrammet för tvåskaliga blötdjur. Annual report 2009-2010 Control of bivalves. Livsmedelsverkets rapportserie 14/2011.
13. EuroFIR (2011) eSearch prototype (http://esearch.eurofir.org/) [2011-07-06].
14. REGULATION (EC) No 1924/2006 OF THE EUROPEAN PARLIAMENT AND OF THE COUNCIL of 20 December 2006 on nutrition and health claims made on foods
15. Commission Regulation (EU) No 116/2010 of 9 February 2010 amending Regulation (EC) No 1924/2006 of the European Parliament and of the Council with regard to the list of nutrition claims
16. Commission Directive 2008/100/EC of 28 October 2008 amending Council Directive 90/496/EEC on nutrition labelling for foodstuffs as regards recommended daily allowances, energy conversion factors and definitions
17. Orban E, Nevigato T, Di Lena G et al (2008) New trends in the seafood market. Sutchi catfish (Pangasius hypothalmus) fillets from Vietnam: Nutritional quality and safety aspects. Food Chem 110:383-89.
18. Trattner Sofia (2009) Quality of lipids in fish fed vegetable oils - effects of bioactive compounds on fatty acid metabolism. SLU Doctoral thesis 2009:31.
19. Larsen D, Young Quek S och Eyres L (2010) Effect of cooking on the fatty acid profile of New Zealand King Salmon (Oncorhynchus
tshawytscha). Food Chem 119:785-90.
20. Sioen I, Haak L, Raes K et al (2006) Effects of pan-frying in margarine and olive oil on the fatty acid composition of cod and salmon. Food Chem 98:609-17.
21. National Food Agency (http://www.slv.se/en-gb/) [2011-01-16]. 22. Mattila P, Ronkainen R, Lehikoinen et al (1999) Effect of household
cooking on the vitamin D content in fish, eggs, and wild mushrooms. J Food Comp Anal 12:153-60.
23. Mattila P, Piironen V och Haapala R (1997) Possible factors responsible for the high variation in the cholecalciferol contents of fish. J Agric Food Chem 45:3891-96.
24. Bilodeau L, Dufresne G och Deeks J (2011) Determination of vitamin D3 and 25-hydroxyvitamin D3 in foodstuffs by HPLC UV-DAD and LC– MS/MS. J Food Comp Anal 24:441-48.
25. Chen TC, Chimeh F och Lu Z (2007) Factors that influence the cutaneous synthesis and dietary sources of vitamin D. Archieves of biochemistry and biophysics 460:213-17.
26. Lock EJ, Waagbo R, Bonga W et al (2010) The significance of vitamin D for fish: a review. Aquaculture nutrition 16:100-16.
27. Shiau SY och Wang JY (1993) Vitamin D requirements of juvenile hybrid tilapia Oreochromis niloticus x O. aureus. Nippon Susain Gakkai 59:553-58.
Appendices
Appendix I. Aggregate samples, distribution of constituent sub-samples and information on sub-samples
Appendix II. Analytical methods Appendix III. Nutritional values Table 1 Energy and macronutrients
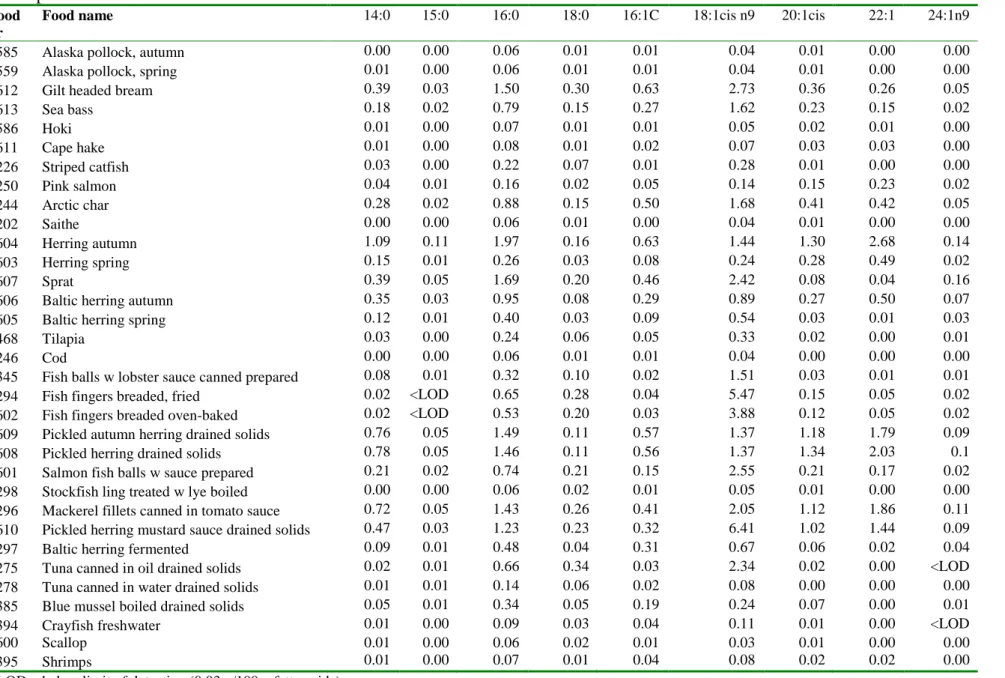
Table 2 Carbohydrates in fish products and shellfish Table 3a Summary of fatty acids and cholesterol Table 3b Saturated and monounsaturated fatty acids Table 3c Polyunsaturated fatty acids
Table 4a Fat-soluble vitamins: retinol equivalents, trans-retinol and carotenoids Table 4b Fat-soluble vitamins: Vitamin D, tocopherols (vitamin E) and vitamin K Table 5 Water-soluble vitamins
Table 6a Trace elements: P, Fe, Ca, K, Cu, Mg, Mn, Mo, Na, NaCl, Zn Table 6b Trace elements: I, Se, Co, Cr, Ni, Pb, Cd
Appendix I. Aggregate samples, distribution of constituent sub-samples and information on sub-samples
English name Proportion (%) or
number (pcs)
(sampling sessions)
Included fish
Samp-ling
Best before Date of
sample preparation
Fishing water/origin
Alaska Pollock fillet, spring
19 (4) B
20/08/11-27/11/11
101020 FAO 61
Alaska pollock fillet, autumn
21 (6) B/ S
24/06/10-02/03/12
101020 FAO 61/67
Blue mussels, boiled 1.8 kg (3) F
30/04/10-03/05/10
100505 FAO 27
Fish balls in lobster sauce
70 (5) Cod, haddock, saithe
and hake
S
09/11/12-20/01/13
100504 FAO 21/27
Fish fingers 23 % (1) Alaska pollock 65 % S 110831 100504 FAO 61/67
12% (1) Cod 61 % S 1109 100504 FAO 27
23% (1) Alaska pollock 61 % S 1109 100504 FAO 61/67
14% (1) Hoki, hake, ramsays
noting 65 %
S 110917 100504 FAO 41/81
28% (1) Saithe 61 % S 100913 100504 FAO 27
Gilt headed bream fillet 16 (3) F Fresh +2 days 101103 FAO 37
Sea bass fillet 13 (3) F Fresh +2 days 101103 FAO 37
Hoki fillet 24 (4) B/S 05/11-06/11 101028 FAO 81
Pickled herring in mustard sauce
7 batches Herring Abba
24/07/10-28/12/11
100511 FAO 27: III+IV;
FAO 27: IV
Pickled herring, drained 13 batches Herring Abba
02/05/10-22/12/11
100511 FAO 27: IV
Our finest pickled herring with onions
16 batches Herring Abba
18/07/10-03/08/10
Appendix I. Aggregate samples, distribution of constituent sub-samples and information on sub-samples
English name Proportion (%) or
number (pcs)
(sampling sessions)
Sampling Best before Date of
sample preparation Fishing water/origin Crayfish - 24-30 pcs/kg 296 (9) S 120329 101028 Turkey - 24-30 pcs/kg, wild-caught S 110928 101028 Spain - 16-22 pcs/kg S 110604 101028 China
- 20-30 pcs/kg, signal crayfish S 110722 101028 Småland
- 17-22 pcs/kg S 1205 101028 Spain
- 29 pcs/kg, wild-caught S 120515 101028 China
- 16-20 pcs/kg + crayfish tails 26-36 pcs S 120524 101028 China
- crayfish tails S 110930 101028 China
Salmon fish balls in west coast sauce 80 pcs (5) S 121015 100504 FAO 27
Stockfish (long) 3 batches (3) S 11/02/11-25/02/11 101110 FAO 27
Mackerel fillets canned in tomato sauce
- mackerel 60 % 1 (1) S 130704 101028 FAO 27/SE
- mackerel 64 % 1 (1) S 130702 101028 FAO 27/DE
- mackerel 64 % 1 (1) S 130511 101028 FAO 27/DK
- mackerel 64 % 1 (1) S 130813 101028 FAO 27/DE
- mackerel 70 % 1 (1) S 130510 101028 FAO 27/SE
- mackerel 64 % 1 (1) S 130906 101028 FAO 27/DE
- mackerel 60 % 1 (1) S 130422 101028 FAO 27/SE
Striped catfish fillet 16 (12) B/S 12/12/11-31/07/12 101020 Vietnam
Scallops 1.8 kg (3) S 101209 100505 FAO 21 (USA)
Appendix I. Aggregate samples, distribution of constituent sub-samples and information on sub-samples
English name Proportion (%) or
number (pcs)
(sampling sessions)
Sampling Best before Date of
sample preparation
Fishing water/origin (distribution in per cent)
Herring fillet, spring 60 (4) Wholesaler Fresh + 1 day 100511 FAO 27:IIIa (Kattegatt)
Herring fillet autumn 36 (4) Wholesaler Fresh + 1 day 101020 FAO 27:IIIa
Sprat 188 (4) The Dioxin
Project (11)
Fresh + 1 day 100511 Bornholmshavet (Bornholm Sea) (39 %), Gdanskbukten (Gulf of Gdańsk) (20 %), Västra Gotlandshavet
(Western Gotland Sea) (32 %), Östra Gotlandshavet (Eastern Gotland Sea) (9 %)
Baltic herring, spring 66 (4) The Dioxin
Project (11)
Fresh + 1 day 100511 Bornholmshavet (Bornholm Sea) (54 %), Gdanskbukten (Gulf of Gdańsk) (14 %), Västra Gotlandshavet
(Western Gotland Sea) (19 %), Östra Gotlandshavet (Eastern Gotland Sea) (13 %)
Baltic herring fillet, autumn
65 (3) F Fresh + 1 day 101103 Baltic Sea 25-29
Fermented Baltic herring 86 (6) S 1112 101021 Baltic Sea Tilapia fillet 12 (4) B/S 06/05/11-01/03/12 101020 China
Tuna, oil 11 batches (6) S
03/04/12-31/12/14
100504 Thailand (90 %), FAO 87 (10 %)
Tuna, water 11 batches (6) S
16/04/12-27/11/12
100504 Thailand (90 %), FAO 87 (10 %)
Cod fillet 14 (7) F Fresh + 1 day 100505 27.1.1
Appendix II. Analytical methods
Water
Samples are dried in a heating cabinet at 102 °C ± 3 °C to constant weight. Water is determined gravimetrically as the sample's weight loss. Accredited method (SWEDAC). Ash
Samples are burned up in an oven at 650 °C ± 25 °C to constant weight. Ash is defined as the gravimetric residue when water and organic material have been burned up. Accredited method (SWEDAC).
Protein
Nitrogen is determined in accordance with Kjeldahl. NMKL nr. 6, 3 Ed. 1976. The sample is subjected to wet digestion in sulphuric acid and organic nitrogen is converted to ammonium ions. Sodium hydroxide is added and the ammonia formed is titrated with hydrochloric acid. Protein is calculated from the nitrogen using a conversion factor. Accredited method
(SWEDAC). Fat
Fat is analysed as raw fat using the EC method B, Commission Directive 98/64/EC. Fat content of pink salmon is analysed using SBR: NMKL No. 131, 1989.
Both standard methods are based on the fat being liberated by hydrolysis and extracted with solvent. The solvent is distilled and the residue weighed to constant weight. Fat is defined as the gravimetrical weight increase. Accredited methods (SWEDAC).
Fatty acid composition
Fatty acids are determined by gas chromatography using a modified IUPAC method (IUPAC 6th Ed, Part 1, 2301 and 2302, 1979). Fatty acid methyl esters are produced from triglycerides by alkaline catalyzed transmethylation. The percentage distribution of a mixture of fatty acid methyl esters is determined by gas chromatography. Accredited method (SWEDAC).
Cholesterol
Cholesterol is determined by gas chromatography using an in-house validated method. The sample is hydrolysed with saturated potassium hydroxide in methanol and cholesterol is extracted with cyclohexane. Quantification is performed based on the calibration curve with 5-β-cholestane-3-ol as an internal standard. Cholesterol is determined directly without derivatisation by gas chromatography on a flame ionisation detector. Accredited method (SWEDAC).
Starch
Starch is determined enzymatically with a modified method of NMKL No. 145 2 Ed., 1997. The starch is hydrolysed in the oven for 30 minutes with Termamyl ® at pH 5.0 and at a temperature of 90°C. The starch is then determined enzymatically using a commercial test (Boehringer Mannheim / R-Biopharm Cat. No. 10 207 748 035). The amount of NADPH formed is measured photometrically and is proportional to the amount of starch. The method was not accredited for fish products at the time of analysis. Validation was performed during the project and accreditation for fish products was obtained retrospectively.
Appendix II. Analytical methods
Sugars
Monosaccharides and disaccharides are determined by gas chromatography using an in-house validated method. (Swedish J. Agric. Res. 4:49-52, 1974). Carbohydrates are converted to trimethylsilyl (TMS-ethers) after extraction with 80 per cent ethanol and analysed on a gas chromatograph with a flame ionisation detector. Carbohydrates are quantitatively determined by the calibration curve with phenyl--D-glucoside as an internal standard. The method was not accredited for fish products at the time of analysis. Validation was performed during the project and accreditation for fish products was obtained retrospectively.
Metals
Sodium, potassium, calcium, magnesium, phosphorus and molybdenum are determined by ICP-AES (Inductively Coupled Plasma-Atomic Emission Spectrometry) after wet digestion. The in-house method is accredited for calcium, magnesium and molybdenum in food and for sodium, potassium and phosphorus in feed (SWEDAC).
Other metals are determined by ICP-MS (Inductively Coupled Plasma-Mass Spectrometry) after microwave digestion in nitric and hydrochloric acid at 190°C and dilution with water. The method, which is based on EN 15763:2009, was not accredited for food at the time of analysis. Validation was performed during the project and accreditation was obtained retrospectively.
Selenium
Selenium was determined by hydrid-ICP-AES after wet digestion. Accredited method (SWEDAC).
Iodine
Iodine was determined spectrophotometrically according to Gig. Sanit. 1971, 36(4), 67-69. Accredited method (SWEDAC).
Thiamine and riboflavin
Method for analysis of thiamine content (vitamin B1) and riboflavin (vitamin B2) in enriched and non-enriched foods. The detection limit is 0.005 mg/100 g for vitamin B1 and 0.026 mg/100 g for vitamin B2. The common sample treatment begins with an acidic and an enzymatic hydrolysis. Riboflavin is then determined and quantified by isocratic chromate-graphic separation on a C18-column and fluorescence detection. Thiamine is oxidised in a highly alkaline solution to thiochrome, which fluoresces under ultraviolet light. Potassium hexacyanoferrate is used as an oxidising agent. The derivatisation takes place automatically prior to the injection time by using a liquid handling robot (Gilson ASPEC). Thiamine (thiochrome) is then determined and quantified by isocratic chromatographic separation on a C18-column and fluorescence detection. EN 14122 and EN 14152. Accredited methods (SWEDAC).
Folate
Method for analysis of the total folate concentration in enriched and non-enriched foods. The determination is performed using microbiological assay and turbidimetric detection of the growth of Lactobacillus casei, subsp. Rahmnosus (L. rahmnosus, Culture Collection of the University of Gothen¬burg, CCUG 21452, equivalent to L. casei American Type Culture Collection, ATCC 7469). The detection limit is 3.3 μg/100 g. Homogenised samples are
Appendix II. Analytical methods
polyglutamate forms of vitamins for growth, an enzymatic deconjugation is also required prior to analysis. The sample extract is diluted with a basal medium containing all necessary growth factors other than folate. Following the addition of L. casei, the samples are incubated at +37 ºC for 22 hours, after which growth is measured turbidimetrically. By comparing the growth in the sample extract with that of the calibration solution, the vitamin content can be determined. EN14131. AACC 86-47. Accredited method (SWEDAC).
Niacin
Method for analysis of the total niacin content in food, both in enriched products and naturally occurring nicotinic acid and nicotinamide. The determination is performed using
micro-biological assay and turbidimetric detection of the growth of Lactobacillus plantarum (L. plantarum) (ATCC 8014). The detectio¬n limit is 0.03 mg/100 g (weighed sample amount is 5 g). Homogenised samples are suspended in sulphuric acid and autoclaved to facilitate extraction from the sample matrix. The sample extract is diluted with a basal medium containing all necessary growth factor¬s other than niacin. Following the addition of L. plantarum, the samples are incubated at +37 ºC for 22 hours, after which growth is measured turbidi¬metrically. By comparing the growth in the sample extract with that of the calibration solution, the vitamin content can be determined. Accredited method (SWEDAC).
Vitamin B6
Method for analysis of vitamin B6 in foods of animal and vegetable origin. Vitamin B6 is specified as pyridoxine hydrochloride. The detection limit is 0.009 mg pyridoxine
hydrochloride/100 g if the weighed amount is 5 g. Samples are hydrolysed with 0.1 M HCl while heated. If the samples contain phosphate esters of pyridoxine, pyridoxal or pyridox-amine, the samples are then treated with acid phosphatase. The vegetable samples can be conjugated as pyridoxine glucoside. Therefore, a portion of the vegetable sample extract is also treated with beta-glucosidase to determine the total concentration of the vitamin. B6 vitamins pyridoxine, pyridoxal and pyridoxamine are determined and quantified by isocratic chromatographic separation on a C18-column and fluorescence detection. The sum of the vitamins is reported as vitamin B6. Accredited method (SWEDAC).
Vitamin B12
Method for analysis of total cyanocobalamin, vitamin B12 in foods, both in enriched products and naturally occurring. The determination is performed using microbiological assay and turbidimetric detection of the growth of Lactobacillus leichmanni (American Type Culture Collection, ATCC, 7830). The detection limit is 0.04 μg/100g. Homogenised samples are suspended in acetate buffer and for transformation to cyanocobalamin, which is more stable, a cyanide solution is added. Samples are then autoclaved to facilitate extraction from the
sample matrix. The sample extract is diluted with a basal medium containing all necessary growth factors other than folate. Following the addition of L. leichmanni, the samples are incubated at +37 ºC for 22 hours, after which growth is measured turbidimetrically. By comparing the growth in the sample extract with that of the calibration solution, the vitamin content can be determined. Accredited method (SWEDAC).
Trans-retinol
Appendix II. Analytical methods
is based on a comparison with an external standard. Correction of the concentration is performed for a recovery of 90.5 per cent. The detection limit is 1 µg/100 g. Accredited method (SWEDAC).
Vitamin D3
Following the addition of an internal standard (vitamin D2) and alkaline hydrolysis, vitamin
D3 is extracted with n-heptane. The fraction containing vitamin D2/D3 is separated by
preparative straight phase liquid chromatography (Silica). After evaporation and dissolution in acetonitrile/methanol, vitamin D3 is determined quantitatively using reversed phase liquid
chromatography (C-18). Detection is achieved using UV at 265 nm. The quantitative evalu-ation is based on a comparison with the internal standard. The detection limit is 0.1 µg/100 g. Accredited method (SWEDAC).
Tocopherols (vitamin E)
The sample is hydrolysed in an alkaline environment, wherein tocopherol esters are converted into tocopherols. Hydrolysates with low fat content are then extracted with n-hexane on a Kiselguhr-based column (Chem Elut). Extraction in a separatory funnel is used instead for samples with high fat content. Following isocratic liquid chromatographic separation on an amino column, tocopherols are detected with a fluorescence detector. The quantitative evalu-ation is based on a comparison with an external standard. Correction of the alpha-tocopherol content is made for a recovery of 90 per cent, while the levels of beta-, gamma- and delta-tocopherol are corrected for recoveries of 93 per cent, 91 per cent and 85 per cent. The de-tection limit is 0.006 mg/100 g for alpha-, beta- and gamma-tocopherol, and
0.008 mg/100 g for delta-tocopherol. Accredited method (SWEDAC). Vitamin K
An internal standard (menaquinone-8) is added to the sample and mixed with 70 per cent ethanol after which the fat-soluble components are extracted in heptane during reflux. The sample is evaporated and analysed using reversed phase liquid chromatography (C-18) with a fluorescence detector. Vitamin K is reduced in a reduction column filled with zinc powder, which means that the vitamin may be detected fluorimetrically. The quantitative evaluation is based on comparison with an external standard, but correction is made for the recovery of the internal standard. The detection limit is 0.3 µg/100 g for both vitamin K1 and K2.
Carotenoids
The analyses for alpha- and beta-carotene, beta-cryptoxanthin, lutein and zeaxanthin have been performed with an extraction method which includes alkaline hydrolysis. The sample is first dissolved in ethanol and then hydrolysed using potassium hydroxide. It is then
neutralised and extracted with tetrahydrofuran and cyclohexane. Using this method, you get both free carotenoids and carotenoids in ester form as the result. Trans-lycopene has instead been analysed with a direct extraction method without hydrolysis, where the sample is first extracted with ethanol and then with dichloromethane. In both methods, the sample is
evaporated to a small volume after extraction, dissolved in dichloromethane and methanol and then analysed by reversed phase liquid chromatography (C-30) with a diode-array detector. When employing hydrolysis, carotenoids break down to some extent and therefore a recovery correction has been made for a recovery of 87 % for all carotenoids analysed by hydrolysis. No recovery correction was made for trans-lycopene. The detection limit is 2 µg/100 g for all