The Effect of the Fluoroethylene Carbonate Additive in
LiNi
0.5Mn
1.5O
4- Li
4Ti
5O
12Lithium-Ion Cells
Burak Aktekin,aReza Younesi,a,∗,zWolfgang Zipprich,bCarl Tengstedt,cDaniel Brandell,a
and Kristina Edstr¨oma
aDepartment of Chemistry – Ångstr¨om Laboratory, Uppsala University, SE-75121 Uppsala, Sweden bVolkswagen AG, D-38436 Wolfsburg, Germany
cScania CV AB, SE-151 87 S¨odert¨alje, Sweden
The effect of the electrolyte additive fluoroethylene carbonate (FEC) for Li-ion batteries has been widely discussed in literature in recent years. Here, the additive is studied for the high-voltage cathode LiNi0.5Mn1.5O4(LNMO) coupled to Li4Ti5O12(LTO) to
specifically study its effect on the cathode side. Electrochemical performance of full cells prepared by using a standard electrolyte (LP40) with different concentrations of FEC (0, 1 and 5 wt%) were compared and the surface of cycled positive electrodes were analyzed by X-ray photoelectron spectroscopy (XPS) and scanning electron microscopy (SEM). The results show that addition of FEC is generally of limited use for this battery system. Addition of 5 wt% FEC results in relatively poor cycling performance, while the cells with 1 wt% FEC showed similar behavior compared to reference cells prepared without FEC. SEM and XPS analysis did not indicate the formation of thick surface layers on the LNMO cathode, however, an increase in layer thickness with increased FEC content in the electrolyte could be observed. XPS analysis on LTO electrodes showed that the electrode interactions between positive and negative electrodes occurred as Mn and Ni were detected on the surface of LTO already after 1 cycle.
© The Author(s) 2017. Published by ECS. This is an open access article distributed under the terms of the Creative Commons Attribution 4.0 License (CC BY,http://creativecommons.org/licenses/by/4.0/), which permits unrestricted reuse of the work in any medium, provided the original work is properly cited. [DOI:10.1149/2.0231706jes] All rights reserved.
Manuscript submitted November 17, 2016; revised manuscript received February 21, 2017. Published March 8, 2017.
The spinel material LiNi0.5Mn1.5O4(LNMO) is an attractive
pos-itive electrode for Li-ion batteries (LiBs) due to its high operating voltage around 4.7 V (vs. Li/Li+) arising from the Ni2+/Ni4+redox couple. It possesses a theoretical capacity of 147 mAh/g, of which a small portion can be provided by a second plateau around 4.1 V (vs. Li/Li+) corresponding to Mn3+/Mn4+oxidation depending on the
syn-thesis conditions.1In addition to the high voltage plateau, the intrinsic
structure of the spinel phase allows fast lithiation and de-lithiation kinetics2,3which is attributed to the 3-D lithium transport among the
available tunnels in the crystal.4 The advantage of higher voltage
(thus higher energy density) and good power capability are two main reasons behind the growing interest for this material, especially for electric vehicle applications. However, the electrode material is prone to side reactions with conventional electrolytes, not least electrolyte decomposition at high voltages and transition metal dissolution from the spinel structure, particularly observed at elevated temperatures. These obstacles need to be resolved before wide-scale commercial application of LNMO electrodes.5,6 One possible approach to
over-come these problems is to use electrolyte additives that could ideally form an in-situ passivating layer on the positive electrode surface, sim-ilarly to the solid electrolyte interphase (SEI) observed on negative LiB electrodes.7,8
A number of electrolyte additives have been reported in recent years for the purpose of passivating the cathode/electrolyte interface at high operating voltages.7Some of these additives include LiBOB,9
succinic anhydride,10HFiP11and DMMP.12It is important to note that
the use of such cathode interface additives should also be compati-ble with the anode interface in full cells, or vice versa for additives intended for the anode side. Therefore, it is essential to study the effect of anode additives on the cathode side as well, if new full-cell chemistries are to be realized. Fluoroethylene carbonate (FEC) and vinylene carbonate (VC) are common examples of such additives where the former has been used mostly to improve anode perfor-mance for silicon electrodes13,14and the latter for lithium-metal15and
graphite16electrodes. For LNMO, it has been reported that the VC
ad-ditive would continuously decompose on the cathode and result in fast capacity decay, indicating that this additive is not compatible with the high voltage cathode.17For the use of FEC on high voltage cathodes,
there have been a small number of studies reported; either suggesting
∗Electrochemical Society Member. zE-mail:reza.younesi@kemi.uu.se
FEC as a co-solvent to replace ethylene carbonate (EC)18or simply as
an electrolyte additive in small amounts.19The latter approach might
be more desired due to practical and economical reasons.
The oxidation potential of FEC has been predicted by density functional theory (DFT) calculations to be 7.24 V, which is higher than 6.95 V for the EC analogous compound.20In practical cells, electrolyte
oxidation would be anticipated to start at lower potentials due to nucleophilic attacks of the cathode surface oxygen atoms, and it is also likely that the reactivity toward electrolyte will be affected by the interfacial properties and the energetics of the surfaces,21,22but it can
still be assumed that the fluorinated carbonates could provide higher anodic stability compared to their non-fluorinated counterparts. In this respect, preferential oxidation of FEC before EC may not be expected to happen, and FEC may therefore not be considered as an oxidative additive. Nevertheless, additions of small amounts can modify the chemistry of the cathode surface, if it is considered that the anodic potentials are not very different and that the heterogeneous/complex structure of the composite electrodes (presence of catalytic spots, kinetic limitations and localized polarization areas) are taken into account. FEC might thus react on the LNMO surface, which in turn can affect electrode stabilization and battery ageing.
In the literature on the FEC additive, the focus has usually been on the overall cell performance or on the anode interface,7 while fewer
papers discuss the cathode interface. For a lower operation voltage (around 4.1 V vs. Li/Li+for LMO electrodes), Ryou et al. reported that 2 wt% FEC additive would increase the capacity retention for LMO/graphite cells. A thin and stable SEI layer formed on the graphite anode was explained as the origin of this improvement and XPS analysis indicated no significant contribution from FEC on the cathode surface.23 In another study, Li et al. studied the effect of FEC for
lithium-rich layered oxide Li1.16[Mn0.75Ni0.25]0.84O2(half cells). They
used 1 vol% or 2 vol% FEC and both cycling performance and rate capability were improved. However, addition of excess FEC (5% in volume) decreased the lithium transference number and resulted in large concentration polarization.24
For higher cathode voltages, Markevich et al. have used FEC/DMC (1:4) solvents for LiCoPO4/Li, LiCoPO4/Si, LNMO/Li and LNMO/Si
cells. They reported the formation of a stable interface layer on LiCoPO4 when FEC was used instead of EC. There was, however,
no surface characterization study performed for LNMO and no differ-ence in cycling performance was reported for LNMO half cells, but the capacity retention was higher in full cells (Si anode) which was attributed to a better surface passivation of the cathode in the case of
Journal of The Electrochemical Society, 164 (4) A942-A948 (2017) A943
FEC-containing electrolytes.18When the self-discharge behavior was
tested by Tarnopolskiy et al., no effect of 4 wt% FEC was observed for LNMO electrodes in half-cells.10In another study, Hu et al. used
FEC based electrolyte for the LNMO/graphite couple. The formu-lation included 1 M LiPF6 in FEC/F-EMC/F-EPE at 3/5/2 volume
ratio, and less amount of decomposition products on both anode and cathode were reported as compared to conventional electrolyte.25It is
therefore seen that the effect of FEC on high voltage cathodes is yet unclear and to the best of our knowledge, there exists at present no dedicated study aiming at observing the effect of the FEC additive on the LNMO|electrolyte interface.
With this current study, we therefore aim to understand the sur-face modifications occurring specifically on the LNMO sursur-face when small amounts of FEC are used as additive in conventional elec-trolytes (i.e. LP40). Studying electrolyte additives in half cells may cause problems, since such additives can also undergo side reactions occurring on the lithium metal surface. Also, the loss of lithium due to electrolyte decomposition might be compensated due to the overca-pacity on the anode side, making the evaluation of performance more difficult. In full cells, on the other hand, the interactions between elec-trodes and electrolyte as well as the interaction between anode and cathode may also render the interpretation more complex. For these reasons, LNMO electrodes are here coupled with LTO rather than graphite (or lithium metal, or silicon) since this anode is well known for its chemical and electrochemical stability (high operating voltage and almost zero volume change during reaction).26The differences
in electrochemical behavior can then more easily be attributed to the modifications on the positive electrode. Even though LTO electrodes generate some electrolyte reduction,27,28this cell chemistry can still
be considered a good base system to study the effect of electrolyte additives on the cathode side.29
Experimental
Electrochemical cell preparation.—Electrode compositions
in-cluded 90 wt% commercial LNMO powders without surface coating mixed with 5 wt% carbon black (Super C65) and 5 wt% polyvinyli-dene fluoride binder (PVdF-HFP; Kynar Flex 2801). PVdF-HFP was dissolved in N-methyl-2-pyrrolidone (NMP) using a 4:96 wt% ratio. After 2 hours of ballmilling, the resulting slurry was casted on 20μm thick aluminum foils. Approximately 2.2 cm wide and 1 meter long electrode stripes were calendared (rolled under pressure) very slowly (one pass) in order to obtain more homogeneous electrodes with sim-ilar porosity. The resulting electrode thickness was measured as 52 μm (excluding aluminum foil) corresponding to a porosity of ap-proximately 42%. Average active mass loading was 10.6 mg (or 1.56 mAh) per cm2. As the counter electrode, commercial LTO electrodes
(Leclanch´e) were used and its capacity was estimated as 10% excess (1.7 mAh per cm2) as compared to LNMO. Circular electrodes with
a 2 cm diameter were punched from both electrodes and then dried under vacuum at 100◦C for 10 hours. One layer of Celgard 2500 pre-dried at 70◦C for 10 hours was used as separator. The standard electrolyte used in the cells was LP40 (1 M LiPF6dissolved in EC
and DEC with 1:1 volume ratio). In addition to standard electrolyte, two other electrolytes were prepared by adding fluorinated ethylene carbonate (FEC, Sigma-Aldrich) to the LP40 so that the overall FEC concentration was either 1 or 5 wt% in the electrolyte. Before cell assembly, P-shaped current collectors were cut in a way that the tips were circular and had 2 cm diameters in order to ensure homogeneous pressure distribution after applying pressure on the electrodes. Alu-minium collectors were used for LNMO and copper collectors were used for LTO electrodes. The cells were vacuum sealed into ‘coffee bags’ after injecting 80μl of electrolyte in a glove box with H2O
< 5 ppm and O2< 1 ppm. A second sealing was also made for gasses
evolving during cycling.
Electrochemical characterization.—Pouch cells were placed
be-tween flat plates and these plates were compacted using four steel binder clips. The cells were galvanostatically cycled between 1.5 V
and 3.5 V (vs. LTO) at different rates and temperatures. In all mea-surements, the cells were kept under OCV condition for 10 hours prior to cycling. The first experimental set was tested at C/5 rate without formation cycles using a Novonix HPC (High Precision Charger) at 30◦C. In the second set, cells were cycled at 30◦C for 500 cycles with 1 C rate (approx. 5 mA, but the first three cycles at C/5). In comple-mentary tests, cells were first cycled at C/5 rate at room temperature using Digatron BTS-600 and then removed to 55◦C furnace (Novonix HCP) for another 100 cycles. In rate capability test, Digatron BTS-600 was used and cells were cycled at room temperature. The charge rate was kept the same as the discharge rate until 1C cycling, while for 2C and 5C cycling it was limited to 1C rate.
Surface analysis.—Surface analyses were performed on both
LNMO and LTO electrodes before and after cycling (after 1 cycle and 100 cycles). These cells were cycled at 30◦C with C/5 rate using a Novonix HCP charger for all 0, 1, 5 wt% FEC added electrolytes. Surface morphologies were observed using a Zeiss Sigma Series (ex-cept for the pristine electrode which was observed via Zeiss 1550) scanning electron microscope (SEM) equipped with field emission gun. Cycled cells were opened in a glove box and electrodes were rinsed with DMC three times (approximately 0.5 ml DMC was used each time) in order to remove electrolyte residues. Each electrode was held using metallic tweezers while DMC droplets were added from a pipette to the surface of the electrode. DMC was in contact with the electrode for approximately 15–30 seconds in each rinsing step. Cleaned electrodes were placed on carbon tapes attached to aluminum sample stubs. Samples were put into an air-tight SEM transfer shuttle that allowed us to observe the electrode surface without any air expo-sure. During SEM analysis, the accelerating voltage was kept at 3 kV while the working distance was adjusted to 5 mm for fresh samples and to 7 mm for cycled electrodes. Scaling of SEM images was made via the ImageJ software. For the surface sensitive chemical analysis, X-ray photoelectron spectroscopy (XPS) was performed on both elec-trodes. Sample preparation was made as described for SEM samples, and the samples were similarly inserted into the XPS instrument using an air-tight transfer system. A XPS (Phi-5500) with monochromatized Al-Kα radiation (1486.6 eV) was used for this purpose. Calibration of the spectra was made by linear shifting of the hydrocarbon peak to 285 eV. Data are drawn as measured without any intensity normaliza-tion. Casa XPS software was used for the analysis.
Results and Discussion
Electrochemical behavior.—The charge-discharge capacities and
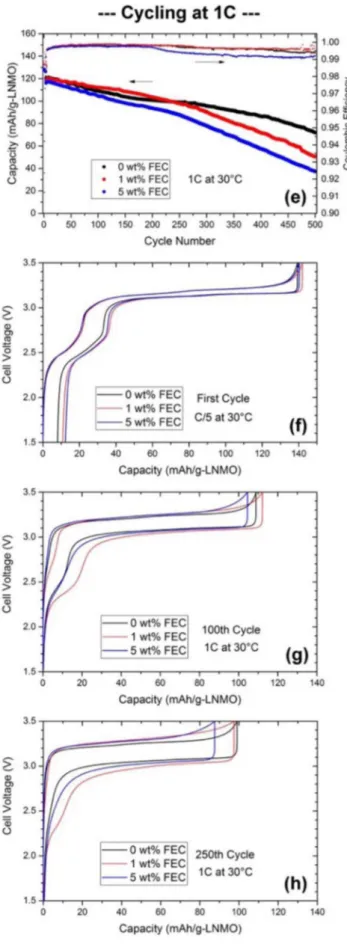
the coulombic efficiencies of the LTO-LNMO full cells prepared with 0, 1 and 5 wt% FEC additive and cycled at 30◦C with C/5 and 1C are depicted in Figures1aand1e(Novonix HPC). For 1C cycling rate, the first three cycles were run at C/5 rate while the rest of the cycling was continued at 1C rate. For both current rates, the capacity fades noticeably in the cells with high FEC content, 5 wt%. The cells with 0 and 1 wt% FEC perform quite similar over 100 cycles at C/5 rate and also over about 300 cycles at 1C rate, however, the cell with 1 wt% fades faster afterwards up to 500 cycles at 1C rate. The coulombic efficiencies start to stabilize and reach a value above 0.99 after ten initial cycles, however, the 5 wt% FEC sample showed a lower efficiency at the beginning. Therefore, considering both the capacity fading and the efficiency trends in the initial cycles, it can be concluded that the FEC containing electrolyte are not beneficial in this cell chemistry and most likely generate more side reactions especially during the initial cycles. Transition metal dissolution, migration of side reaction products from cathode to the anode, lithium inventory loss in the full cell or resistance increase on electrodes are possible reasons for the capacity fading.
From the voltage curves of the first cycle and 100thcycle at C/5
rate shown in Figures 1b and 1c, respectively, it can be seen that all cells behave very similar until the end of charging where the 5 wt% FEC added cell requires more charge before reaching the cut off voltage. During the discharge, capacity retention is lowest for
Figure 1. Galvanostatic cycling results at C/5 rate (a) for LNMO-LTO full cells (30◦C) with 0, 1 and 5 wt% FEC added LP40 electrolyte (hollow symbols refer to the charge capacities while filled symbols refer to discharge capacities). Coulombic efficiencies are shown with small-sized symbols (right axis). Voltage curves for C/5 testing for the first cycle and 100thcycle are shown in (b) and (c), respectively. The cycling data for the 100thcycle (C/5) is also given as the change of
dQ/dV with respect to V in (d). Similarly, the cycling curve for 1C testing is given in (e) and voltage curves from this set is given in (f) for the first cycle, (g) for the 100thcycle and (h) for the 250thcycle.
Journal of The Electrochemical Society, 164 (4) A942-A948 (2017) A945
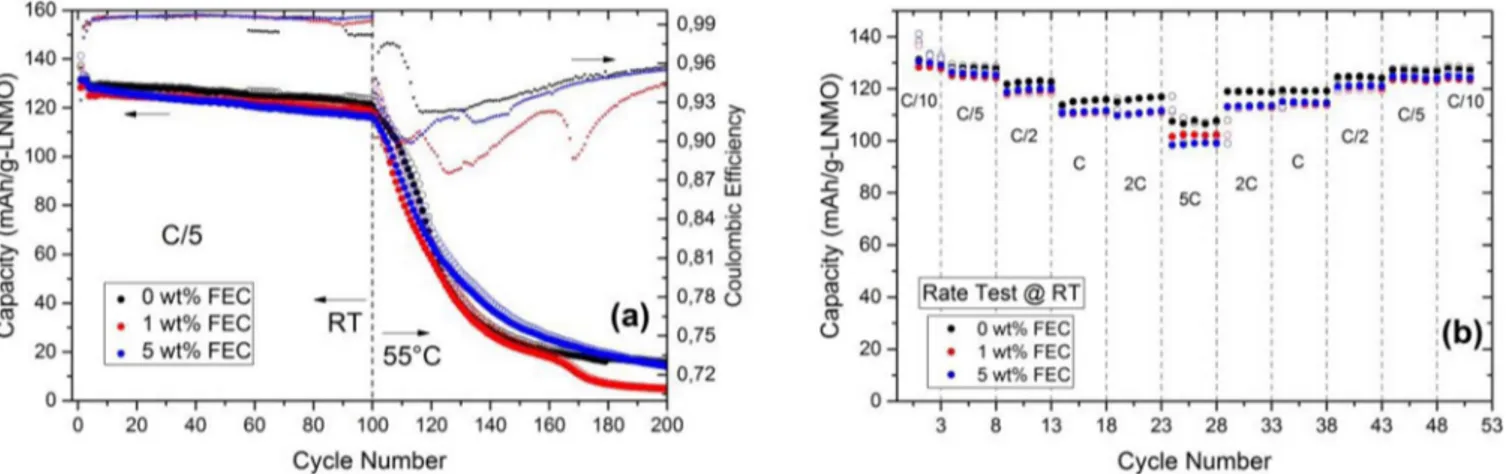
Figure 2. Galvanostatic cycling of 0, 1 and 5 wt% FEC added cells at room temperature and 55◦C (a) and power capability test at room temperature (b).
this cell showing that the extra capacity was not due to mismatch of electrodes or inaccurate active mass estimation per electrode. The voltage curves of the 100th cycle reveal that loss of lithium in the
cathode is responsible for the higher capacity fade in the 5 wt% FEC added cell. In order to make this clear, the change of dQ/dV with respect to the cell voltage (100thcycle) is shown in Figure1d. It is
seen that there is no difference in voltage polarization and charge capacities for the two peaks corresponding to the Ni2+/Ni4+ redox
couple while the peak corresponding to the Mn3+/Mn4+redox couple
is missing for the 5 wt% FEC added cell. This indicates that there are still available structural places for the Li atoms in the cathode and that the capacity difference is not due to electrode degradation.
As expected, voltage difference between charging and discharging is larger during 1C rate cycling compared to C/5 rate as seen in Figures
1g,1h. This difference is observed to be larger for the cells with FEC in the electrolyte. During the 250thcycle, the 1 wt% FEC sample shows
slightly more polarization compared to the 5 wt% sample while the capacity of the 1 wt% FEC cell remains higher (∼11 mAh/g). The voltage curve of the 1 wt% sample also shows some Mn3+/Mn4+
redox activity while this cannot be observed for the 0 wt% FEC cell even though it has smaller voltage polarization. It might be possible that the negative effect of kinetic limitations during the initial stage of cycling is compensated by better retention of the cyclable lithium reservoir in the LNMO electrodes.
As complementary tests, two different cycling experiments were conducted. In the first test, another cycling equipment (Digatron BTS-600) was used to cycle 0, 1 and 5 wt% FEC including cells at C/5 rate and at room temperature (varied between 20–25◦C) for 100 cycles. These cells were cycled further at 55◦C for another 100 cycles using Novonix HPC (High Precision Charger) in order to see that if the addition of FEC has any positive effect on the elevated temperature behavior. In the second experiment, the effect of different currents (C-rate) has been tested on cells with 0, 1 and 5 wt% FEC (Digatron BTS-600, room temperature). Results of these tests are shown in Figure2aand Figure2b, respectively. In both tests, the first cycle coulombic efficiency is highest for 0 wt% FEC cell and lowest for 5 wt% FEC cell. The first cycle charge capacity of the 1 wt% FEC cell is slightly lower than for the 5 wt% cell, indicating there might exist a minor electrode weight measurement error or a small electrode mismatch during battery assembly, however, both experimental sets clearly show that there is no beneficial effect of FEC additive at elevated temperature as well as at high discharge rates.
Surface characterization of LNMO electrodes.—The LNMO
cathodes were, after cycling at C/5 rate, treated in the glove box where they were washed with DMC to remove electrolyte residues and transferred to SEM and XPS instruments with air-tight trans-fer tools. Figure3shows SEM micrographs of the pristine LNMO electrode (2a) and electrodes after 1 cycle (3b-3d) as well as after
100 cycles (3e-3g). The SEM images were collected at a relatively low acceleration voltage (3 kV) to obtain good surface sensitivity.
It is seen that electrode morphology does not change significantly after cycling. Slightly more textured active material surface seems to be present after 1 cycle compared to the uncycled electrode; however, it is hard to see any difference between Figures3b,3cand3d. Samples cycled 100 times (Figures 3e–3g) generally have slightly rougher surfaces compared to uncycled material. Even though it is difficult to be very conclusive from these comparisons – especially between the 0 wt% and 1 wt% FEC added cells – it is possible to say that the 5 wt% FEC added cell had a more textured surface. These SEM micrographs show us that the morphology of the electrodes did not change considerably even after 100 cycles at C/5 rate cycling, and that the surface layer formed on the cathode was not thick in any of the three electrolytes. XPS studies were carried out to obtain further information of thickness and its chemical composition of surface layers.
XPS analysis results of LNMO electrodes after 1stand 100thcycles
are presented in Figure4and Figure S1 together with the spectrum of a pristine electrode which has not been in contact with electrolyte.
Figure 3. SEM micrographs of pristine LNMO electrode (a); electrodes after 1 cycle for 0 wt% (b), 1 wt% (c) and 5 wt% FEC (d) added cells; electrodes after 100 cycles for 0 wt% (e), 1 wt% (f) and 5 wt% FEC added cells (g).
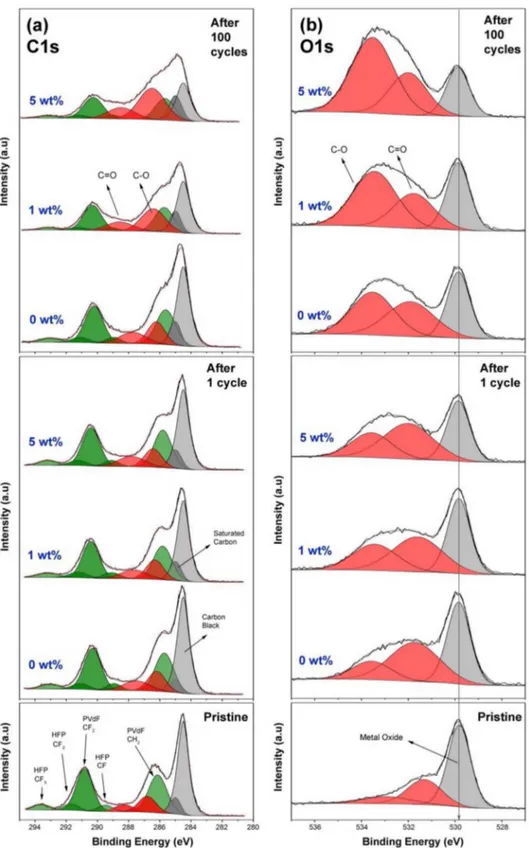
Figure 4. XPS results of LNMO electrodes for C 1s (a) and O 1s (b) spectra after 1 cycle and 100 cycles (discharged state) together with the spectra of pristine electrodes.
The O 1s and C 1s spectra show changes during cycling while the F 1s, P 2p, Mn 2p, and Ni 2p look very similar in shape. The fact that no major peak is present at 685 eV in the F 1s spectra indicate that no significant amount of LiF was formed, which suggests that FEC and LiPF6did not decompose to a large extent on the surface of the LNMO
electrodes. The most intense peak in the C 1s spectrum of the pristine electrode is assigned to carbon black positioned at 284.5 eV while a smaller contribution at 285 eV originates from hydrocarbons. The energy difference of 0.5 eV was kept constant between carbon black and hydrocarbon peaks in all deconvolutions and all spectra were calibrated vs. the hydrocarbon peak. The LNMO electrode included
Kynar Flex 2801 binder (88 wt% PVdF and 12 wt% HFP), LNMO powder and carbon black. For the pristine electrode, the peaks at binding energies of 286.1 eV, 289.5 eV, 290.8 eV, 291.7 eV, 293.6 eV in the C 1s spectrum could be assigned to CH2 (in PVdF), CF
(in HFP), -CF2(in PVdF), -CF2(in HFP), and -CF3(in HFP).21For
clarity, all peaks that have been assigned to originate from the binder have been colored green in all C 1s spectra. The remaining peaks at 288.3 eV and 286.8 eV correlate to binding energies of C=O and C-O bonds, respectively and have therefore been assigned to originate from adsorbed species on the pristine electrode. In the O 1s spectrum of the pristine electrode, the peak at 529.8 eV represents metal oxides from
Journal of The Electrochemical Society, 164 (4) A942-A948 (2017) A947
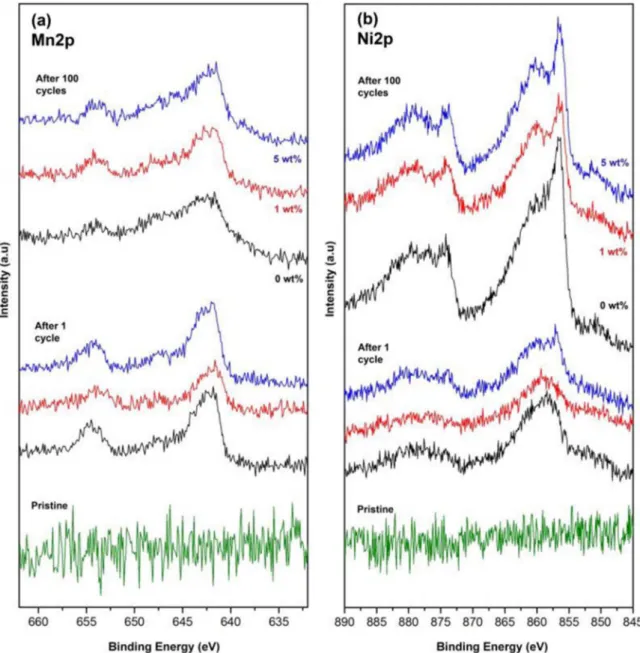
Figure 5. XPS results of LTO electrodes for Mn 2p (a) and Ni 2p (b) spectra after 1 cycle and 100 cycles (discharged state) together with the spectra of pristine electrodes.
LNMO and the other two peaks at higher binding energies originate from adsorbed species in accordance with the C 1s spectrum.
After one cycle, the C 1s spectra of all samples look quite similar, however, the shifting of binder related peaks to lower energies (0.4–0.5 eV) are observed compared to pristine electrode. In the O 1s spectra, it is seen that the relative intensity of the metal oxide peak at 529.8 eV decreases slightly with increasing amounts of FEC in the electrolyte, implying a thicker surface layer formed. The increase in the relative intensity of surface species at 531.7 eV (C=O bonds) and 533.5 eV (C-O bonds) with respect to bulk metal oxide peak suggests more electrolyte decomposition for higher FEC contents.
The XPS spectra of the electrodes after the 100thcycle clearly show
that the differences in surface chemistry after 100 cycles are more significant compared to those of the cells analyzed after 1 cycle. With increasing amounts of FEC, carbon black peaks as well as binder peaks decrease in intensity, while C-O and C=O related peaks increase in intensity as can be seen in C 1s and O 1s spectra. It is clearly visible in the O 1s spectra that the C-O related peak increases profoundly when the FEC amount in the electrolyte increases, which can be correlated to presence of organic ethers such as poly(ethylene oxide), PEO, as the electrolyte decomposition product. When the relative intensities of
C-O and C=O species are compared, it is seen from the more intense C-O peaks that FEC promotes the formation of polymer like species rather than the inorganic carbonates.
In order to investigate the effect of the FEC additive also on the LTO anodes, primarily to distguish if there exists any ‘cross-talk’ between the LNMO and LTO electrodes, XPS analysis was also performed on the LTO electrodes. The Mn 2p and Ni 2p spectra of the LTO electrodes obtained from the same cells (C/5 rate) used for the LNMO-XPS analysis reveal that even after 1 cycle (after 10 hours OCV and 10 hours cycling at 30◦C), Mn and Ni peaks can easily be observed on the LTO electrodes (see Figure5). It is interesting to see that the relative amount of Mn deposited on LTO was approximately the same after 1 and 100 cycles (estimated as below 1 at%), however, the relative amount of Ni was slightly increased from 1 cycle samples to 100 cycle samples (seen at the relative intensity of Ni spectra).
Conclusions
The effect of fluoroethylene carbonate (FEC) as an additive was in-vestigated by using the LP40 electrolyte with three different amounts, 0 wt%, 1 wt% and 5 wt%, of FEC content. The LNMO-LTO lithium
ion battery chemistry was selected for testing of the electrolyte ad-ditive in order to observe the effect of the adad-ditive on the positive LNMO electrode. The results show, contrary to several observations in literature, that the addition of FEC is not beneficial for high-voltage cathodes. This finding is derived from the electrochemical cycling performance of this system: the capacity retention and power capabil-ity were improved for cells without or with only small content of the additive.
XPS analysis of the LNMO electrodes indicated an increase in surface layer thickness with increased FEC content in the electrolyte, while also the chemical composition of the surface layer changed when different electrolytes were used. Addition of FEC favored the formation of a surface layer which is rich in PEO-like organic species rather than inorganic species, which thus seem not to be preferential for the electrochemical performance. XPS analysis on LTO electrodes showed that cross-talk or electrode interactions occurred between pos-itive and negative electrode, since Mn and Ni were detected on the surface of LTO electrodes already after 1 cycle. However, the dif-ference between surface layers formed on the LTO electrodes cycled with 0, 1 and 5 wt% FEC was not significant.
It is well-known that the FEC is used as an electrolyte additive in many other battery systems for its beneficial effect on negative electrode side. Based on the results presented here, however, FEC addition is found to have a negative effect on the long term stability of battery systems using high-voltage LNMO cathodes.
Acknowledgments
The authors acknowledge Leclanch´e for providing the LTO elec-trodes and Dr. Julia Maibach for the discussions on XPS results.
References
1. C. M. Julien and A. Mauger,Ionics, 19, 951 (2013).
2. M. Kunduraci, J. F. Al-Sharab, and G. G. Amatucci.,Chem. Mater, 18, 3585 (2006). 3. X. Ma, B. Kang, and G. Ceder,J. Electrochem. Soc., 157, A925 (2010). 4. J. Xiao et al.,Adv. Mater., 24, 2109 (2012).
5. N. P. W. Pieczonka et al.,J. Phys. Chem. C, 117, 15947 (2013).
6. D. Lu, M. Xu, L. Zhou, A. Garsuch, and B. L. Lucht,J. Electrochem. Soc., 160, A3138 (2013).
7. K. Xu,Chem. Rev., 114, 11503 (2014).
8. N.-S. Choi, J.-G. Han, S.-Y. Ha, I. Park, and C.-K. Back,RSC Adv., 5, 2732 (2015). 9. M. Xu, N. Tsiouvaras, A. Garsuch, H. A. Gasteiger, and B. L. Lucht,J. Phys. Chem.
C, 118, 7363 (2014).
10. V. Tarnopolskiy et al.,J. Power Sources, 236, 39 (2013). 11. A. von Cresce and K. Xu,J. Electrochem. Soc., 158, A337 (2011).
12. M. Xu, D. Lu, A. Garsuch, and B. L. Lucht,J. Electrochem. Soc., 159, A2130 (2012). 13. N. S. Choi et al.,J. Power Sources, 161, 1254 (2006).
14. F. Lindgren et al.,ACS Appl. Mater. Interfaces, 8, 15758 (2016).
15. H. Ota, K. Shima, M. Ue, and J. ichi Yamaki,Electrochim. Acta, 49, 565 (2004). 16. D. Aurbach et al.,Electrochim. Acta, 47, 1423 (2002).
17. H. Lee et al.,Electrochem. commun., 9, 801 (2007). 18. E. Markevich et al.,Langmuir, 30, 7414 (2014).
19. K. Kim, Y. Kim, E.-S. Oh, and H.-C. Shin,Electrochim. Acta, 114, 387 (2013). 20. M. He et al.,J. Electrochem. Soc., 162, A1725 (2015).
21. R. Younesi et al.,J. Electrochem. Soc., 162, A1289 (2015).
22. O. Borodin, M. Olguin, C. E. Spear, K. W. Leiter, and J. Knap,Nanotechnology, 26, 354003 (2015).
23. M. H. Ryou et al.,Electrochim. Acta, 55, 2073 (2010). 24. Y. Li et al.,Electrochim. Acta, 168, 261 (2015).
25. L. Hu, Z. Zhang, and K. Amine,Electrochem. commun., 35, 76 (2013).
26. S. R. Li, C. H. Chen, X. Xia, and J. R. Dahn,J. Electrochem. Soc., 160, A1524 (2013).
27. T. Nordh, R. Younesi, D. Brandell, and K. Edstr¨om,J. Power Sources, 294, 173 (2015).
28. T. Nordh et al.,J. Phys. Chem. C, 120, 3206 (2016).
29. S. R. Li, N. N. Sinha, C. H. Chen, K. Xu, and J. R. Dahn,J. Electrochem. Soc., 160, A2014 (2013).