Predicting target profiles with confidence
as a service using docking scores
Laeeq Ahmed
1*, Hiba Alogheli
2, Staffan Arvidsson McShane
2, Jonathan Alvarsson
2, Arvid Berg
2,
Anders Larsson
3, Wesley Schaal
2, Erwin Laure
1and Ola Spjuth
2Abstract
Background: Identifying and assessing ligand-target binding is a core component in early drug discovery as one or
more unwanted interactions may be associated with safety issues.
Contributions: We present an open-source, extendable web service for predicting target profiles with confidence
using machine learning for a panel of 7 targets, where models are trained on molecular docking scores from a large virtual library. The method uses conformal prediction to produce valid measures of prediction efficiency for a par-ticular confidence level. The service also offers the possibility to dock chemical structures to the panel of targets with QuickVina on individual compound basis.
Results: The docking procedure and resulting models were validated by docking well-known inhibitors for each of
the 7 targets using QuickVina. The model predictions showed comparable performance to molecular docking scores against an external validation set. The implementation as publicly available microservices on Kubernetes ensures resilience, scalability, and extensibility.
Keywords: Predicted target profiles, Virtual screening, Drug discovery, Conformal prediction, AutoDock Vina, Apache
Spark
© The Author(s) 2020. This article is licensed under a Creative Commons Attribution 4.0 International License, which permits use, sharing, adaptation, distribution and reproduction in any medium or format, as long as you give appropriate credit to the original author(s) and the source, provide a link to the Creative Commons licence, and indicate if changes were made. The images or other third party material in this article are included in the article’s Creative Commons licence, unless indicated otherwise in a credit line to the material. If material is not included in the article’s Creative Commons licence and your intended use is not permitted by statutory regulation or exceeds the permitted use, you will need to obtain permission directly from the copyright holder. To view a copy of this licence, visit http://creat iveco mmons .org/licen ses/by/4.0/. The Creative Commons Public Domain Dedication waiver (http://creat iveco mmons .org/publi cdoma in/ zero/1.0/) applies to the data made available in this article, unless otherwise stated in a credit line to the data.
Background
Determining ligand-target binding is a vital part of the drug discovery process [1]. A ligand can bind to multiple target proteins [2] and may cause off-target effects [3, 4]. Knowing the off-target effects of drugs can be beneficial especially in the initial stages of drug discovery. To deter-mine drug-target interactions, pharmaceutical compa-nies and academic institutions involved in drug discovery apply different techniques to detect drug-target interac-tions, including in-vitro pharmacological profiling [5]. However, another interesting method is to build in-silico target profiles for ligands [6][7], which helps in under-standing off-target effects as well as providing a novel
*Correspondence: laeeq@kth.se
1 Department of Electrical Engineering and Computational Science, Royal Institute of Technology (KTH), Lindstedtsvägen 5, 10044 Stockholm, Sweden
Full list of author information is available at the end of the article
opportunity to predict affinity of Novel Chemical Entities (NCEs) against a battery of targets.
A common method to construct target profiles is to predict them using QSAR models based on interaction values available for known active ligands in large interac-tion databases like ChEMBL [8] and ExCAPE-DB [9]. Yu et al. [10] presented a systematic approach for predict-ing drug-target interactions from heterogeneous biologi-cal data employing Random Forest and SVM. TargetNet [11] is a web service for making prediction based drug-target interaction profiles using Naïve bayes based multi-target SAR models. In TargetNet, the molecules can be predicted against 623 SAR models. Bender et al. [12] employs Bayesian based technique to prepare seventy QSAR models that were used to create target profiles to predict adverse off-target effects of drugs. TargetHunter [13] is another web-based tool for predicting target pro-files employing chemical similarity where the models
were trained on ChEMBL data and successful predictions were made on examples taken from PubChem bioassays.
The polypharmacology browser [14] is another
web-based tool for multiple fingerprint target prediction pri-marily based on ChEMBL bio-activity data.
A key disadvantage with QSAR based modelling stud-ies is their dependence on experimental data from the large interaction databases. Normally, the data has a strong bias towards active compounds i.e. on-target or intended effects [15]. Based on this, it is counter-intuitive to use ligand’s on-target binding data to build target pro-files for understanding off-target effects. So when study-ing adverse target reactions it becomes beneficial to find another way than to just look at data from the databases. Furthermore, in some of the earlier research efforts, openness of the source-code and extensibility of the web services is not completely clear.
Another approach is to build models from molecular docking scores using a docking software and perform ligand predictions using the models. In [15], LaBute et al. presented an approach to predict adverse drug reactions using scores produced by large-scale docking on High-Performance Computing machines. AutoDock Vina was used to dock 906 ligands out of which, 560 conformers were selected to train L1-regularized logistic regression models to predict 85 off-target effects. Similarly, Wal-lach et al. [16] presents a method for logistic regression based model training using docking scores from eHiTS [17] docking software for predicting side effects of drugs. Building predicted target profiles based on docking scores is less common because the docking scores are not considered to represent the real drug-target affinity, but large training datasets allows to make better decisions and can cover this weakness.
One important limitation is lack of information about confidence on the predictions in both of the above men-tioned approaches, i.e., ligand-target interaction based QSAR models and docking scores based models. Confi-dence on predictions are of critical importance because off-target drug reactions can directly effect human health.
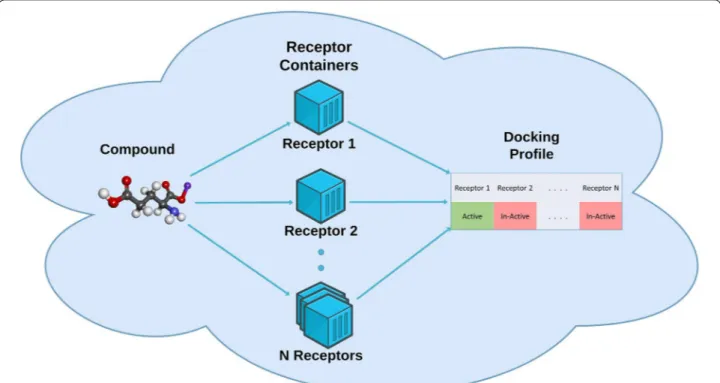
In this paper we introduce an extensible methodol-ogy for predicting target profiles with confidence, where models are trained on docking scores. The methodol-ogy is implemented using a microservices architecture with each target deployed as a Docker container (see
Fig. 1). For orchestration we use Kubernetes managed
by Rancher [18] providing resilience and scalability. The result is an open-source extendable web service, and we demonstrate it with a panel of 7 targets where models are trained on QuickVina docking scores. We also show in this manuscript that target profiles built using docking
scores has predictive properties, and that conformal pre-diction enables quantifying the confidence for each target in a panel.
Methods
Data and tools
We used the clean drug-like molecule library,
down-loaded from ZINC [19] in ready-to-dock SDF format,
preprocessed according to the protocol in [19]. Two dis-tinct datasets of ∼2.3M molecules and 200K molecules were randomly sampled from the clean drug-like
mol-ecule library as the modelling set and the validation set
respectively. The modelling set was used for modelling and internal testing and the validation set was used for external testing. The molecules were described using the signature molecular descriptor [20]. A parallel signature descriptor [21] implementation with Spark was employed and consecutive signature heights of 1–3, i.e., an atom at a distance of max 3 edges, were used. An earlier study [22] identifies that signature heights of 1–3 works well
with Support Vector Machine (SVM) [23] based
molec-ular classification. A fast version of Autodock Vina [24], i.e. QuickVina 2 [25] was used as the underlying docking tool.
The 7 targets 1RT2, 1E66, 1QCF, 3ERD, 3LN1, 1BNU, 1B8O were selected from the safety-related targets in [5] based on availability of good 3D structures for docking and known inhibitors. The PDB entry for each target was selected based on high resolution, i.e., 2.5 Åor better [26]. Receptors and binding site information were downloaded
from sc-pdb [27] database and receptors were prepared
using OpenBabel [28]. Each receptor was docked and
scored against its ligand from the receptor-ligand com-plex using root-mean-square-deviation (RMSD); an RMSD below 2.0 Åis considered to be a successful dock-ing [29]. Table 1 presents the final set of receptors, their PDB codes, resolution and RMSD against corresponding ligand.
A set of well-known inhibitors for each of the recep-tors was compiled for testing purposes. The inhibirecep-tors were selected by reported affinity and downloaded from CHEMBL [8] and Drugbank.ca. [30] The average number of inhibitors in each set was ∼ 50 with the minimum at 43 and maximum at 60 inhibitors. A set of 50 compounds with low affinity for one of the receptor with PDB-ID 1BNU was also downloaded from CHEMBL for test-ing purposes. A large number of less active compounds were found for the receptor 1BNU and therefore, it was the main target used for the cross reactivity. For a list of all the compounds used in the study and a comparison of the known active and inactive compounds for 1BNU, see Additional file 1.
Conformal prediction
Conformal prediction is a mathematical framework proven to produce well calibrated predictions for given confidence levels, developed by Vovk et al. in [31]. Instead of producing point estimates as most traditional learning algorithms, Conformal Prediction instead pro-duces prediction regions or prediction sets. In classifica-tion the predictor outputs confidence p-values for each class, which together with the user-defined confidence level produces the final prediction set. In the binary
classification setting, classes 0 and 1 translate into four possible prediction sets {0}, {1}, {0,1} and Ø (the empty set). The prediction sets are guaranteed to contain the true label of the object with a probability equal to the user-defined confidence level. For this guarantee to hold, the only assumption is that the observed data is
exchangeable [32]. Knowing that Conformal Predictors
always produce valid predictions, one only has to care about the efficiency of the predictions. The efficiency of a Conformal Predictor can be defined and evaluated using various metrics, see [33] for a thorough discussion on the most commonly used. We here define efficiency as the ratio of single-label prediction sets.
In this work we are using Inductive Conformal Pre-diction (ICP), that works in the following way; training data is randomly partitioned into two disjoint sets called
proper training set and calibration set. The proper
train-ing set is used to train the underlytrain-ing learntrain-ing model. The model is then used for predicting all observations in the calibration set and a nonconformity measure, a ‘strangeness measure’, is used for computing how
con-forming each observation is compared to the learned
model. We use a Mondrian approach that treats classes individually and has been shown to have beneficial prop-erties when working with unbalanced datasets [34]. It is important to point out that conformal prediction delivers Fig. 1 Vision of the work. The figure shows the vision of the work i.e. all targets would have a Docker container and these Docker containers would
be fired up simultaneously in a Cloud environment. A compound of interest would be tested against all the targets and a target profile of the compound would be created
Table 1 Selection of receptors: the table represents
the selected receptors and how they were selected
All the selected receptors must have resolution of 2.5 (Å) or under and RMSD of 2.0 (Å) or under
Target class PDB entry Resolution (Å) RMSD (Å)
HIV RT 1RT2 2.5 0.46
Acetylcholinesterase 1E66 2.1 0.34
HCK Tyrosine kinase 1QCF 2 0.29
Estrogen receptor 3ERD 2.03 0.57
Cyclooxygenase-2 3LN1 2.4 0.27
Carbonic anhydrase 2 1BNU 2.15 1.21 Purine nucleoside
individual prediction intervals for each object predicted, and hence each prediction incorporates a measure of its confidence, implicitly offering a solution to the fuzzy concept of ’applicability domain’ [35]. For further details on conformal prediction and its use in QSAR, we refer to previous studies [32, 36].
Modelling
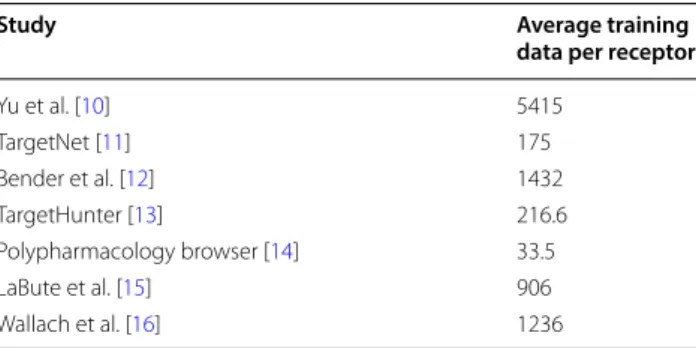
For building the machine learning (ML) models, we used our earlier work, an intelligent iterative conformal prediction based virtual screening (CPVS) [37] strategy. A modified version of CPVS was used for modelling, whereas QuickVina [25] was used for docking. CPVS is an SVM based, efficient, parallel, iterative virtual screening method. QuickVina is an opensource tool and therefore permits inclusions in web services to be used by every-one. In QuickVina, a ligand with a lower score is gener-ally considered to have better affinity against a particular receptor, therefore, the labelling strategy in CPVS was modified accordingly, i.e., ligands with low scores were labelled as 1 (high-affinity) and ligands with high scores were labelled as 0 (low-affinity). A sample dataset was docked and sorted by docking scores and the top 10% and the bottom 10% of the molecules were used for model training. The rest of the strategy was same as given in the original CPVS method [37]. The model training was performed in an iterative fashion until the model reaches the intended efficiency of 80 or above. During modelling, an average of ∼0.53 million ligands were docked against each of the 7 receptors. In comparison to the mentioned studies (see Table 2), the training set for modelling in our study was much larger, i.e., on average ∼0.11 mil-lion ligands per receptor model. Each trained model was deployed as a Docker container with a REST API.
Web service
We developed a Web service with a front-end that offers a graphical user interface (GUI) to input one or more chemical compounds in SMILES format and options to set the confidence level for predictions. The GUI com-municates with all individual target model microservices, and delivers a panel of target predictions; HIGH, LOW or UNKNOWN docking score. The predictions are based on conformal p-values, i.e. if only p-value(0) > ǫ , then the output prediction is HIGH, if only p-value(1) > ǫ , then the output prediction is LOW and if both p-value(0) and p-value(1) are greater or less than ǫ , the prediction is UNKNOWN, where ǫ = 1 - confidence. An example of the predicted target profiles for two compounds is shown in Fig. 2. For QuickVina, a low-score prediction means high-affinity and vice versa. The actual p-values for the
low-score and the high-score classifications are available by hovering over the prediction cells.
Once target profiles are produced, the user can select individual compounds and invoke the molecular docking functionality to dock them. The time for docking a com-pound varies between 10 to 30 seconds on our system. We also provide a functionality for users to submit new receptors in PDBQT format to the system administrator and request inclusion in the system. This requires quite some work, and will be done as time permits.
Implementation and deployment
The REST API for the web service was implemented using microservices and the Play 2.0 [38] web applica-tion framework using Scala language and deployed using
Rancher [18], an open-source platform for Kubernetes
management, providing integrated tools for running con-tainerized applications. Complete code for the web ser-vice REST API and GUI is available on Github [39, 40]. For deploying the web service using Kubernetes, Docker containers were used to build an independent service for each receptor. Similarly a separate container was used for the MariaDB database that keeps the docking scores of all the docked ligands. A separate container was also build for the webservice GUI. A bash script [41] was written to deploy all the Docker containers. The bash script applies all kubernetes yaml deployment descriptors that launch the Docker containers. The microservice architecture has many advantages, e.g. independent scaling of ser-vices based on usage, cross platform independence and several other inherited benefits of dockerization [42]. All the Docker images are available on Docker Hub [43] with appropriate tags [44–47]. Additionally, users can also cre-ate Docker images for new receptors using the Dockerfile available at [48]. A tutorial is available in Additional file 1
explaining how to create and execute Docker images locally. The webpage for the PTPAAS microservice can be accessed at http://ptpaa s.servi ce.pharm b.io and the
Table 2 Training data size in earlier studies
Study Average training
data per receptor Yu et al. [10] 5415 TargetNet [11] 175 Bender et al. [12] 1432 TargetHunter [13] 216.6 Polypharmacology browser [14] 33.5 LaBute et al. [15] 906 Wallach et al. [16] 1236
models can also be accessed separately via an OpenAPI interface.
Results
Virtual screening evaluation
In order to verify the virtual screening process, we sepa-rately docked well-known inhibitors (actives) for each of the 7 receptors using QuickVina and computed the enrichment factor for the inhibitors docking scores against the docking scores of the ligands docked during the modelling procedure. Enrichment factor is one of the most commonly used metrics for measuring the accu-racy of virtual screening. Enrichment means where the position of the value is in the evaluated dataset in com-parison to the compared dataset. The higher the enrich-ment factor, the better the performance of docking in identifying known inhibitors. Figure 3 shows the docking enrichment results of QuickVina based CPVS for all the 7 receptors. The black dashed line represents ideal scores, the grey dotted line on the diagonal represents random scores, whereas the blue solid line represents the scores of the known inhibitors. For most of the receptors, the results show good or satisfactory enrichment i.e. well above what would be scores of random ligands and rela-tively closer to the ideal scores.
We also performed docking enrichment of inhibitors against docking scores of an external validation set which was not seen by the CPVS algorithm during modelling. The docking enrichment can be seen as blue solid line in Fig. 4. The enrichment shows satisfactory results and were used as baseline for evaluating model predictions. Model evaluation
The CPVS models were evaluated using multiple meth-ods: (i) by comparing the docking and the predicted enrichment on the external validation set, (ii) by polyp-harmacology validation i.e. by predicting the activity of
known inhibitors for multiple receptors and (iii) by com-puting the model efficiency.
Predicted vs docking enrichment
In Fig. 4, the red line represents the predicted enrich-ment on the external validation set and the grey line on the diagonal represents random predictions. To generate the predicted enrichment red line, we made predictions using the CPVS models, i.e., the p-values of the inhibi-tors and the external validation set for being predicted as either a low-scoring or a high-scoring ligand. The p-val-ues were used to compute unary enrichment valp-val-ues by the following formula:
These values were used to create predicted enrich-ment of known inhibitors against the external valida-tion set. In comparing the predicted enrichment (red solid line) to the docking enrichment (blue solid line), the results were satisfactory for the most of the recep-tors except for PDB-ID 1B8O. Area under the enrich-ment curves (AUC) was also calculated and reported in Fig. 4 for comparison.
The number of the known inhibitors found in the top 10% and 20% of the docked molecules and the predicted
ligands were also computed and presented in Table 3.
The average number of the known inhibitors, for all the receptors, found in the top 20% of the predicted ligands was 63% whereas it was 74% for the docked molecules. In the top 10% of the predicted ligands, the average num-ber of known inhibitors found were 46% whereas in the top 10% of the docked molecules, it was 55%. Again, the receptor with PDB-ID 1B8O was an exception where
If (Plow−scoring>Phigh−scoring) Plow−scoring∗ (1 − Phigh−scoring)
else
− Phigh−scoring∗ (1 − Plow−scoring)
Fig. 2 Predicted profiles and molecular docking. The figure shows the predicted target profiles for two compounds against 7 receptors. The
prediction is either low-scoring, high-scoring or unknown presented in green, red and blue color respectively. The prediction models were developed based on QuickVina docking scores. Following QuickVina, in general, a low-score prediction means high-affinity and vice versa. An unknown prediction means the model has either failed to recognize a class for the compound or the compound is predicted to be part of both classes with the given confidence level. The p-values for the low-score and high-score class are also available by hovering over the prediction cells, seen here in the black placeholder. A molecule of interest can then be docked against a particular receptor using QuickVina
only 11% of the inhibitors were found in the top 20% of the predicted ligands and none in the top 10%. Inspec-tion of the PDB file for 1B8O did not reveal any obvious explanations for this. The docking works better for some receptors than others and in the case of 1B8O, not many inhibitors were found in the top most scoring ligands (see
Fig. 4). This could be one reason of under-performing
predicted enrichment for 1B8O.
The methodology was also tested for known in-actives against the external validation set and the results are shown in Fig. 5. The green line represents the docking enrichment of the known in-actives of the 1BNU recep-tor against the external validation set and the magenta line represents the predicted enrichment of the known in-actives of the 1BNU receptor against the predictions of the external validation set. AUC was also computed Fig. 3 Enrichment curves for Vina docking. In order to verify the virtual screening process, well known inhibitors for each of the 7 receptors were
docked using QuickVina and the enrichment factor was computed for the inhibitors docking scores against the docking scores of molecules docked during modelling procedure. Enrichment factor is one of the most common index used for measuring the success of Virtual Screening. Enrichment means where the value lies in the evaluated dataset in comparison to the compared dataset. The higher the enrichment factor, the better the performance of docking in identifying known inhibitors. The black dashed line represents ideal scores, the grey dotted line in the middle represents random scores whereas the blue solid line represents the scores of the inhibitors. For most of the receptors, the results show good or satisfactory enrichment
and shown in Fig. 5 for comparison. The result is satisfac-tory, with ∼82% of the green line being below the random line. Similarly, the predicted enrichment for the known in-actives (magenta) shows encouraging results as ∼98% of it appears below the random line and also near to the docking enrichment green line.
Polypharmacology validation
Polypharmacology validation means testing the inhibi-tion of the compounds for multiple targets or disease pathways. A total of 9 compounds were selected from CHEMBL [8] that have a reasonable level of activity for two receptors as given in Table 4. The results were quite good for 4 out of the 9 compounds that were correctly Fig. 4 Predicted enrichment vs docking enrichment on the external validation set. The figure presents the comparison of docking enrichment
in blue and predicted enrichment in red whereas the grey line in the figure represents random predictions. The comparison was used to evaluate the performance of CPVS models. The docking enrichment was created by comparing docking scores of well known inhibitors and docking scores of an external validation. Similarly the predicted enrichment was created by comparing predicted p-values for well-known inhibitors and the external validation set. AUC was also calculated and reported in the figure for comparison. Overall the CPVS models performed well and predicted enrichment is comparable to docking enrichment, except for receptor with PDB-ID 1B8O, when the predicted enrichment is a little worse than docked enrichment. The reason could be less number of known inhibitors in the top scored molecules, seen in the left bottom corner of the 1B8O graph
predicted as actives for both of the receptors and only one of the compound was predicted incorrectly as an inactive. In none of the examples, both the compounds were predicted incorrectly as an inactive.
Efficiency
The models were also evaluated through the measure of efficiency. As mentioned before, the predictions from conformal prediction based classification could be either {0}, {1}, {0, 1} or Ø. Efficiency means the percentage of ligands predicted as low-scoring or high-scoring, i.e.,
single predictions out of the predictions on the complete
dataset. Table 3 presents the efficiency of each of the 7 models that are used for predicting the target profiles. All the models created had an efficiency of 80 or higher as intended for both the modelling set and the external validation set. Further details about model efficiency and accuracy can be found in the CPVS paper [37].
Discussion
Target profiles are utilized to understand the off-tar-get effects of drugs in early stage of drug development. In this work, we present a new way to build prediction based target profiles. We build conformal prediction based machine learning models using the docking scores produced by QuickVina. The process was validated through virtual screening and model evaluation and overall recorded comparable results. Hence, the main finding is that building efficient models for predicting the target profiles are possible through docking scores.
Although previous studies with predictions of ligand-target binding using the docking scores are available, a tool or a web service for predicting target profiles based on docking scores is unavailable to the best of our knowl-edge; the available web services make use of interac-tion values from databases. Our work opens up a new direction of using docking scores for predicting target profiles and it would be interesting to compare the two approaches in the future and investigate hybrid system.
The PTPAAS system can be instantiated on other infra-structures such as public cloud providers or on-prem Fig. 5 Validating the model for the known in-actives for the receptor
1BNU. The figure presents the comparison of the docking enrichment in green and the predicted enrichment in magenta for the known in-active compounds. The comparison was used to validate the performance of the 1BNU receptor model for the known in-active compounds. The docking enrichment was created by comparing the docking scores of the known in-actives and the docking scores of the external validation set. Similarly the predicted enrichment was created by comparing the predicted p-values for the known in-actives and the p-values for the external validation set. AUC was also calculated and reported in the figure for comparison. Overall, the 1BNU model performed well and the predicted enrichment was comparable to the docking enrichment. The green line for the docking enrichment, which was below the random grey line, also confirms the validity of the virtual screening evaluation
Table 3 The table represents the model efficiency of predictions on the complete modelling set (from which training set was taken) and the external validation set
The last four columns represents the predicted and the docking enrichment factor for inhibitors, i.e., the percent inhibitors found in the top 10% and 20% of the database search
PDB entry Eff
on modelling set (%)
Eff on ext.
val. set (%) Inhibitors in top 10 (%) predicted ligands Inhibitors in top 10 (%) docked molecules Inhibitors in top 20 (%) predicted ligands Inhibitors in top 20 (%) docked molecules 1RT2 93 97 32 31 68 68 1E66 93 94 60 52 67 70 1QCF 86 93 65 65 73 79 3ERD 93 92 65 58 78 69 3LN1 98 98 50 82 68 86 1BNU 87 87 47 55 75 78 1B8O 94 94 0 43 11 73 Average 92 94 46 55 63 74
infrastructures (e.g. a company intranet), our deployment at http://ptpaa s.servi ce.pharm b.io should be seen as a reference instance. The system has been designed with extensibility in mind, and new models can be deployed as micro services using Docker containers. Such new services (comprising models for new receptors) can be deployed in a similar way as shown for the reference instance on Kubernetes (code and instructions available on [41]). In Additional file 1 we show how users can build models using our previous method [37] and then use the models to create service for a new receptor. Instructions are provided to deploy and add the Docker container for a new receptor to the service [39].
Openness and accessibility are important in science, and hence we switched from OEDocking used in the original CPVS method to QuickVina for docking in this study. The move to QuickVina was quite simple and suggests that the proposed methodology can be used with different docking methods with ease. However, QuickVina is slower and thus restricted us to build lim-ited number of models especially with large datasets. In the future, we would like to add more receptor models, and we encourage the community to contribute to this goal.
Conclusion
In this paper we present a new methodology for build-ing predicted target profiles usbuild-ing conformal prediction and docking scores from virtual screening. The method was validated through docking of well known inhibitors for each of the 7 receptors. Virtual screening enrichment graphs and model efficiency suggests that docking score based predicted target profiles are a new viable option. The method is made available as a web service with the primary objective to provide predicted target profiles whereas molecular docking is also provided to dock ligands of interest.
Supplementary information
Supplementary information accompanies this paper at https ://doi. org/10.1186/s1332 1-020-00464 -1.
Additional file 1. The file contains a step by step tutorial for running
the CPVS API on a local system. It also explains the process of preparing new Docker images for new receptors. Secondly, the file contains various compounds used in the study. Thirdly, it includes property distribution of the known actives and inactives for the receptor 1BNU.
Abbreviations
AUC : Area under the curve; NCE: Noval chemical entities; QSAR: Qualita-tive structure activity relationship; SAR: Structure activity relationship; SVM: Support Vector Machines; PTPAAS: Predicting target profile as a service using docking scores; CPVS: Conformal prediction based virtual screening; RMSD: Root mean square deviation; PDB: Protein data bank; SMILES: Simplified molecular input line entry specification.
Acknowledgements
Cloud resources were provided by SNIC Science Cloud (SSC) [49] UPPMAX region under the projects SNIC 2018/10-5 and SNIC 2019/10-8.
Authors’ contributions
LA and OS designed the study. LA prepared the models and implemented the service. LA, OS and WS analyzed the results. LA, AB and AL deployed the web service. WS and HA contributed with expertise in bio medicine and com-putational chemistry respectively. SAMS and JA contributed with signature generation and conformal prediction. EL contributed with expertise in high-performance computing. All authors read and approved the final manuscript.
Funding
Open Access funding provided by Kungliga Tekniska Hogskolan This project was supported by the Swedish e-Science Research Center (SeRC) and the strategic research programme eSSENCE.
Availability of data and materials
The clean drug-like molecule library used for our benchmarks can be down-loaded from ZINC [19] in ready-to-dock SDF format. The Docker containers for each of the receptor microservice are available on Docker Hub with appropri-ate tags for each of the receptor and can be reached by searching cpvsapi on the Docker Hub website [43]. Additionally, users can also create Docker images for new receptors using the Docker file available at [48].
Competing interests
The authors declare that they have no competing interests.
Ethics approval and consent to participate
Not applicable.
Following is the list of 9 compounds with reasonable amount of affinity for a couple of targets to perform polypharmacology validation
CHEMBL15841 3ERD 1BNU active Inactive
CHEMBL165 3ERD 1BNU Active Active
CHEMBL1782957 3ERD 1BNU Active Active
CHEMBL1782958 3ERD 1BNU Active Unknown
CHEMBL255863 1QCF 1BNU Unknown Active
CHEMBL4075710 3ERD 1BNU Active Active
Author details
1 Department of Electrical Engineering and Computational Science, Royal Institute of Technology (KTH), Lindstedtsvägen 5, 10044 Stockholm, Sweden. 2 Department of Pharmaceutical Biosciences, Uppsala University, Box 591, 75124 Uppsala, Sweden. 3 National Bioinformatics Infrastructure Sweden (NBIS), Department of Cell and Molecular Biology, Uppsala University, Box 596, 75124 Uppsala, Sweden.
Received: 20 May 2020 Accepted: 23 September 2020
References
1. Yıldırım MA, Goh K-I, Cusick ME, Barabási A-L, Vidal M (2007) Drug target network. Nat Biotechnol 25(10):1119
2. Hopkins AL (2008) Network pharmacology: the next paradigm in drug discovery. Nat Chem Biol 4(11):682
3. Peters J-U (2013) Polypharmacology-foe or friend? J Med Chem 56(22):8955–8971
4. Ravikumar B, Aittokallio T (2018) Improving the efficacy-safety balance of polypharmacology in multi-target drug discovery. Expert Opin Drug Discov 13(2):179–192
5. Bowes J, Brown AJ, Hamon J, Jarolimek W, Sridhar A, Waldron G, Whitebread S (2012) Reducing safety-related drug attrition: the use of in vitro pharmacological profiling. Nat Rev Drug Discov 11(12):909
[cito:agreesWith]
6. Cereto-Massagué A, Ojeda MJ, Valls C, Mulero M, Pujadas G, Garcia-Vallve S (2015) Tools for in silico target fishing. Methods 71:98–103
7. Sydow D, Burggraaff L, Szengel A, van Vlijmen HW, IJzerman AP, van Westen GJ, Volkamer A (2019) Advances and challenges in computational target prediction. J Chemical Inf Model 59(5):1728–1742
8. Gaulton A, Bellis LJ, Bento AP, Chambers J, Davies M, Hersey A, Light Y, McGlinchey S, Michalovich D, Al-Lazikani B et al (2011) Chembl: a large-scale bioactivity database for drug discovery. Nucleic Acids Res 40(D1):1100–1107 [cito:citesAsDataSource]
9. Sun J, Jeliazkova N, Chupakhin V, Golib-Dzib J-F, Engkvist O, Carlsson L, Wegner J, Ceulemans H, Georgiev I, Jeliazkov V et al (2017) Excape-db: an integrated large scale dataset facilitating big data analysis in chemog-enomics. J Cheminf 9(1):17
10. Yu H, Chen J, Xu X, Li Y, Zhao H, Fang Y, Li X, Zhou W, Wang W, Wang Y (2012) A systematic prediction of multiple drug-target interactions from chemical, genomic, and pharmacological data. PloS ONE 7(5):37608 11. Yao Z-J, Dong J, Che Y-J, Zhu M-F, Wen M, Wang N-N, Wang S, Lu A-P, Cao
D-S (2016) Targetnet: a web service for predicting potential drug-target interaction profiling via multi-target SAR models. J Comput Aided Mol Des 30(5):413–424
12. Bender A, Scheiber J, Glick M, Davies JW, Azzaoui K, Hamon J, Urban L, Whitebread S, Jenkins JL (2007) Analysis of pharmacology data and the prediction of adverse drug reactions and off-target effects from chemical structure. ChemMedChem Chem Enab Drug Discov 2(6):861–873 13. Wang L, Ma C, Wipf P, Liu H, Su W, Xie X-Q (2013) Targethunter: an in
silico target identification tool for predicting therapeutic potential of small organic molecules based on chemogenomic database. AAPS J 15(2):395–406
14. Awale M, Reymond J-L (2017) The polypharmacology browser: a web-based multi-fingerprint target prediction tool using chembl bioactivity data. J Cheminf 9(1):11
15. LaBute MX, Zhang X, Lenderman J, Bennion BJ, Wong SE, Lightstone FC (2014) Adverse drug reaction prediction using scores produced by large-scale drug-protein target docking on high-performance computing machines. PloS ONE 9(9):106298 [cito:agreesWith]
16. Wallach I, Jaitly N, Lilien R (2010) A structure-based approach for map-ping adverse drug reactions to the perturbation of underlying biological pathways. PloS ONE 5(8):12063
17. Zsoldos Z, Reid D, Simon A, Sadjad SB, Johnson AP (2007) ehits: a new fast, exhaustive flexible ligand docking system. J Mol Graph Modell 26(1):198–212
18. Run Kubernetes everywhere. https ://ranch er.com/. [cito:usesMethodIn] (2019–2020)
19. Irwin JJ, Sterling T, Mysinger MM, Bolstad ES, Coleman RG (2012) Zinc: a free tool to discover chemistry for biology. J Chem Inform Model 52(7):1757–1768 [cito:citesAsDataSource]
20. Faulon J-L, Visco DP, Pophale RS (2003) The signature molecular descrip-tor. 1. Using extended valence sequences in GSAR and GSPR studies. J Chem Inf Comput Sci 43(3):707–720 [cito:citesAsAuthority] 21. Capuccini M, Spark cheminformatics utils. https ://githu b.com/mcapu
ccini /spark -chemi nform atics . [cito:usesMethodIn] (2015–2020) 22. Alvarsson J, Eklund M, Andersson C, Carlsson L, Spjuth O, Wikberg JE
(2014) Benchmarking study of parameter variation when using signature fingerprints together with support vector machines. J Chem Inf Model 54(11):3211–3217 [cito:agreesWith]
23. Cortes C, Vapnik V (1995) Support vector networks. Mach Learn 20(3):273–297 [cito:citesAsAuthority]
24. Trott O, Olson AJ (2010) Autodock vina: improving the speed and accu-racy of docking with a new scoring function, efficient optimization, and multithreading. J Comput Chem 31(2):455–461
25. Alhossary A, Handoko SD, Mu Y, Kwoh C-K (2015) Fast, accurate, and reliable molecular docking with quickvina 2. Bioinformatics 31(13):2214– 2216 [cito:usesMethodIn]
26. Jones G, Willett P, Glen RC, Leach AR, Taylor R (1997) Development and validation of a genetic algorithm for flexible docking. J Mol Biol 267(3):727–748
27. Kellenberger E, Muller P, Schalon C, Bret G, Foata N, Rognan D (2006) sc-pdb: an annotated database of druggable binding sites from the protein data bank. J Chem Inf Model 46(2):717–727 [cito:usesMethodIn] 28. O’Boyle NM, Banck M, James CA, Morley C, Vandermeersch T, Hutchison
GR (2011) Open babel : an open chemical toolbox. J Cheminf 3(1):33
[cito:usesMethodIn]
29. Andersson CD, Thysell E, Lindström A, Bylesjö M, Raubacher F, Linusson A (2007) A multivariate approach to investigate docking parameters’ effects on docking performance. J Chem Inf Model 47(4):1673–1687
30. Wishart DS, Knox C, Guo AC, Cheng D, Shrivastava S, Tzur D, Gautam B, Hassanali M (2007) Drugbank: a knowledgebase for drugs, drug actions and drug targets. Nucleic acids research 36(suppl_1):901–906
[cito:citesAsDataSource]
31. Vovk V, Gammerman A, Shafer G (2005) Algorithmic learning in a random world. Springer, New York [cito:citesAsAuthority]
32. Norinder U, Carlsson L, Boyer S, Eklund M (2014) Introducing conformal prediction in predictive modeling. a transparent and flexible alternative to applicability domain determination. J Chem Inf Model 54(6):1596– 1603 [cito:agreesWith]
33. Vovk V, Fedorova V, Nouretdinov I, Gammerman A (2016) Criteria of efficiency for conformal prediction. In: Symposium on conformal and probabilistic prediction with applications. Springer, pp 23–39.
[cito:citesAsAuthority]
34. Norinder U, Boyer S (2017) Binary classification of imbalanced data-sets using conformal prediction. J Mol Graph Modell 72:256–265
[cito:agreesWith]
35. Sahigara F, Mansouri K, Ballabio D, Mauri A, Consonni V, Todeschini R (2012) Comparison of different approaches to define the applicability domain of GSAR models. Molecules 17(5):4791–4810
36. Gammerman A, Vovk V (2007) Hedging predictions in machine learn-ing. Comput J 50(2):151–163. https ://doi.org/10.1093/comjn l/bxl06 5[cito:citesAsAuthority]. arXiv :06110 11
37. Ahmed L, Georgiev V, Capuccini M, Toor S, Schaal W, Laure E, Spjuth O (2018) Efficient iterative virtual screening with apache spark and confor-mal prediction. J Cheminf 10(1):8 [cito:usesMethodIn][cito:extends] 38. Drobi S (2012) Play2: a new era of web application development. IEEE
Internet Comput 16(4):89–94 [cito:usesMethodIn]
39. Ahmed L. Rest API for CPVS. https ://githu b.com/laeeq 80/cpvsA PI
(2019–2020)
40. Ahmed L. User Interface for CPVSAPI. https ://githu b.com/laeeq 80/cpvs-ui
(2019–2020)
41. Larsson A. Kubernetes deployment of ptdpaas. https ://githu b.com/ pharm bio/dpaas . [cito:usesMethodIn] (2019–2020)
42. Merkel D (2014) Docker: lightweight Linux containers for consistent development and deployment. Linux J 2014(239):2 [cito:usesMethodIn] 43. Docker Hub. https ://hub.docke r.com/. [cito:usesMethodIn] (2014–2020)
•fast, convenient online submission
•
thorough peer review by experienced researchers in your field
• rapid publication on acceptance
• support for research data, including large and complex data types
•
gold Open Access which fosters wider collaboration and increased citations maximum visibility for your research: over 100M website views per year
•
At BMC, research is always in progress. Learn more biomedcentral.com/submissions
Ready to submit your research? Choose BMC and benefit from:
47. Ahmed L. Docker Image on Docker Hub to Upload PDBQT file to the web service. https ://hub.docke r.com/r/laeeq /uploa dfile (2019–2020) 48. Ahmed L. Docker File for CPVSAPI Project. https ://githu b.com/laeeq 80/
cpvsD ocker (2018–2020)
Publisher’s Note
Springer Nature remains neutral with regard to jurisdictional claims in pub-lished maps and institutional affiliations.