t_
(p
110.
£;255
flf(ell1J1c
AN ANALYSIS OF THE GATE AIRCRAFT
PYRGEOMETER INSTRUMENTATION
AN ANALYSIS OF THE GATE
AIRCRAFT PYREGEOMETER INSTRUMENTATION.
This contribution is the second in a series of reports on GATE Radiation Subprograrrme results which will be published simultaneously as Colorado State University Atmospheric Science Papers in English and in the Transactions of the Main Geophysical Observatory, Leningrad, in Russian.
AN ANALYSIS OF THE GATE
AIRCRAFT PYRGEOMETER INSTRUMENTATION
by
Bruce A. Albrecht and Stephen K. Cox Department of Atmospheric Science
Colorado State University Fort Collins, Colorado
80523
and
M. Prokofyev
Main Geophysical Observatory Department of Radiation Studies
Leningrad USSR
November 1976
ABSTRACT
Significant differences in US and USSR aircraft measurements of hemispherical infrared irradiance were noted during GATE in-flight intercomparisons. In specific instances the downward irradiance
measured by the USSR instrument (a Kozyrev pyrgeometer) was as much as 1.5 times greater than the irradiance measured with the US instrument (an Eppley pyrgeometer). A post-GATE intercomparison at Colorado State University verified these differences; the pyrgeometer measurements were compared with independent measurements obtained with an infrared bolo-meter and with a radiative transfer calculation. The differences noted during GATE and post-GATE intercomparisons may be attributed to differ-ences in calibration techniques and the accurate determination of the temperature of the instrument's thermopile cold junctions. When
corrections based upon this analysis were applied to the USSR data, the maximum intercomparison differences were less than 5%.
-i-TABLE OF CONTENTS
PAGE
ABSTRACT i
LIST OF TABLES iii
LIST OF FIGURES iv
I. INTRODUCTION l
I I. THEORY OF OPERATION 2
III. PYRGEOMETER CALIBRATION PROCEDURE 7
IV. GATE FIELD PHASE INTERCOMPARISON DATA 12
v.
POST GATE INTERCOMPARISON DATA 16VI. ANALYSIS OF DATA 16
VI I. CONCLUDING REMARKS 25
ACKNOWLEDGEMENTS 27
REFERENCES 28
-ii-TABLE I. I I. III. IV. LIST OF TABLES
Intercomparison data from USSR IL-18M and US C-130 aircraft, 24 June 1974.
Intercomparison data from USSR IL-18M and US Sabreliner
~ircraft, 30 July 1974.
Post GATE intercomparison data gathered at Fort Collins, Colorado on 1 November 1975.
Possible flux overestimate due to spectral sensitivity differences. -iii-PAGE 13 14 17 19
LIST OF FIGURES FIGURE PAGE 2 3 4 5 6 7 8
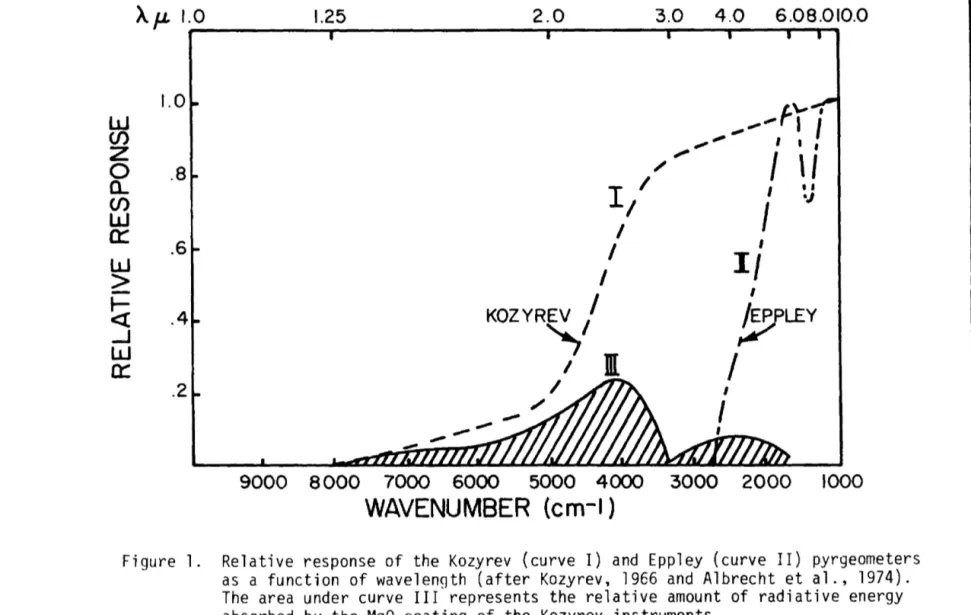
Relative response of the Kozyrev (curve I) and Eppley 3 (curve II) pyrgeometers as a function of wavelength
(after Kozyrev, 1966 and Albrecht et al., 1974). The area under curve III represents the relative amount of radiative energy absorbed by the MgO coating of the Kozyrev instruments.
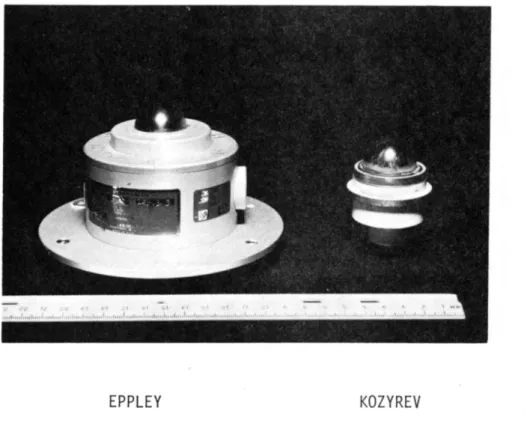
Photograph of the Kozyrev and Eppley pyrgeometers. Sketch of the Kozyrev and Eppley pyrgeometers.
Thermopile output, sink temperature, dome temperature, and blackbody temperature as a function of time for a
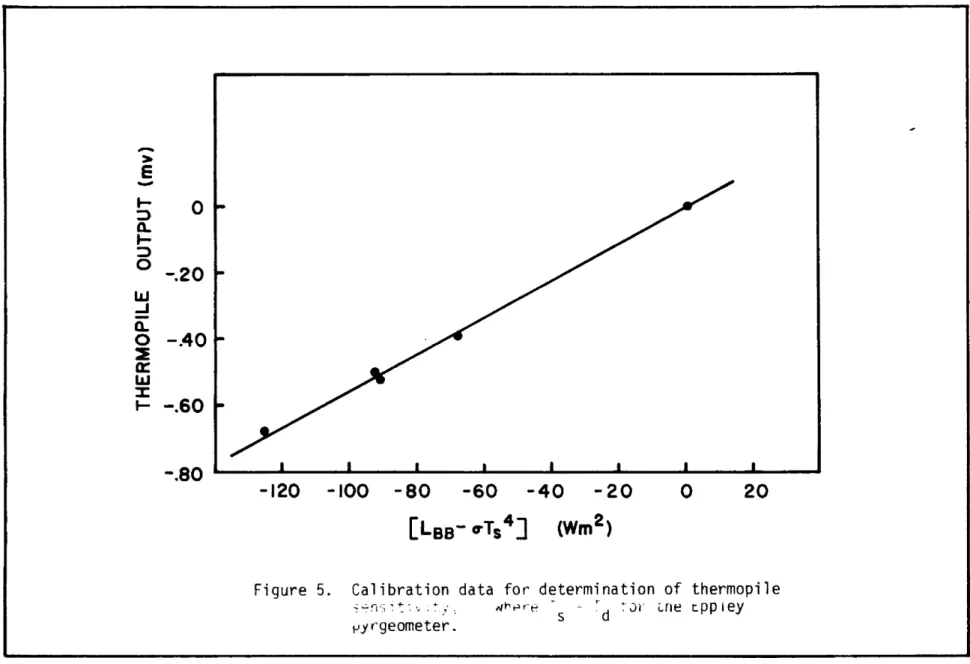
typical calibration run of the Eppley pyrgeometer. Calibration data for determination of thermopile sensitivity, s, where T = Td for the Eppley
pyrgeometer. s
Calibration data for determination of the dome-sink temperature difference coefficient, k, in Eq. 2. Infrared irradiance as a function of zenith angle. Kozyrev pyrgeometer output as a function of the
instrument housing temperature.
-iv-5 6 9 10 11 18 23
I. ~NTRODUCTION
During the GATE field phase participating scientists from the USA and the USSR became aware of significant differences between their air-craft measurements of the hemispherical infrared irradiance. Although several in-flight intercomparisons between the US and USSR aircraft w~re
made during the experiment, there was insufficient time to investigate the cause of the observed differences.
At the Informal Planning Meeting for the GATE Radiation Subprogram held in Leningrad, USSR in June 1975, attendees endorsed an effort which would resolve the differences between the two infrared irradiance data sets. In response to this endorsement as well as previous initiatives by scientists from both countries, scientists from both the USA and the USSR met at Colorado Sta:e University during October 1975 to investigate the discrepancies noted above.
During the period of their joint investigation, the researchers sought answers to the following questions.
1) How reliable are preliminary aircraft hemispheric radiation data reported from the GATE?
2) What are the physical reasons for the observed discrepancies between the data of the USSR and the USA?
3) What steps may be taken to bring the two data sets into agreement? The remainder of this report attempts to answer the above questions from the results of the joint research conducted during and after GATE by the authors.
-2-II. THEORY OF OPERATION
The theory of operation of the USSR and USA pyranometers used in GATE is similar and is described by Robinson (1966). Since the pyrano-meter intercomparison data given in Section IV of this paper did not show large discrepancies, we shall not discuss the characteristics of the pyranometer in detail at this time.
The longwave broadband pyrgeometers used for aircraft measurements during GATE on board the IL-18M aircraft of the Main Geophysical Obser-vatory, Leningrad, are a modification of the well known Kozyrev net radiometers manufactured by the LEEI (Leningrad Electrotechnical Engineering Institute). The detailed description and theory of opera-tion of these radiometers is given by Kozyrev, et al (1966), while the results of the field tests of the first modifications of the instruments were reported by Faraponova and Timanovskaya (1966) and Faraponova (1966).
For the purpose of aircraft measurements, two identical pyrgeometers are used instead of a single net radiometer, each measuring the longwave irradiance coming from a hemisphere.
The pyrgeometers have KRS-5 domes and white receiving surfaces coated with magnesium oxide that reflects the shortwave portion of the incoming radiation. The typical spectral response of these sensors is reproduced in Figure 1. The inner volume of the sensors is filled with dry air at sea level and hermetically sealed.
The longwave radiation flux, L, measured with such a sensor is determined through a relation:
4
v
L = ooT + ~ (1)
where 6oT4 is the detector radiation at the temperature (T) corresponding to its cold junctions, V is the detector output in mv, £(T) is the
I
A
JL
1.0 1.0w
en
z
0
.8 a_ (/)w
a::
.6w
>
r-<l:
.4 _Jw
0: .2 1.25 2.0 3.0 4.0 6.08.010.0f" '
--- I
I
_,,.-" I I 1,,
~
I
\I
I
I I I I •J/
I
I
II/
I
KOZYREV / I/;:J'L£.Y
'Im
II
/ 9000 8000 7000 6000 5000 4000 3000 2000 1000WAVENUMBER
(cm-I )
Figure 1. Relative response of the Kozyrev (curve I) and Eppley (curve II) pyrgeometers as a function of wavelength (after Kozyrev, 1966 and Albrecht et al., 1974). The area under curve III represents the relative amount of radiative energy absorbed by the MgO coating of the Kozyrev instruments.
I
w
-4-detector sensitivity at a given temperature (T). The thermopile sensors1
sensitivity is about .04rnv/Wm-2 while the response time is about 2 to 3 sec (10.63 ).
The temperature of the instrument is monitored by a copper wire spiral with a resistance of approximately 50 ohms attached to the inner side of the sensor body. The temperature of the KRS-5 dome is not
monitored. A photograph and a schematic diagram of the Kozyrev aircraft pyrgeometer are shown in Figures 2 and 3.
The pyrgeometers used on the U.S. aircraft (C-130, DC-6, Sabreliner, Electra, and Convair 990) are manufactured by Eppley Laboratories. These pyrgeometers were first described by Drummond et al (1970). The theory of their operation and the testing of these instruments from an aircraft platform was described by Albrecht et al (1973).
The Eppley pyrgeometer consists of a thermopile sensor, shielded by a KRS-5 hemisphere. An interference filter is vacuum deposited on the inside of the KRS-5 hemisphere to prevent the transmission of radiation at wavelengths less than 3.5 µm. The spectral response of the Eppley sensor is shown in Figure 1. The thermopile is coated with flat black paint. The sensitivity of the sensor is approximately .005mv/Wm-2 with a response time of approximately two seconds.
The longwave radiation, L, is given by the relationship
(2)
where Ts is the thermopile cold junction or sink temperature and Td is the temperature of the KRS-5 hemisphere. The sink temperature Ts is measured with a bead thermistor at the point where the cold junctions are connected to the instrument housing. The dome temperatures for instruments used in GATE were measured using a small bead thermistor
-5-EPPLEY KOZYREV
RESISTANCE~..._.... THERMOMETER (COPPER WIRE) KRS-5 AWMINUM-... HOUSING ASSIVE BRASS HOUSING XTERNAL. CONNECTOR :fHERMISTOR MONITORING DOME TEMPERATURES
_...,.
__
'l7"-3:2:U;.GG~~THERMISTOR MONITORING COLD JUNCTION TEMPERATURE NOT TO SCALEFigure 3. Sketch of the Kozyrev and Eppley pyrgeometers.
I
-7-attached to the inside of the KRS-5 hemisphere. A photograph of both pyrgeometers ana sketches of the instruments are shown in Figures 2 and 3, respectively.
There are two principal differences between the Kozyrev aircraft pyrgeorneter and the Eppley pyrgeometers used on board the U.S. aircraft during GATE:
1. A white magnesium oxide coating on the thermopile surface is used in the Kozyrev sensors to block the shortwave radiation; the Eppley instruments have an interference filter deposited on the inner side of the KRS-5 dome serving the same purpose.
2. The thermopile cold junctions of the Kozyrev sensors are suspended in air inside the sensor and are provided with wire 11whiskers11 for
heat dissipation, wrile the cold junctions of the Eppley instruments are connected to the instrument housing.
III. PYRGEOMETER CALIBRATION PROCEDURE
Both Eppley and Kozyrev pyrgeometers were calibrated using a conical cavity blackbody of large thermal mass. Various target temperatures were obtained by cooling the blackbody to approximately -10°C and
allowing the blackbody to warm as the calibrations were performed. Blackbody temperatures were measured at several points on the surface of the conical aperture using thermocouples attached to this surface. Temperature differences between these points were found to be less than
.2°C.
To determine the sensitivity of the Eppley thermopile, the instru-ment is faced into the blackbody cavity and thermopile output, sink temperature and dome temperature are recorded as a function of time for approximately five minutes at each calibration point. An example of
-8-instrument output and the dome and sink temperatures as a function of time are shown in Figure 4 for the calibration point. Initially the KRS-5 dome is warmer than the sink, however, when the instrument is faced into the blackbody, the dome cools quickly as it loses energy to the cold blackbody while the thermopile sink cools much more slowly since its thermal mass is much greater. After approximately three minutes the dome and sink cool at approximately the same rate. The
instrument output initially decreases rapidly and then stabilizes after approximately three minutes. This behavior is consistent with Eq. (2) which may be written in the form
'j_ = L - 6 o T 4 + k a ( T d4 - T 4 ) . ( 3 )
£ s s
The dominance of the ko(Td4 - Ts4) is apparent in the variation of out-put as a function of time as shown in Figure 4.
To determine£ in Eq. {3) the instrument output, V, at points where Td =Ts is plotted against L - 6oT54 where L in this case is determined by the blackbody temperature. In the results given here, the emissivity of both the blackbody and the thermopile are assumed to be 1.0. A plot of these points is shown in Figure 5.
these points gives
l
E=
178 Wm-2mv-1•The k value in Eq. (3) may then
f . f L T 4 V •
as a unction o - 5 - ; assuming
The slope of the line connecting be determined by plotting ko(Td4
-r
54)the sensitivity determined in the procedure described above. Plots for three of the runs are shown in
Figure 6. The average value of k determined from these plots is k = 4.08.
The same procedure was used for determining the sensitivity of Kozyrev pyrgeometers with the following differences:
w ...
...J >- E
a.. -0 ~~a::
::>. w
~ :I: :::> ~o ... ~ ...a..
~w
~ .6 .7 .8 .9 291 290 289 288 287 286 276 275-9-BLACK BODY TEMP.
20 40 60 80 100 120 140 160 180 200 220
TIME
(sec.)Figure 4. Thermopile output, sink temperature, dome temperature,
and blackbody temperature as a function of time for a
-
> E -I- 0 :::> Q. I-:> 0 -.20 LLI _Ja..
I 0 -.40 0 --1 21 I a:: w :c I- -.60 -120 -100 -80 -60 -40 -20 0 20 [L8e-
O'Ts 4 ] (Wm2 )Figure 5. Calibration data for determination of thermopile
~ ~ r-i ·:~ ; 1:: ~ ., : : / , "r ~ ,.. e
·-5 '- : d ~ Jr l.. n e t pp i e y
,... N I
e
~ -~>
I ..,. ell .-,;b
(.() I ..J 50 40 30 20 10 0 - 10 -20 A -4 -2 • RUN I TBB ~ 265Ke
RUN 11 TBB -::=:- 273 K 6 RUN Ill TBB ~ 277K 12 14 16Figure 6. Calibration data for determination of the dome-sink temperature difference coefficient. k~ in Eq. 2.
-12-2) the sensitivity was determined by the stabilized output of the instrument. Since Td was not known, the third term was omitted from Eq. (3).
IV. GATE FIELD PHASE INTERCOMPARISON DATA
A series of prescheduled intercomparisons between various aircraft was conducted during the GATE Field Phase. From these data, given in Tables I and II, generally good agreement between both shortwave irra-diance components may be seen. The upward shortwave irrairra-diance data from the IL-18M aircraft tend to be approximately 15% larger than the corresponding U.S. aircraft. It is encouraging that this trait appears to be consistent at all altitudes. Since a discrepancy of the same magnitude does not exist for the K+ measurements, one is tempted to suggest that the cosine response of the two instruments may be different and would account for the differences in the observations. Such a
tentative conclusion is supported by results reported previously by Hanson (1974).
The largest inconsistency noted from the intercomparison data occurs between the measurements of the downward infrared component, LW+. One readily sees from the data in Tables I and II that the inconsistency
is altitude dependent. With these data as a guide, the authors examined the probable physical cause(s) of the observed inconsistency. The
possible causes are listed below:
1. differences in spectral characteristics of dome and thermopile coating
2. solar heating of the KRS-5 dome
3. adequacy of ventilation to dissipate solar heating 4. solar heating of the thermopile
Alt. 20K !OK SK .6K TIME From To 1058Z 1103Z 1112 1115 1122 1126 1133 1135 1202 1208 1214 1218 1224 1228 1235 1239 1243 1248 1256 1301 1306 '"1311 1315 1320 1325 1330 1341 1401 1413 1424 1434 1349 1409 1418 1429 1439 U· WATT/,/-C-130 175 175 175 176 311 307 307 307 307 311 312 312 311 426 424 420 428 432 IL-18M Before After Correction 280 i.79 265 170 265 170 284 181 379 302 385 312 376 299 382 309 382 308 381 305 384 309 385 309 382 306 461 407 445 387 445 389 441 384 451 398 RATIO C-130 IL-lBM Before After Correction .625 .98 . 660 1. 03 .661 1.03 .619 .97 .820 1. 03 .799 .98 .816 1.03 . 804 . 99 .804 .997 .817 1.02 . 813 1.005 .811 1.005 .814 1.016 .924 1.05 .953 1.10 . 945 1.08 . 970 1.11 .957 1.08 K+ WATT/~ RATIO L+ WATT/M2 C-130 IL·lSM C-130 C-130 IL-IBM 984 946 1009 1037 1014 974 1042 1064 1012 1032 995 1032 1033 1042 1047 1064 1061 1071 1082 1072 1082 1078 1082 1071 1089 1078 907 883 896 84S 817 928 866 884 818 824
JI:1BM Before After .970 .971 .968 .974 .981 .964 . '":91 .9tl4 .990 1.01 1. 00 . 977 1.01 .976 1.02 1.01 1.03 .992 314 321 321 322 390 390 398 390 390 399 396 400 399 4S7 431 431 433 440 Correction 323 322 322 322 296 298 298 298 390 394 392 396 394 398 387 391 392 396 383 393 385 390 386 391 385 390 437 420 424 422 427 447 427 431 429 434
TABLE I: INTERCOMPARISON DATA FROM USSR IL-18M and US C-130 AIRCRAFT, 24 June 1974.
RATIO r-130 IL-18M Before After Correction • 972 1.062 . 998 1. 078 .998 1.078 . 998 1. 081 1. 00 . 990 . 996 . 985 1.01 1.000 1.01 .999 .998 .985 1.03 1.016 1. 03 1. 016 1. 04 1.023 1.03 1.023 I.OS 1.03 1. 02 1.03 1. 03 1.022 1.010 1.000 1.010 1. 014 RATIO C-130 IL-ISM C-130 IL-18M 161 193 168 198 161 188 158 202 140 168 140 162 136 158 133 158 140 161 137 161 136 160 138 153 131 153 92 33
,.
·~ :-114 .!l 41 .833 .848 .855 • 779 .833 .862 .859 .833 .870 .849 .852 .904 .858 .s::5 .S~5 . s.:s .831 .814 I __, w Il• K• Lt K+
TI~E WATTtM2 RATIO WATTJM2 RATIO WATT/M2 RATIO WATI/M2 RATIO
Alt. Fro"' To Sabre IL-18M Sabre Sabre [L-18M Sabre Sabre ll-18M Sabre Sabre Il-lBM Sabre
TL-18R IL-18M rr::mf ~
Before After Before After Before After Before After
Correct; on Correct;on Correction Correction
20K 1248 30 154 224 150 .69 1.027 1202 1155 1.04 367 309 336 1.19 1. 093 111 127 .87 1254 15 lOK 1315 .. 279 333 300 .84 .930 1110 1080 1.03 395 378 406 1.04 .974 85 102 .83 1319 I --' ~ I SK 1335 15 340 378 345 .90 .986 1037 1002 1.03 388 403 381 .96 1.018 60 72 .83 1339 45 3K 1401 352 392 367 .90 .959 1003 960 1.04 387 409 389 .95 .995 44 53 .83 1403 45
-15-5. placement of temperature transducers within instrument 6. calibracion procedures.
The measurements surrmarized in the following sections suggest which of the aforementioned causes are most probable.
-16-V. POST GATE INTERCOMPARISON DATA
Table III summarizes the results of a series of measurements made on 4 November 1975 in Fort Collins, Colorado. This series of inter-comparison measurements between the Eppley and the Kozyrev instruments were conducted under varying degrees of solar illumination and ventila-tion of the instruments. Ventilaventila-tion was supplied by exposing the appropriate instrument to a stream of compressed air. The instruments were shaded from direct solar illumination using small circular discs. The sky was virtually cloud free and the data were collected from 1403 LST to 1716 LST. The data were reduced using calibration constants derived as explained in Section III and then applying Eqs. (1) and (2)
from Section II.
At 1716 LST an infrared bolometer (2° field of view) with a spectral bandpass of 1.8 to 26µm was used to measure independently the infrared radiance at a few zenith angles. Measurements were made after sunset, thereby eliminating any possible solar contamination. These radiance data are shown in Figure 7. An integration over 2n steradians neglecting
. 1 -2
any azimuthal variation yields a downward irrad1ance va ue of 247 Wm . In addition to the data noted above, the OOZ radiosonde data from Denver, Colorado were used in a computation of LW~ at the surface. The
computation technique described by Cox (1973) yielded an LW~ value of
263 Wm-2.
VI. ANALYSIS OF INTERCOMPARISON DATA
The easiest item to assess in the list of possible causes given in Section IV is the first one. The possible effects of both
instruments' differences in spectral characteristics are shown in Fig. 1. The area under curve III represents the relative amount of radiative
LOCAL KOZYREV EPPLEY LWt Wm-2 INCOMING
TIME LWt Wm -2 SOLAR
4 4 IR RAD I ANCt:
Before After Assume Td-Ts=O Use Td - Ts -2
Correction in Eq. (2) Wm 1423 409 339 Wm-2 326 Wm-2 230 Wm-2 370-384 Wm -2 1430 340 247 Shaded 263 Shaded 274 370 1436 403 327 264 279 350 1441 349 253 Shaded 322 205 336 1446 378 298 308 225 332 1458 394 321 275 Ventilated 245 285 1505 345 278 Ventilated 310 202 260 I ~ -...J 1512 349 275 Ventilated 309 214 242 I and Shaded 1519 399 330 272 Ventilated 269 232 and Shaded 1716 349 280 281 Night 264 0
Bolometer observation at 1716 LST (1.8-26um) LW-t = 247 wm-2 Computation using Denver OOZ sounding LWt = 263 Wm- 2
160
140
~ I ~120
en
N IE
3:
100 .,._... IH
--' co I80
60
10
20
30
40
50
60
70
80
90
8
ZENITH ANGLE
-19-energy absorbed by the
;:go
coatinq of the Kozyrev in<,fxurriE~nL It reachesabout 23% of the incident flux in the region of 2. 5 11m
Using the spectral distribution of direct solar en<~nJy (Kondratyev,
1969) one can calculate the possible overestimate of IR flux ~Y the
Kozyrev instrument under clear sky conditions as a function of hciqht. For the
GATE
aircraft measurements, we can assume that e (!) = 0°. Thus, the maximum overestimate due to differences in spectral characteristics of the filters is as follows:Height
km Flux overestimate by Kozyrev pyrgeometer~
Wm- 2
---~---0. 5 10
3 13
6 16
Table IV. Possible flux overestimate due to spectral sensitivity differences.
The data in Table III may be used to gain some insight into items 2 to 4 listed as possible causes of the discrepancies in Section IV. Assuming that the actual LWf value was constant through the observing period, one notes an obvious dependence upon incident solar energy by comparing shaded and unshaded values of LWf from each instrument.
Furthermore~ in the case of the Eppley instrument. the attempt to correct
for this effect by the dome-sink temperature difference resulted in an overcor.ection. This may be explained by the fact that the dome
-20-temperature is measured at one point on the dome by a thermistor; lacking ventilation, temperature gradients appear on the dome and the single temperature transducer is not representative of the dome temperature.
The Eppley data from 1519 LST (ventilated and shaded) and 1716 LST (night) agree remarkably well with the calculated value (observed 269
-2 -2)
and 264 Wm vs calculated 263 Wm and with the independent bolometer observation for the spectral bandpass 1.8 to 26µm (247 Wm-2).
Taking the Kozyrev shaded, ventilated and shaded, and ventilated data, one notes that all three cases yield LW} values in the interval 340-349 Wm-2; the nighttime value was also 349 Wm-2. The fact that shading the instrument yields nearly the same effect as ventilating the instrument strongly suggests that the solar effect in still air is one of heating the KRS-5 dome rather than solar energy being absorbed by the thermopile itself. It therefore appears that even though solar heating of the dome is important in still air, even moderate ventilation will significantly suppress this effect. With the ventilation offered by the slipstream of an aircraft, this effect should be virtually eliminated.
The differences in the placement of temperature transducers within the instrument may also account partially for the differences in the measurements. When making measurements with the Kozyrev pyrgeometer, it
is assumed that the cold junctions are at the same temperature as the instrument housing. This assumption may result in erroneous measurements since the cold junctions and the housing are not in direct thermal con-tact. In the case of the Eppley Instrument, the cold junctions are attached to the sink of the instrument and the temperature measurement is made at the point where this contact is made.
-21-To illustrate the effect that this difference might have on the measurements, it may be noted that when the pyrgeometer is viewing the downward irradiance the thermopile surface is cooler than the body of the instrument (thermopile output is negative). Consequently, one would assume that the cold junction temperatures would be less than or equal to the instrument temperatures. The more negative the output (the cooler the thermopile surface) the greater the difference that would be
ex-pected between the cold junctions and the instrument housing temperature. Hence, if the housing temperature is used to obtain L, the results may be erroneously high when the thermopile output is negative. A tempera-ture difference of 2°C between the cold junction temperatempera-ture and the housing temperature would cause an error of approximately 10 Wm-2. A similar effect might also be expected when measuring the upward irradiance although in this case the thermopile is warmer than the cold junctions.
Differences in the instrument outputs may also be due to the calibration procedure. When calibrating the Kozyrev pyrgeometer the dome temperature is not monitored. Consequently, this uncertainty may affect the derived sensitivity. For example, if the thermopile output and sink temperature values which stabilize at the end of the calibra-tion run (c.f. Fig. 6) are used, the derived sensitivity would be much larger; in the case of the Eppley instrument using the data given in Figure 4, the sensitivity determined in this way would be 60% greater than the actual sensitivity determined when Td
=
Ts.In terms of the measurement of the downward irradiance (thermopile output is negative) the larger sensitivity would result in an erroneously large measured irradiance as shown by Eq. (1). For example, if the
-22-using the larger sensitivity, the measured value would be increased by approximately 40 Wm-2. Again a similar effect would also occur when measuring the upward irradiance. In this case, however, the thermopile output will be positive so that an overestimate in the sensitivity may result in an erroneously low measurement, particularly when the thermo-pile output is large. However, when comparing ratios of LWt measure-ments, the differences may not be as significant since the absolute values of LWt may be significantly greater than LW~ at high levels.
Keeping these considerations in mind and assuming that the thermal properties of KRS-5 domes in both Kozyrev and Eppley pyrgeometers are basically the same, an attempt was made to recalculate the Kozyrev pyrgeometer sensitivity using the same approach as that used for the Eppley Instruments' calibration. It was assumed that the equilibrium point Td
=
T5 (see Sec. III) is reached by the Kozyrev pyrgeometer with the time lag equal to that of the Eppley one. The instrument sensitivity was then determined according to the technique stated in Section III.It was found out that the sensitivity calculated in this way is 36% lower than obtained m·iginally.
The next attempt was to try to determine the possible error due to temperature differences between the instrument housing and the thermopile cold junctions. For this purpose the Kozyrev pyrgeometer was warmed up or cooled down and then faced into the blackbody cavity, the blackbody itself being at room temperature. The instrument housing temperature and output were recorded till the instrument temperature practically reached the blackbody temperature. Then the IR flux (presumably equal to the blackbody irradiance) was calculated using the new sensitivity value. The results of these calculations are shown in Figure 8.
lJJ .660
a::
450 :::>~
J
eHOT (') .640a:
0 ,... lJJ N Ia.
~ (')3
E
BLACK BODY
lJJ .620 ~ I~
425IRRADIANCE
>-
• I\)3
...._.,c
I 0 .600 :::J r·) (,..) CD I i ~u
<( .580 _J 400m
.560 -20 0 20 40 60TEMPERATURE {DEGREES C)
-24-It may be seen that the calculated IR flux is significantly higher than that emitted by the blackbody. It is interesting to note the quick drop of calculated flux in case of the warmed-up instrument, which then gradually rises over the level of blackbody irradiance. One can inter-pret it as the influence of dome, which quickly cools off against the cold blackbody and then gradually comes into thermal equilibrium with the slowly cooling instrument itself.
Assuming that under stable conditions the discrepancy between the calculated flux and the actual blackbody irradiance is merely an instru-ment offset, the data in Fig. 8 indicate that this offset is 47 Wm-2.
With the new sensitivity data and the offset noted above, the Kozyrev pyrgeometers data were recalculated for both GATE (Dakar) and post-GATE (Fort Collins) intercomparisons. The results of such re-calculations are given in Tables I, II~ and III under the heading 11after correction".
One can readily see from this independent comparison that the proposed correction scheme yields very good agreement for the inter-comparisons. Values are within 10% of one another for GATE inflight intercomparisons and to within at least 5% for post-GATE ground intercomparison.
At the same time, the new values for the Kozyrev instruments obtained under the assumption that Td =Ts, are close to those ob-tained with the Eppley. This suggests that although the data should be corrected for the dome-sink temperature difference, the slipstream of the aircraft does provide (as stated above) sufficient ventilation to neglect such an effect.
-25-VII. CONCLUDING REMARKS
In the introduction, three questions which this report proposed to
answer were explicitly stated. In this section we shall restate these questions and offer our best answers to them.
1) How reliable are preliminary aircraft hemispheric radiation data from the GATE?
Frnm the intercomparison dRta gathered during GATE, K+ shows very good agreement. In general, Kt values made by U.S. aircraft are sys-tematically smaller by approximately 15%. This difference is most likely due to the different cosine responses of the instruments.
Most intercomparison data show acceptable agreement between vations of LWt, however, there are dramatic differences between obser-vations of LW~. The preliminary data of LW+ from the USSR aircraft
appear too large and we suggest that these data not be used until an appropriate correction is applied.
2) What are the physical reasons for the observed discrepancies
between the LW~ data of the USSR and the USA?
There are apparently three separate reasons which may account for the differences in the observations of LW~. First, in the USSR
instru-ment, the KRS-5 dome and sink temperatures are assumed equal. Although the laboratory data collected in this study indicates this to be a
minor problem, it may still account for some of the observed discrepancy. Second, the dome-sink temperature difference during calibration may introduce an error into the determination of the sensitivity factor used in the data reduction equation. It is important that the sensi-tivity factor be resolved from data for which the equivalence of dome and sink temperatures is assured.
-26-Third, in the Kozyrev instrument, the temperature used in the
ooT
4 term in the data reduction is measured on the body of theinstru-ment. In fact, the temperature in the reduction equation is the thermo-pile cold junction temperature. If these two temperatures are signifi-cantly different, as seems likely under conditions of low LW~ values,
significant overestimates of LW~ would result.
3) What steps may be taken to bring the two data sets into agree-ment?
On the basis of research presented in this paper, the authors suggest that the values of the IL-18M IR actinometric measurements be reduced according to the following procedure:
l) the sensitivity value be lowered by 36% for both upward and downward looking pyrgeometers;
2) measurement data be reduced according to Eq. (1) using the new sensitivity values;
3) the values obtained in 2) be further reduced by 47 Wm-2; 4) the new values of IR fluxes be presented to the RSDC at MGO,
Leningrad. However, in agreement with recorrmendations of Subgroup 3 of the Informal Planning Meeting for the GATE Radiative Subprogram (Leningrad, USSR, June 1975), the original data of the IL-18M actinometric measurements be preserved by the RSDC.
-27-· ACKNOWLEDGEMENTS:
The research reported in this paper has been supported by the
Global Atmospheric Research Program, National Science Foundation, under
Grant Numbers OCD 72-01681 A03 and OCD 74-21678. The authors wish to express their ~incere gratitude to the NOAA GATE Project Offic~, th2
USSR Hydrometeorological Service, to Prof. E. Borisenkov, Director of the Main Geophysical Observatory in Leningrad, and to Member-Correspon-dent of the USSR Academy of Sciences K.Ya. Kondratyev for making possible the post-GATE joint resea~ch activities reported in this paper.
-28-REFERENCES
Albrecht, B., M. Poellot, and S.K. Cox, 1974: Pyrgeometer Measurements from Aircraft. Rev. Sci. Instrum., 45, No. 1, pp. 33-38.
Cox, S.K., 1973: Infrared Heating Calculations with a Water Vapor
Pressure Broadened Continuum. Q.J. Roy. Meteor. Soc., 99, No. 422,
pp. 669-679.
Drummond, A.J., W.J. Scholes and J.H. Brown, 1970: A New Approach to the Measurement of Terrestrial Longwave Radiation. WMO Tech. Note, No. 104, pp. 383-387.
Faraponova, G.P., 1971: Tests of Radiation Thermoelements for Radiation Flux Measurements in the Atmosphere. Proceedings of the Sixth International Symposium on Actinometry and Atmospheric Optics, June 1966, Tartu, pp. 193-203.
Faraponova, G.P., and R.G. Timanovskaya, 1971: Field Tests of Radiation Thermoelements. Proceedings of the Sixth International Symposium on Actinometry and Atmospheric Optics, June 1966, Tartu, pp.
204-210.
Hanson, K.J., 1974: Radiation Sensor Comparisons During the GATE International Sea Trials (GIST), Bulletin of the AMS, 55, No. 4,
pp. 297-304. ~
Kozyrev, B.P., 1971: A Compensated Thermoelectric Net Radiometer with Whitened and Bright Detecting Surfaces Protected from Air Currents
by KRS-5 Hemispheres. Proceedings of the Sixth International
Symposium on Actinometry and Atmospheric Optics, June 1966, Tartu,
pp. 168-176.
Robinson, N., 1966: Solar Radiation, Elsevier Publishing Company, 1347 pp.
Radiation Characteri s ti c_s _of the Atmosphere and Und_~rlyi ng Surface.
--·-1.
! J.. ;'t•:. ·r ·:i~·s .\cr·t ',:,1,11: ~I. ! P. 1 ~ ' ..'... -· i ~ . (.: ~ ,.\ . ..:.. SH:: : CSU-ATSP- 255 __ .. T _ _ _ Ll. --~-~----.-.~---, , November 1976. . ·-1--;- -- ._ .. _ ~ .. ·-· ·-~·--·--,________ _
. 6 . h-'"' 1=·.nalysis of the GATE P1ircra-ft Pyrqeometer Ir.strumentation• . \ .~;- ·~\---·----· - - - · - - - · - - - ---~~~::-.--.~·-:-.~ ·.)t •'. .u~ 1.:.1t1 :ir. F,· ~'c. B. A 1 brecht, S. Cox, and M. Prokofyev ! ~:,). CSU-ATSP.255 .
---.--~-~·---·----·---·---· ~-...---...c·-·--·---·-·--··----·---·-~~
---, /lcr: ·:;· .. ~~ t~·:, ·" .'J .. :-1 • "· '. -, : .:.~.·'- j l-:J. ilr1;,o.-. '. 1.1:;-: · ""uti< i_nit .'-.).
Dept. of Atmospheric Science Main Geophysical Observatory ~ ---·--Colorado State University Dept. of Radiation Studies 1 :. ' ,; :; •• 1·~.:
Fort Collins, Colorado 80523 Leningrad '. OCD 72-01681 A03
U.S.A.
----··---..
U.S.S.R. : OCD 74-21678·-·---~
--
~------
---~-·-_,,. ·--· --··-·---·---·-
---
~ -;--~---·,·' --
---.~--:-.~--~~~~!Global Atmospheric Research Prcqram USSR Hydrometeorologicar ·:u. ·' l
- I
National Science Foundation Service ! 1
Washington, D.
c.
Main Geophysica·1 Oserva'.fory ··----.. --- ,GATE Project Office, NOAA USA. Leningrad, USSR. !
I
5. 5 .. ~ ·~~~~-::-~· .• , ,;' ~.-.. ~-·---·- -- --- -'- -- ---- -·-. -· -- -· ---~--- ---~----J---·----
--·---·-1
Th-is is the seco.nd joint _pub l i ca.-t ion by sci en tis ts at CSU and MGO in a series devoted
I
to the analysis of GATE Radiation Subprogram ~esults. _ ~
6. . •: :--~--~-:~::~·----· -·- - . -·---- -- ·--- - - ----~ ---- ---· --- ----···--- - - · - -- - I
Significant differer.ces iP US alld USSR aircraft measurements of hemispherical
. infrared irradiance were notecJ during GATE in-flight intercomparisons. In specific instances the downward irradiance measurea by the USSR instrument (a Kozyrev pyrgeometer) was as much as 1.5 times greater than the i~radiance measured with the US instrument (an
Eppley pyrgeometer). A post-Gft.TE intercomp3r·ison at Colorado State University verified these differences; the pyrgeometer measurements were compared with independent
measurements obtained with an infrared bolometer and with a radiative transfer
.calculation. The differences noted during GATE and post-GATE intercomparisons may be ·attributed to differences in calibration techniques and the accurate determination of the temperature of the instruments' thermopile cold junctions. When corrections based ·upon this analysis were applied to the USSR data, the maximum intercomparison
differences were less than 5%.
---Infrared Radiation Pyrgeomet.er
Aircraft Radiation Measurements
·('; ,·.
l
I