The influence of age, gender, insulin dose, BMI,
and blood pressure on metabolic control in
young patients with type 1 diabetes
Karin Akesson, Lena Hanberger and Ulf Samuelsson
Linköping University Post Print
N.B.: When citing this work, cite the original article.
Original Publication:
Karin Akesson, Lena Hanberger and Ulf Samuelsson, The influence of age, gender, insulin dose, BMI, and blood pressure on metabolic control in young patients with type 1 diabetes, 2015, Pediatric Diabetes, (16), 8, 581-586.
http://dx.doi.org/10.1111/pedi.12219 Copyright: Wiley: 12 months
http://eu.wiley.com/WileyCDA/
Postprint available at: Linköping University Electronic Press http://urn.kb.se/resolve?urn=urn:nbn:se:liu:diva-123060
in young patients with type 1 diabetes.
Short running title: Influences on HbA1c in type 1 diabetes patients Karin Åkesson 1, 2, MD, PhD
Lena Hanberger 3 RN, PhD
Ulf Samuelsson 3 MD, PhD, Ass Prof
1 Department of Pediatrics, Ryhov County Hospital, Jönköping, Sweden
2 Futurum – academy for Health and Care, Jönköping County Council and Jönköping Academy for improvement of health and welfare, Jönköping University
3 Department of Clinical and Experimental Medicine, Division of Pediatrics and Diabetes. Research Center, Linköping University Hospital, Linköping.
Corresponding author: Karin Åkesson
Futurum – academy for Health and Care 551 85 Jönköping
Phone +46 36 32 22 20, Fax +46 36 32 22 34 Word count: Abstract 242, text 2221. Tables: 4
Abstract
Objective: To explore the relationship between certain clinical variables and metabolic control, HbA1c, in a large unselected population of young patients with T1D. To study whether HbA1c at diagnosis can predict later metabolic control and to evaluate gender differences in metabolic control.
Research Design and Methods: Data from 4508 boys and 3682 girls registered in the Swedish pediatric diabetes quality registry, SWEDIABKIDS, during 2000–2010 was used. Both linear and logistic regression analyses were performed.
Results: HbA1c at diagnosis correlated to HbA1c at follow-up (p<0.001). There was a clear gender difference regarding HbA1c. Girls had higher values both at diagnosis and at follow-up (p<0.001). Girls also had lower BMI and pH at diagnosis than boys (p<0.001). In contrast, girls with the highest BMI at follow-up had higher mean HbA1c at follow- up in 2010 (p<0.001). Having a mother and/or a father with high BMI implied higher
HbA1c at diagnosis (p<0.003).
Conclusions: HbA1c at diagnosis seems to predict metabolic control years later. There is a gender difference at diagnosis as female patients have higher HbA1c than males at diagnosis as well as at follow up. As metabolic control is very much correlated to complications there is a need to early identify patients at risk of poor metabolic control. Even though we do not know whether a high HbA1c level is mainly due to severity of the disease or to behavioral patterns, new ways to treat and support these children, especially girls, are needed.
Introduction
Type 1 diabetes is the second most common chronic disease among children and adolescents in Sweden today, and its incidence has been increasing during the last decades (1, 2). Several studies have shown that higher glycated hemoglobin (HbA1c) level is correlated with a larger risk of complications later in life. (3-5). Both treatment-related and patient-treatment-related factors affect metabolic control. Many studies show that a longer duration of disease is correlated with higher HbA1c (6-9). A gender-dependent difference in metabolic control has also been shown. Worse glycemic control (10) and a higher incidence of diabetic ketoacidosis ph < 7.3 (DKA), dyslipidemia and height problems in female patients are described in follow-up studies in western and eastern countries (11, 12). Hochhauser et al showed that girls in the 6-12 age group presented with higher HbA1c levels compared with girls of other age groups and with boys (13). HbA1c during the initial years after diagnosis has been shown to be correlated with subsequent metabolic control. This was seen even among small children (14). Viswanathan et al showed that HbA1c levels at onset might predict future metabolic control (15).
During recent decades, insulin treatment has improved and become more intensive. This has enabled us to individualize treatment. Insulin pumps are more common (16, 17), and patients are better able to self-monitor blood glucose (18, 19). The correlation between intensive diabetes treatment and lower risk of complications has been clearly described (20, 21). Yet despite modern insulin treatment, many children and adolescents with type 1 diabetes do not achieve adequate HbA1c levels (22), which puts them at risk of short-term (23) and late complications (3, 5). Both treatment-related and patient-related factors affect metabolic control. It is known that age, gender, duration of disease, number and frequency of insulin injections, (24) and frequency of self-monitoring of blood glucose (SMBG) are predictive factors (25). Furthermore, center-specific factors such as a clear, low treatment target HbA1c value predict metabolic control (26) (27).
In Sweden, as well as in other countries, outpatient attendance data are registered in quality registries (https//www.ndr.nu/ndr2/). This vast amount of data provides an opportunity to study aspects such as correlations between clinical variables and
complications of the disease, and to identify vulnerable groups of patients. To increase our knowledge, we have to analyze these data to improve the quality of diabetes care. Being able, as early as at diagnosis, to identify variables that can predict later outcome would help to better individualize treatment. By identifying patterns or groups of patients that need more intensive treatment, we could optimize the treatment of each patient. The aim of this study was to explore the relationship between HbA1c at diagnosis, certain clinical variables and later metabolic control in a large unselected population of young patients.
Methods
Outpatient attendance data from all Swedish pediatric diabetes centers (n=43) are registered in the Swedish pediatric diabetes quality registry, SWEDIABKIDS
(Samuelsson, 2009) established in 2000. In Sweden, pediatric clinics treat all children and adolescents aged 0 – 18 years with diabetes from defined geographic areas. Thus the registry includes data on almost all (99%) children and adolescents with diabetes in Sweden. For this study, data was obtained from SWEDIABKIDS from 2000 and for each year up to 2010. There is clinical data from both diagnosis and follow-up. According to Swedish national guidelines, each child visits the pediatric outpatient diabetes clinic about 4 times each year. When data was collected from SWEDIABKIDS in February 2011, the registry had information from 13,034 patients (7,018 boys and 6,014 girls; for 2 children, gender was not reported). Ninety-nine percent of the children were diagnosed between 1986 and 2010. Age at onset varied between 0 and 18 years of age. At age 18– 19 the patients are transferred to a diabetes team at an internal medicine clinic. In this study data from 4508 boys and 3682 girls that were diagnosed before 2011 and still were in the Swediabkids registry was used.
All methods used in Sweden are standardized through EQUALIS (External Quality Assurance in Laboratory Medicine in Sweden). The data on HbA1c obtained from SWEDIABKIDS were derived from capillary blood samples measured with the Bayer/Siemens DCA-2000 analyzer or by local laboratory methods (14).
SWEDIABKIDS is financially supported by the Swedish Association of Local
Authorities and Regions, SALAR, which represents the governmental, professional and employer-related interests of Sweden’s municipalities, county councils and regions (URL: http://english.skl.se/ [accessed August 2011]). The registry has the status of a
national quality registry, and the families/patients are informed about the register before consenting to be included.
Statistical analysis
SPSS 18.0 (SPSS Inc., Chicago, IL, USA) was used for the analyses. Student’s t-test and one-way analysis of variance (Anova) were used. Linear and logistic regression analyses were used. The results are expressed as mean ± SD.
As seen on the registry´s homepage (https//www.ndr.nu/ndr2/) the demographic data is very similar over the last years and as the results do not differ significantly between different years, most of the results reported are from results for 2010. The certainty of the registry has improved for each year. The coverage of data in the registry is highest in 2010. Only children diagnosed with type 1 diabetes are included in this study.
The national guidelines in Sweden state that each patient´s HbA1c value should be under 57 mmol/mol. In this study the mean HbA1c value in 2010 was divided into three groups (HbA1c < 7.4 % (57mmol/mol), HbA1c 7.4 – 9.3 % (57 – 78 mmol/mol), HbA1c > 9.3 % (78 mmol/mol) and thereafter compared with some clinical parameters in 2010 and at onset, respectively.
Using data from 2010 in a linear regression analysis, HbA1c and BMI were used as dependent variables. In the logistic regression analysis, one group with HbA1c < 7.4 % (57mmol/mol) (n=1239), and one group with > 9.3 % (78 mmol/mol) (n=444) were compared. Children with BMI-SDS <25th percentile (n=1017) were compared with children with BMI-SDS >75th percentile (n=1073).
The BMI-SDS value for 2010 was divided in quartiles and thereafter compared with clinical parameters for the same year and at onset.
Results
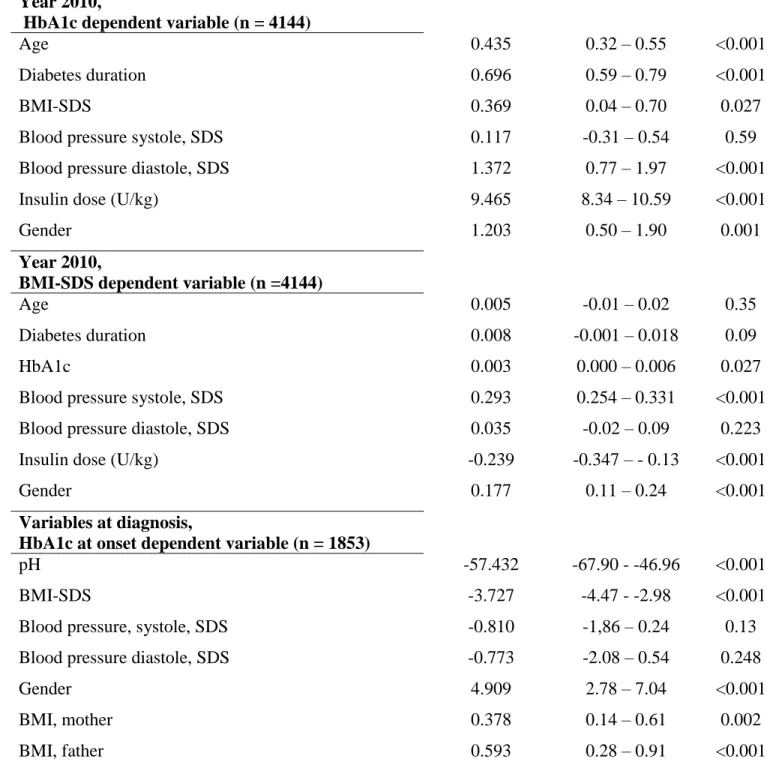
Linear regression
Using data from 2010 with HbA1c as the dependent variable linear regression analysis showed that almost all variables influenced the HbA1c value (Table 1). Female patients had a higher HbA1c level than male patients. When using BMI-SDS as dependent
variable in the model, age and diabetes duration did not influence BMI-SDS significantly (Table 1). A similar pattern was seen when analyzing the same clinical variables for the years 2000 (n=902), 2005 (n=2214) and 2007 (n=2306), with the exception of BMI-SDS. When only including children with diabetes, duration > 5 years and using data from 2010 (n = 1,725), the pattern was the same both for HbA1c and BMI-SDS.
The last part of table 1 shows clinical data at diagnosis and the influence of the variables on HbA1c at diagnosis. Having a mother and/or a father with high BMI was associated with higher HbA1c, whereas it was the opposite pattern for the patient, i.e. a low BMI at diagnosis was associated with high HbA1c. Girls had higher HbA1c and lower pH and BMI at diagnosis than boys.
Logistic regression
In the logistic regression model with the two groups of patients (HbA1c < 7.4%
(57mmol/mol) and HbA1c > 9.3% (78 mmol/mol)), including the clinical parameters, the results showed that HbA1c was positively associated with longer diabetes duration and higher age. It was also shown that girls had an increased risk of having high HbA1c (Table 2).
Children with BMI-SDS < 25 percentile were compared with children with BMI-SDS > 75 percentile. Girls had a higher risk for BMI-SDS >75 percentile (OR = 1.65). Patients with BMI-SDS > 75 percentile reported a lower insulin U/kg than children with a low BMI-SDS (OR = 0.69) (Table 3).
Other analysis
Clinical parameters in 2010 and at onset were compared in children and adolescents with different levels of yearly mean HbA1c values (Table 2). Children with a high mean HbA1c value in 2010 also had high HbA1c at onset. When comparing these parameters in 2009, 2008 and 2007, the results were similar to those in 2010. The difference in HbA1c level was even more obvious as children with high HbA1c in 2007 and 2008 had an even higher HbA1c at onset compared with those with HbA1c above 9.3 % (78 mmol/mol) in 2010 only (For 2007 HbA1c at onset was 11.5 % (102mmol/mol) for children with high HbA1c, n=522). There were no gender differences in these analyses. The BMI-SDS value for 2010 was divided in quartiles and thereafter compared with clinical parameters for the same year and at onset. Children in the highest quartile (>75 percentile) had higher blood pressure than children in the lowest group (< 25 percentile); 0.19 and -0.43, respectively, p<0.001. Boys in all BMI quartiles had the same pattern, but girls in the highest BMI group had a higher mean HbA1c in 2010 than girls in the lowest group; 8.2 % (66 mmol/mol) compared with 7.8 % (62 mmol/mol), p<0.001. Girls in the highest BMI group also had longer diabetes duration than girls in the lowest; 5.9 years and 4.4 years, respectively (p<0.001).
Boys in the highest HbA1c group > 9.3 % (78 mmol/mol)) had lower BMI than boys in the lower HbA1c groups. In contrast, girls in the highest HbA1c group also had higher BMI than girls in the lower HbA1c groups. Both girls and boys in the highest HbA1c group reported a higher insulin dose than patients in the lower HbA1c groups.
Discussion
This large study including an unselected patient cohort shows that girls have a higher HbA1c level than boys at diagnosis of type 1 diabetes. It also shows that girls have a lower BMI and a lower pH than boys at diagnosis. As the higher HbA1c is correlated to a decrease in BMI and pH these findings indicate that the reason for higher HbA1c in girls at diagnosis is not due to their better tolerating high blood sugar. The girls present with more disease symptoms when they are diagnosed with type 1 diabetes. As yet, the reason for this is not understood, but the reason could be that we are less observant of symptoms in girls than in boys. Furthermore, the study shows that HbA1c at diagnosis predicts the level of metabolic control at follow-up years after diagnosis. This might be because, in the early stages, parents who are unaware that their child is becoming sick are not aware when they have poor metabolic control either. Children with a low year-mean HbA1c in 2010 had lower HbA1c at diagnosis than children with a high mean value in 2010. In many cases, patients at high risk of later complications can be identified at diagnosis. The study also shows that poor metabolic control persists over the years and that the initial years after diagnosis clearly predict later metabolic control. It is therefore very important never to let HbA1c increase, and if this should happen, intensive help should be offered to patients and their families to restore HbA1c to a reasonable level. Teenagers with poor metabolic control might not feel any incentive to improve their HbA1c as many
complications of poor metabolic control are not seen until years later. However, families with structured daily routines might find it easier to achieve and retain good metabolic control (Table 4).
Another finding in this study is that having a mother and/or father with high BMI is related to higher HbA1c at diagnosis. This, to our knowledge, has not previously been shown, but might be due to socioeconomic factors.
Children with a high BMI during follow-up (>75 percentile) had higher blood pressure (systole) and a lower insulin dose (U/kg) (reported by the patient) than children with low BMI (<25 percentile). Female gender was related to high BMI. This might be due to higher estrogen levels in girls, which give an insulin resistance and therefore greater difficulties in achieving good metabolic control. As the combination of obesity and type 1 diabetes puts girls at a higher risk of later complications, it is important to identify the reason for this gender difference and to find ways to avoid a high BMI in girls. Health care providers as well as the patients themselves might be afraid to give adequate insulin doses according to the patient’s weight and this gives the patients high HbA1c levels which further increase the risk of later complications.
Higher blood pressure was found among girls with high BMI. The girls in the highest BMI group also had higher mean HbA1c and a longer duration at follow-up than girls in the lowest BMI group (5.9 v. 4.4 years and 8.2 % (66 mmol/mol) v. 7.8 % (62
mmol/mol), respectively; p<0.001 each). This was not seen in boys. As risk factors for later complications correlate, we need to find new ways to help patients with type 1 diabetes, particularly females, to lower their HbA1c and their weight.
The risk of later metabolic control and thereby the risk of late complications seems, in many cases, to be predictable at diagnosis. Quality registers offer a possibility to increase our knowledge about the gender difference observed at both diagnosis and follow-up. Better early identification of patients at risk of poor metabolic control who therefore risk acute and later complications is important so that we can treat these patients intensively from the start to help them achieve and maintain good metabolic control.
Lindblad, Auste Pundziute-Lyckå, Eva Örtqvist, Lars Skogsberg. Thanks to statistician John Carstensen for statistical advice. This study was supported by the Östergötland County Council and Futurum, the academy for Health and Care, Jönköping County Council.
References:
1. Berhan Y, Waernbaum I, Lind T, Mollsten A, Dahlquist G. Thirty years of prospective nationwide incidence of childhood type 1 diabetes: the accelerating increase by time tends to level off in Sweden. Diabetes. 2011 Feb;60(2):577-81.
2. Dahlquist GG, Nystrom L, Patterson CC. Incidence of type 1 diabetes in Sweden among individuals aged 0-34 years, 1983-2007: an analysis of time trends. Diabetes Care. 2011 Aug;34(8):1754-9.
3. Nordwall M, Arnqvist HJ, Bojestig M, Ludvigsson J. Good glycemic control remains crucial in prevention of late diabetic complications--the Linkoping Diabetes Complications Study. Pediatr Diabetes. 2009 May;10(3):168-76.
4. Eeg-Olofsson K, Cederholm J, Nilsson PM, Zethelius B, Svensson AM,
Gudbjornsdottir S, et al. Glycemic control and cardiovascular disease in 7,454 patients with type 1 diabetes: an observational study from the Swedish National Diabetes Register (NDR). Diabetes Care. 2010 Jul;33(7):1640-6.
5. de Boer IH, Rue TC, Cleary PA, Lachin JM, Molitch ME, Steffes MW, et al. Long-term renal outcomes of patients with type 1 diabetes mellitus and
microalbuminuria: an analysis of the Diabetes Control and Complications
Trial/Epidemiology of Diabetes Interventions and Complications cohort. Archives of internal medicine. [Multicenter Study Randomized Controlled Trial Research Support, N.I.H., Extramural]. 2011 Mar 14;171(5):412-20.
6. Galler A, Haberland H, Nake A, Hofer SE, Holder M, Raile K, et al. Natural course of untreated microalbuminuria in children and adolescents with type 1 diabetes and the importance of diabetes duration and immigrant status: longitudinal analysis from the prospective nationwide German and Austrian diabetes survey DPV. Eur J Endocrinol. 2011 Dec 23.
7. Svensson M, Eriksson JW, Dahlquist G. Early glycemic control, age at onset, and development of microvascular complications in childhood-onset type 1 diabetes: a population-based study in northern Sweden. Diabetes Care. 2004 Apr;27(4):955-62. 8. Petitti DB, Klingensmith GJ, Bell RA, Andrews JS, Dabelea D, Imperatore G, et al. Glycemic control in youth with diabetes: the SEARCH for diabetes in Youth Study. The Journal of pediatrics. 2009 Nov;155(5):668-72 e1-3.
9. Mortensen HB, Hougaard P. Comparison of metabolic control in a cross-sectional study of 2,873 children and adolescents with IDDM from 18 countries. The Hvidore Study Group on Childhood Diabetes. Diabetes Care. 1997 May;20(5):714-20.
10. Schwab KO, Doerfer J, Marg W, Schober E, Holl RW. Characterization of 33 488 children and adolescents with type 1 diabetes based on the gender-specific increase of cardiovascular risk factors. Pediatr Diabetes. 2010 Aug;11(5):357-63.
11. Setoodeh A, Mostafavi F, Hedayat T. Glycemic Control in Iranian Children with Type 1 Diabetes Mellitus: Effect of Gender. Indian J Pediatr. 2011 Dec 3.
12. Austin S, Senecal C, Guay F, Nouwen A. Effects of gender, age, and diabetes duration on dietary self-care in adolescents with type 1 diabetes: a Self-Determination Theory perspective. J Health Psychol. 2011 Sep;16(6):917-28.
13. Hochhauser CJ, Rapaport R, Shemesh E, Schmeidler J, Chemtob CM. Age at diagnosis, gender, and metabolic control in children with type 1 diabetes. Pediatr Diabetes. 2008 Jul 28;9(4 Pt 1):303-7.
14. Shalitin S, Phillip M. Which factors predict glycemic control in children diagnosed with type 1 diabetes before 6.5 years of age? Acta Diabetol. 2011 Aug 25. 15. Viswanathan V, Sneeringer MR, Miller A, Eugster EA, DiMeglio LA. The utility of hemoglobin A1c at diagnosis for prediction of future glycemic control in children with type 1 diabetes. Diabetes Res Clin Pract. 2011 Apr;92(1):65-8.
16. de Bock M, Gunn AJ, Holt JA, Derraik JG, Reed P, Cutfield W, et al. Impact of insulin pumps on glycaemic control in a pump-naive paediatric regional population. J Paediatr Child Health. 2011 Nov 16.
17. Sulli N, Shashaj B. Long-term benefits of continuous subcutaneous insulin infusion in children with Type 1 diabetes: a 4-year follow-up. Diabet Med. 2006 Aug;23(8):900-6.
18. Jakubowska-Pietkiewicz E. [Usefulness of short-term usage of real time continuous glucose monitoring system in achieving metabolic control improvement in
19. Ludwig-Seibold CU, Holder M, Rami B, Raile K, Heidtmann B, Holl RW. Continuous glucose monitoring in children, adolescents, and adults with type 1 diabetes mellitus: analysis from the prospective DPV diabetes documentation and quality
management system from Germany and Austria. Pediatr Diabetes. 2012 Feb;13(1):12-4. 20. de Boer IH, Sun W, Cleary PA, Lachin JM, Molitch ME, Steffes MW, et al. Intensive diabetes therapy and glomerular filtration rate in type 1 diabetes. The New England journal of medicine. [Multicenter Study Randomized Controlled Trial Research Support, N.I.H., Extramural]. 2011 Dec 22;365(25):2366-76.
21. Retinopathy and nephropathy in patients with type 1 diabetes four years after a trial of intensive therapy. The Diabetes Control and Complications Trial/Epidemiology of Diabetes Interventions and Complications Research Group. The New England journal of medicine. 2000 Feb 10;342(6):381-9.
22. Hanberger L, Samuelsson U, Lindblad B, Ludvigsson J. A1C in children and adolescents with diabetes in relation to certain clinical parameters: the Swedish
Childhood Diabetes Registry SWEDIABKIDS. Diabetes Care. 2008 May;31(5):927-9. 23. Levine BS, Anderson BJ, Butler DA, Antisdel JE, Brackett J, Laffel LM. Predictors of glycemic control and short-term adverse outcomes in youth with type 1 diabetes. The Journal of pediatrics. 2001 Aug;139(2):197-203.
24. Gerstl EM, Rabl W, Rosenbauer J, Grobe H, Hofer SE, Krause U, et al. Metabolic control as reflected by HbA1c in children, adolescents and young adults with type-1 diabetes mellitus: combined longitudinal analysis including 27,035 patients from 207 centers in Germany and Austria during the last decade. Eur J Pediatr. 2008
Apr;167(4):447-53.
25. Ziegler R, Heidtmann B, Hilgard D, Hofer S, Rosenbauer J, Holl R. Frequency of SMBG correlates with HbA1c and acute complications in children and adolescents with type 1 diabetes. Pediatr Diabetes. 2011 Feb;12(1):11-7.
26. Hanberger L, Samuelsson U, Bertero C, Ludvigsson J. The influence of structure, process, and policy on HbA(1c) levels in treatment of children and adolescents with type 1 diabetes. Diabetes Res Clin Pract. 2012 Feb 10.
27. Nordly S, Mortensen HB, Andreasen AH, Hermann N, Jorgensen T. Factors associated with glycaemic outcome of childhood diabetes care in Denmark. Diabet Med. 2005 Nov;22(11):1566-73.
B-coefficient 95% CI for B p-value Year 2010,
HbA1c dependent variable (n = 4144)
Age 0.435 0.32 – 0.55 <0.001
Diabetes duration 0.696 0.59 – 0.79 <0.001
BMI-SDS 0.369 0.04 – 0.70 0.027
Blood pressure systole, SDS 0.117 -0.31 – 0.54 0.59
Blood pressure diastole, SDS 1.372 0.77 – 1.97 <0.001
Insulin dose (U/kg) 9.465 8.34 – 10.59 <0.001
Gender 1.203 0.50 – 1.90 0.001
Year 2010,
BMI-SDS dependent variable (n =4144)
Age 0.005 -0.01 – 0.02 0.35
Diabetes duration 0.008 -0.001 – 0.018 0.09
HbA1c 0.003 0.000 – 0.006 0.027
Blood pressure systole, SDS 0.293 0.254 – 0.331 <0.001
Blood pressure diastole, SDS 0.035 -0.02 – 0.09 0.223
Insulin dose (U/kg) -0.239 -0.347 – - 0.13 <0.001
Gender 0.177 0.11 – 0.24 <0.001
Variables at diagnosis,
HbA1c at onset dependent variable (n = 1853)
pH -57.432 -67.90 - -46.96 <0.001
BMI-SDS -3.727 -4.47 - -2.98 <0.001
Blood pressure, systole, SDS -0.810 -1,86 – 0.24 0.13
Blood pressure diastole, SDS -0.773 -2.08 – 0.54 0.248
Gender 4.909 2.78 – 7.04 <0.001
BMI, mother 0.378 0.14 – 0.61 0.002
BMI, father 0.593 0.28 – 0.91 <0.001
Diabetes duration (years) 1.16 1.12 – 1.20 <0.001
BMI-SDS 1.11 0.99 – 1.26 0.07
Blood pressure SDS, systole 1.03 0.88 – 1.2 0.74 Blood pressure SDS, diastole 1.61 1.27 – 2.03 <0.001 Insulin dose (U/kg/24 hours) 11.82 7.65 – 18.25 <0.001 Gender (boy = 0, girl = 1) 1.32 1.02 – 1.72 <0.001 Table 2. Logistic regression. Two groups of children: one group with HbA1c < 7.4% (57mmol/mol), n = 1,239 and one group with HbA1c> 9.3% (78 mmol/mol), n = 444.
Variables (2010) OR 95% CI p
Age (years) 1.02 0.98 – 1.05 0.32
Diabetes duration (years) 1.03 1.00 – 1.06 0.05
HbA1c 1.01 0.99 – 1.01 0.11
Blood pressure SDS, systole 2.01 1.78 – 2.26 <0.001 Blood pressure SDS, diastole 1.05 0.89 – 1.23 0.56 Insulin dose (U/kg/24 hours) 0.69 0.51 – 0.93 0.016 Gender (boy = 0, girl = 1) 1.65 1.37 – 1.98 <0.001
Table 3. Logistic regression; comparing two groups of children, one group with BMI-SDS < 25 percentile and one group of children with BMI-SDS > 75 percentile.
HbA1c Age Age at onset BMI-SDS BMI-SDS at onset
Insulin dose
U/kg/24h HbA1c at onset
< 7.4% (n) 12.3 ±4.6 (2434) 8.7 ±4.5 (2436) 0.57 ±1.1 (2233) -0.30 ±1.5 (1462) 0.75 ±0.31 (2371) 88.6 ±25.3 (2005) 7.4-9.3% (n) 13.4 ±4.1 (4198) 7.3 ±3.9 (4199) 0.66 ±1.1 (3785) -0.44 ±1.5 (1597) 0.91 ±0.30 (4154) 91.0 ±24.5 (3258) >9.3% (n) 15.8 ±2.7 (817) 8.4 ±3.9 (817) 0.63 ±1.2 (676) -0.27 ±1.6 (212) 1.08 ±0.34 (809) 97.1 ±26.0 (559)
Table 4. Mean HbA1c in 2010 in relation to clinical parameters. The difference between the HbA1c groups is significant with respect to age, insulin dose and HbA1c at onset, p<0.001 each.