och kvartärgeologi
Examensarbete grundnivå
Naturgeografi, 15 hp
Changes in size distribution
of lakes in the Nadym
catchment, northern Russia
Sara Ahlgren
NG 6
2012
Förord
Denna uppsats utgör Sara Ahlgrens examensarbete i Naturgeografi på grundnivå vid Institutionen för naturgeografi och kvartärgeologi, Stockholms universitet. Examensarbetet omfattar 15 högskolepoäng (ca 10 veckors heltidsstudier).
Handledare har varit Steve Lyon och Johanna Mård Karlsson, Institutionen för naturgeografi och kvartärgeologi, Stockholms universitet. Examinator för examensarbetet har varit Andrew Frampton, Institutionen för naturgeografi och kvartärgeologi, Stockholms universitet.
Författaren är ensam ansvarig för uppsatsens innehåll.
Stockholm, den 5 juni 2012
Lars-Ove Westerberg Studierektor
1
Abstract
Because of climate change and resource development there is an ongoing increase in the attention directed towards high latitude areas. Over the last years, warming in the Arctic has accelerated quickly. The warming climate can possibly lead to thawing of ground ice, which in turn leads to alterations of the cryosphere. This can have a huge influence on the terrestrial hydrology of the Arctic and, more specifically, on the presence and distribution of lakes in arctic regions since both are coupled to subsurface ice. In this thesis data from remote sensing were used to look at the change in the size distribution of lakes for the Nadym catchment in northern Russia. The aim was to find out if there has been an increase or decrease in the number of lakes in the area over the past years. Results suggest that there were 229 lakes less (representing a 4% decrease) in 2007– 2009 compared to 1987, indicating that lakes are slowly disappearing. Also, the total lake surface area decreased with 5%. Almost half of the lakes that disappeared (49%) can be found among the smallest lakes ranging between 10–20 ha. In the entire
catchment this size class was also found to be the class with by far the highest number of lakes.
Keywords: Climate change, cryosphere, high latitude areas, Nadym catchment,
3
Table of Contents
1. INTRODUCTION ... 3
1.1BACKGROUND ... 3
1.2PROJECT DESCRIPTION AND STUDY AREA ... 4
1.3RESEARCH QUESTIONS REGARDING THIS THESIS ... 5
2. METHODS OF DATA COLLECTION AND ANALYSIS ... 6
3. RESULTS ... 8
4. DISCUSSION ... 11
4.1INTERPRETATION OF THE RESULTS ... 11
4.2RESEARCH OBJECTIVES AND LIMITATIONS ... 12
5. CONCLUDING REMARKS ... 13
ACKNOWLEDGEMENTS ... 13
REFERENCES ... 14
5
1. Introduction
1.1 Background
Because of climate change and resource development there is an ongoing increase in the attention directed towards high latitude areas (Woo et al., 2008). Over the last years, warming in the Arctic has accelerated quickly. At the top of permafrost layers across the Arctic a warming of up to 3°C has been experienced since the 1980s (IPCC, 2007) leading to some complex changes in the regions physical and ecological environment (Serreze et al., 2000). Similarly, a 7 % decrease in the surface area covered by
seasonally frozen ground has been occurring in the Northern Hemisphere since 1900 (IPCC, 2007).
According to recent projections, changes in the mean annual air temperature in 2090– 2099 relative to 1980–1999 will (in a low scenario focusing on global environmental sustainability) be between 1.1°C and 2.9°C. The best estimation for a high (fossil-fuel intense) scenario has a likely range of 2.4°C to 6.4°C (IPCC, 2007). Either one of these scenarios will likely have a huge impact on regions within the permafrost zone (Camill, 2005). The areas where the permafrost disappearance will most likely be happening with the quickest speed are those in the zone of sporadic and discontinuous permafrost in the southernmost parts of the permafrost zone (Camill, 2005). Such large climate change can also lead to thawing of ground ice, which in turn leads to alterations of the cryosphere. This can have a huge influence on the terrestrial hydrology of the Arctic and, more specifically, on the presence and distribution of lakes in arctic regions since both are coupled to subsurface ice.
The terrestrial water cycle plays an important role in most aspects of the Arctic system (Smith et al., 2005), which is why it is important that we broaden our knowledge within this field. Today our knowledge about the water cycle in high latitude areas is very sparse. Woo et al. (2008) discussed the recent advances in permafrost hydrology since the year 2000. In their study they bring up several reasons why there is a lack of knowledge within this field. First of all they establish that there has been very little research carried out to provide a better understanding of the central hydrological processes related to permafrost. The studies that have been done have all been of very short duration and both the quality and quantity of the data are often poor. The main
6
reason to this is because it is both difficult and expensive to gather data in permafrost regions since these are often located in remote areas that are hard to reach. One
alternative to collecting ground based data and making observations on site is the use of satellites and remote sensing. Even though remotely sensed data could never completely replace ground based observations they are still a great and useful substitute and
compliment in many cases (Woo et al., 2008).
A previous study using remotely sensed data has been carried out in Siberia where lakes seem to be disappearing as a result of permafrost thaw (Smith et al., 2005). Another study of the thermokarst lake dynamics in Alaska has shown a decrease in the total lake surface area (Jones et al., 2011). Having said this, there is still a need for further
research to get a better understanding of lake dynamics in Arctic regions.
1.2 Project description and study area
In this thesis data from remote sensing are used to look at the change in the size
distribution of lakes for a region in northern Eurasia. The area for this study is restricted to the Nadym catchment, which is a 48,000 km² catchment located in northern Russia (Figure 1). The landscape here primarily consists of tundra and taiga (Frey and Smith, 2007). Monthly mean temperatures for the past 10 years in Nadym have had an average high of 9°C and an average low of -21°C (Wolfram|Alpha, 2012). The elevation in the catchment (estimated with the help of Google Earth) ranges approximately between 10– 120 m.a.s.l. and the coordinates for the gauge station and outlet of the Nadym
catchment are 65.62°N, 72.67°E.
With Nadym being an area in northern Russia, it is located within the permafrost zone. The type of permafrost experienced here is largely sporadic and discontinuous (Frey et. al., 2007). According to previous studies (e.g. Smith et al., 2005) this region is
undergoing rapid change linked to a warming climate, which is why the Nadym area is an interesting region to study. One additional reason to why the Nadym area is of interest for a study of this sort, besides from the fact that it is an area covered with a lot of lakes and located within the zone of permafrost, is that the Nadym area makes up an entire hydrological catchment. This means that by analyzing the lakes and changes that
7
occur, it may be possible to make connections between the observations and changes in the amount and timing of water flow through the landscape.
Figure 1. Nadym catchment in yellow on top of the satellite imagery from Google earth.
Coordinates for the gauge station and outlet (red pin) are 65.62°N, 72.67°E.
1.3 Research questions regarding this thesis
The main question to be answered in this thesis is the following: are lakes appearing or disappearing in the Nadym catchment? In other words the aim here is to find out if there has been an increase or decrease in the total number of lakes over the past years. The lakes that are primarily considered in this study are thermokarst lakes, also sometimes known as thaw lakes. They come into existence as a result of melting permafrost. It would also be interesting to see how big the total increase/decrease in size of lakes has been for the entire lake surface area in the whole region. In addition, it could also be of interest to see if the changes, in terms of numbers of lakes, that have occurred are related to the sizes of the lakes considered.
8
Knowing the answers to these questions would be interesting since changes in the distribution and size of lakes can indicate that changes in the hydrological cycle are occurring. This is important for both the overall health of the ecosystem and for the biogeochemical movement such as for example the transport of carbon. Lakes, and of course surface water in general, play a big role in the flow and cycling of water through the landscape. Lakes also influence the water storage available in the landscape and would therefore play an important role in the water balance of the region. So
understanding if lakes are getting larger or smaller, how much they change and where the changes actually occur is a first step in analyzing the alterations happening in a permafrost region as a result of the climate getting warmer.
2. Methods of Data Collection and Analysis
This was mainly a remote sensing and GIS oriented project that focused on detecting change in thermokarst lakes over the Nadym catchment for a time span of
approximately 20 years. In order to detect change among the lakes in the study area satellite images were compared. The first set of images considered was collected in 1987 and the second between the years 2007–2009.
Two shape-files showing thermokarst lake distributions in the Nadym catchment were created using these images collected with Landsat 5. The Nadym catchment is a rather large region and therefore it covers several Landsat scenes (see Table A1 and Table A2 in Appendix). Since Landsat images are largely influence by cloud cover, a combination of images from 2007–2009 was used to obtain imagery with good enough quality for that period. In 1987 the cloud cover was not as big of an issue and therefore it was enough to use images from only that year. This current study only considered these two time periods (1987 and 2007–2009) because Landsat 5 experienced some instrumental errors in the early 2000s creating a limitation of recent usable data. Also, initial work indicates that these two images from 1987 and 2007–2009 are showing strong change which is another reason to focus on them in this current study. Another reason to why these years were used as oppose to any other years is because they both showed a low cloud cover. In order to carry out a successful analysis of this sort the images need to
9
have minimal cloud coverage. The images were acquired during the summer season in order to avoid snowmelt and seasonally inundated areas. The amounts of images available were therefore even more limited since the aim was to only use imagery from the later part of the summer season, primarily July–September.
The Landsat images were preprocessed in ENVI 4.8 by Johanna Mård Karlsson. They were first calibrated to convert digital numbers to spectral radiance. In order to remove noise and enhance the spectral contrast of water features in the imagery Principal Component Analysis (PCA) was used. After that, the images were further classified with the help of the spectral signatures characterized for water. Once processed, lakes were digitized. The digitization of lake areas from the Landsat 5 images was also carried out by Johanna Mård Karlsson. Using ArcGIS a lower boundary of 10 ha was set for the size of the lakes, everything smaller than 10 ha was removed and is therefore not included in this study. Many of the water objects that were not considered to be thermokarst lakes, like rivers and features such as oxbow lakes, were also removed. The resulting digitalized maps of lake coverage for the two sets of data were available and provided a starting point for this project (see Figure A1 and A2 in Appendix).
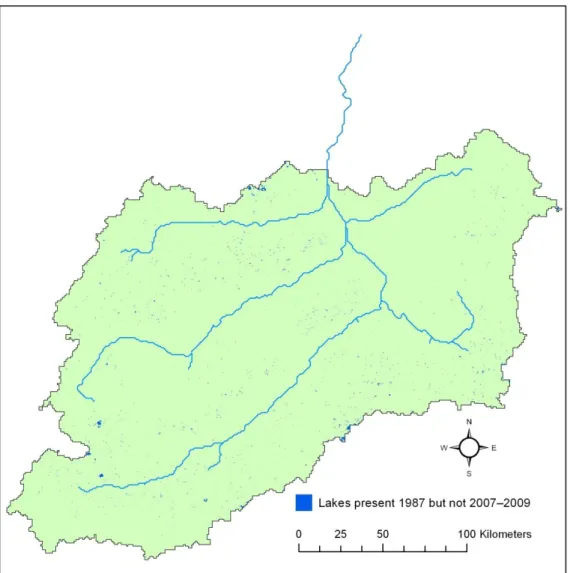
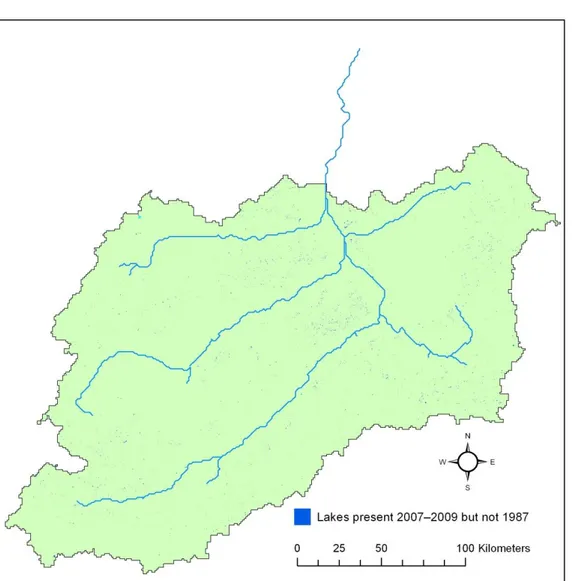
In ArcGIS the attribute data, concerning lake numbers and lake area, was extracted and used for calculations in Excel in order to answer the main questions for this thesis. This data provided information about the area associated with each individual lake in the Nadym catchment. Later, the two sets of data were analyzed with the help of different methods in ArcGIS. Overlay analysis was used in order to get separate shape-files showing the differences in lake distribution between the years. With the help of the Erase tool two new shape-files were created. One showing the lakes that were present in 1987 but not in 2007–2009 (see Figure A3 in Appendix). The other one contained the lakes present in 2007–2009 but not in 1987 (see Figure A4 in Appendix).
10
3. Results
When only considering the actual numbers of defined thermokarst lakes in the Nadym catchment, lakes seem to be disappearing over this time period. When counting the number of lakes present in 1987 and comparing this to the number of lakes in 2007– 2009 (Table 1), a decrease of 229 lakes was detected. This approximately represents a 4% reduction in the total number of lakes in the area, with respect to the lakes in 1987.
Table 1. Number of lakes present each period.
Years Number of lakes
1987 5915
2007-2009 5686
There was also a decrease in the total lake surface area within the region. Comparing the information in the attribute table of the two shape-files, it showed that the total lake surface area was reduced from 231,723 ha in 1987 to 219,986 ha in 2007–2009 (Table 2). The total decrease in size, for the entire lake surface area in the whole region
combined, was therefore 11,737 ha, which represents a 5%decline with respect to 1987.
Table 2. Total lake surface area for the two periods.
Years Total lake surface area [ha]
1987 231,723
2007-2009 219,986
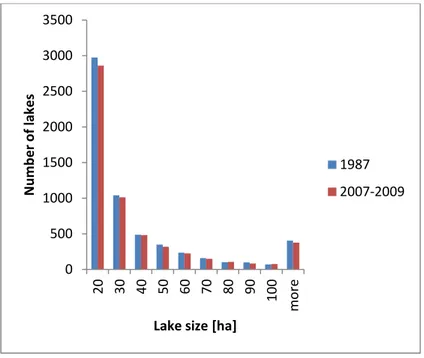
The lakes that were of most interest for this study were the smaller ones, since these are most likely to be thermokarst lakes. Variations in lakes larger than 100 ha is not given much attention. To get a better view of the distribution of lake sizes the lakes were sorted in to 10 bins. Each bin had a range of 10 ha between 10 ha and 100 ha. Since a
11
lower boundary for the lake size was set at 10 ha, the first bin displays lakes ranging from 10–20 ha. Lakes smaller than 10 ha were not included in this study. Out of practical reasons lakes larger than 100 ha were put in a separate bin containing all remaining lakes. It was not reasonable to divide the entire set of data into bins of 10 ha since there were relatively few lakes that were larger than 100 ha and they ranged all the way up to almost 5650 ha.
All of the lakes were displayed in a histogram showing size distribution (Figure 2). As seen in Figure 2 the number of lakes in each size class decrease as the size class of the lakes becomes larger. Almost half of the lakes that disappeared, 49%, can be found in the smallest size class (10–20 ha) which is also by far the class with the highest number of lakes.
When looking at the percentage of change in each size class the largest decrease was 15% and can be seen in the size class between 80–90 ha. While the number of lakes
decreased in most of the size classes, two of them (70–80 ha and 90–100 ha)
experienced an increase in the number of lakes (Figure 3). In general Figure 3 shows that smaller lakes tended to disappear while the larger ones experienced both losses and increases over the period considered.
12
Figure 2. Size distribution for the lakes in the Nadym catchment from 1987 (blue) and 2007–
2009 (red), respectively. Each bin represent a span of 10 ha, except for the last one (more) which includes every lake larger than 100 ha. Since there was a lower boundary set at 10 ha the first bin (20) represents lakes between 10 and 20 ha. Lakes smaller than 10 ha are not included in this study.
Figure 3. Percentage change in number of lakes between 1987 and 2007–2009 in the Nadym
catchment. Each bin represent a span of 10 ha, except for the last one (more) which includes every lake larger than 100 ha. Since there was a lower boundary set at 10 ha the first bin (20) represents lakes between 10 and 20 ha. Lakes smaller than 10 ha are not included in this study.
0 500 1000 1500 2000 2500 3000 3500 20 30 40 50 60 70 80 90 100 m o re N u m b e r o f l ake s
Lake size [ha]
1987 2007-2009 -20% -15% -10% -5% 0% 5% 10% Per ce n tage ch an ge
Lake size [ha]
13
4. Discussion
4.1 Interpretation of the results
The results obtained in this thesis regards lake distribution in the Nadym catchment in northern Russia. According to the findings of this study the area in general seems to experience a small loss of lakes. The results in this thesis show that both the number of the lakes and the total lake surface area has been reduced between the years 1987 and 2007–2009. The number of lakes has decreased with 4% and the total lake surface area has experienced a 5% loss. It is however not as simple as just stating that 4%of the lakes and 5% of the area disappeared and nothing else happened to the remaining lakes. Much change has occurred in this timespan of approximately 20 years. These changes become more visible when examining the data with the help of ArcGIS and using visual inspection. While some lakes have disappeared completely there are other new ones that have come in to existence. Figure A5 in the Appendix show an example of a randomly selected area within the Nadym catchment where it is visible that some lakes have disappeared while others have been created. While anecdotal in nature, this style of visual inspection helps give additional insight to the main results of this study.
Regardless of this clear variability, there were 229 lakes less in 2007–2009 compared to 1987, which indicates that lakes are slowly disappearing.
While it should probably be easier for a smaller lake to disappear than a larger one, it is also easier for smaller lakes to be created compared to larger lakes. This could most likely be the reason to why the smallest lakes with an area of 10–20 ha did not experience the biggest percentage loss. The lakes in the larger size classes cannot disappear as easily as the small ones. Rather it seems like they change into another size class by either increasing or decreasing in size. The largest decrease in number of lakes was found to be among the lakes that had an area of 80–90 ha. This class experienced a decrease in number by 15% over the period considered. Both of the next size classes down and up (70–80 ha and 90–100 ha) were the only classes that experienced increases, with 4% and 7% respectively.
It should be noticed that seasonal and yearly variations in weather conditions may have influenced the results obtained in this thesis. It is possible that the years from which the data was collected were extra wet or extra dry and hence affected the outcome of this
14
study. Variations of this sort cannot be completely avoided. Although, by looking at weather data from the area and taking those in to account, the effects of weather differences on the results could have been minimized. This was however outside of the scope for this thesis. Another source of possible error is the fact that one image was collected over a time span of 3 years. There is a possibility that some changes among the lakes were lost due to this fact.
The findings of this study are similar to those in previous studies like Smith et al. (2005), where the total lake abundance in an area of Siberia was found to have declined since 1973. Although this thesis is much smaller and less extensive, results still indicate a similar trend. Smith et al. (2005) highlighted that the ultimate effect of a warming climate on permafrost controlled lakes might be their widespread disappearance, which seems to be in line with the results of this study.
4.2 Research objectives and limitations
The goal for this thesis was to contribute to an improved understanding of the changes in permafrost hydrology as a result of global warming. The outcome will hopefully provide information which can be used for further studies of the water balance for the Nadym catchment.
One limitation to this project is time. Since this thesis is only for 15 credits, time was quite limited and therefore it was not possible to take on a bigger set of data. This is the main reason for comparing only two images to each other as oppose to looking at the change for several time periods. When only comparing two sets of data to each other it is difficult to know if the changes that are detected would actually be representative for longer timespans as well. The results will only be a snapshot of what happened in the system between two points in time. It will not necessarily say much about what is going on in a dynamical system over a longer time period. However, it is still useful since it can give a small indication of what is going on.
When it comes to interpreting the results it might be important to keep in mind that there could possibly be variations and changes among lakes that are completely natural.
15
Thus, all changes experienced should maybe not necessarily be interpreted as have something to do with the thawing of permafrost.
5. Concluding Remarks
This thesis focused on detecting change in the size distribution of lakes in the Nadym catchment in northern Russia. In general, the results show a decrease in the number of lakes within the area. Results also indicate a decline in the total lake surface area of the region. Yet further research within this field is needed in order to make more valid conclusions. The most obvious expansion of this thesis would be to improve the temporal resolution by using data from more time periods. That way it would be
possible to say something about if the changes occurring are trends that can be followed and expected to continue in the future or if they just happens to be exceptions. Other possible improvements could include taking weather data into account. For example, both precipitation and evaporation can have an influence on the lake sizes and distribution and hence affect the results. Also, a more detailed study of the spatial distribution and its changes would be interesting. It could be of interest to look at the soils and vegetation types of the region and investigate the lakes variation patterns according to those.
Acknowledgements
I would like to thank my supervisors, Steve Lyon and Johanna Mård Karlsson, for introducing me to this field and giving me all the support I could possibly have needed in order to carry out this study. A special thanks to Johanna, who provided the data which was used as a starting point for this study.
I also want to show my appreciation to my family, especially my mother Marina
Ahlgren who read my report at its different stages and gave me insightful comments and constructive criticisms. Last, but not least, I wish to express my gratitude towards my boyfriend Soonjae Lee for his love and encouragement throughout this process.
16
References
Camill, P. (2005), Permafrost thaw acceleration in boreal peatlands during late 20-th century climate warming. Climatic Change 68: 135-152
Frey, K. E., J. W. McClelland, R. M. Holmes, and L. C. Smith (2007), Impacts of climate warming and permafrost thaw on the riverine transport of nitrogen and phosphorus to the Kara Sea. Journal of Geophysical Research 112: G04S58 Frey, K. E. and L. C. Smith (2007), How well do we know northern land cover?
Comparison of four global vegetation and wetland products with a new ground-truth database for West Siberia. Global Biochemical Cycles 21: GB1016
IPCC (Intergovernmental Panel on Climate Change) (2007), Climate Change 2007: The
Physical Science Basis. Cambridge University Press, Cambridge.
Jones, B. M., G. Grosse, C. D. Arp, M. C. Jones, K. M. Walter Anthony and V. E. Romanovsky (2011), Modern thermokarst lake dynamics in the continuous permafrost zone, northern Seward Peninsula, Alaska. Journal of Geophysical
Research 116: G00M03
Serreze, M. C., J. E. Walsh, F. S. Chapin, T. Osterkamp, M. Dyurgerov, V. Romanovsky, W. C. Oechel, J. Moison, T. Zhang, and R. G. Barry (2000), Observational evidence of recent change in the northern high-latitude environment. Climatic Change 46(1-2): 159-207
Smith, L. C., Y. Sheng, G. M. MacDonals and L. D. Hinzman (2005), Disappearing Arctic Lakes. Science 308: 1429
Wolfram|Alpha (2012),
http://www.wolframalpha.com/input/?i=weather+Nadym+Russia (access May 24, 2012).
Woo, M. K., D. L. Kane, S. K. Carey and D.Yang (2008), Progress in Permafrost Hydrology in the New Millennium. Permafrost and Periglacial Process 19: 237– 254
17
Appendix
Table A1. Landsat images used for creating the shape-file showing polygons representing
thermokarst lake distribution for 1987 (Figure 1 in Appendix).
Path Row Acquisition date
157 15 1987-08-23 158 16 1987-07-07 159 14 1987-08-21 159 15 1987-07-04 159 16 1987-08-21 160 14 1987-09-13 160 15 1987-09-13
Table A2. Landsat images used for creating the shape-file showing polygons representing
thermokarst lake distribution for 2007–2009 (Figure 2 in Appendix).
Path Row Acquisition date
158 15 2009-07-25 158 16 2009-07-25 159 14 2009-08-01 159 16 2009-07-16 160 14 2007-09-04 160 15 2007-08-19
18
19
Figure A2. Digitized map of lake coverage in the Nadym catchment for 2007–
20
Figure A3. Lakes that were present in the Nadym catchment 1987 but not in
21
Figure A4. Lakes that were present in the Nadym catchment 2007–2009 but not
22
Figure A5. Close up of some of the changes of the lakes in a randomly selected
part in the Nadym catchment. Pink lakes are those that have totally disappeared and did not exist in 2007–2009. The blue lakes are new and came into existence after 1987. The contours that are visible show lakes which have either increased (blue) or decreased (pink). These contours might not be actual change in lake sizes, rather it is likely they represent minor errors from the digitization.