Visualization Techniques for Surveillance:
Visualizing What Cannot Be Seen and Hiding
What Should Not Be Seen
Jörgen Ahlberg
Linköping University Post Print
N.B.: When citing this work, cite the original article.
This is an electronic version of an article published in:
Jörgen Ahlberg , Visualization Techniques for Surveillance: Visualizing What Cannot Be Seen
and Hiding What Should Not Be Seen, 2015, Konsthistorisk Tidskrift, (84), 2, 123-138.
Konsthistorisk Tidskrift is available online at informaworldTM:
http://dx.doi.org/10.1080/00233609.2015.1019921
Copyright: Taylor & Francis (Routledge): SSH Titles
http://www.routledge.com/
Postprint available at: Linköping University Electronic Press
Visualization techniques for surveillance:
Visualizing what cannot be seen and hiding
what should not be seen
Manuscript accepted for publication in Journal of Art HistoryJörgen Ahlberg Visiting Senior Lecturer Dept. of Electrical Engineering
Linköping University SE-581 83 Linköping Sweden Email: jorgen.ahlberg@liu.se Tel: +46 706 757 384
Introduction
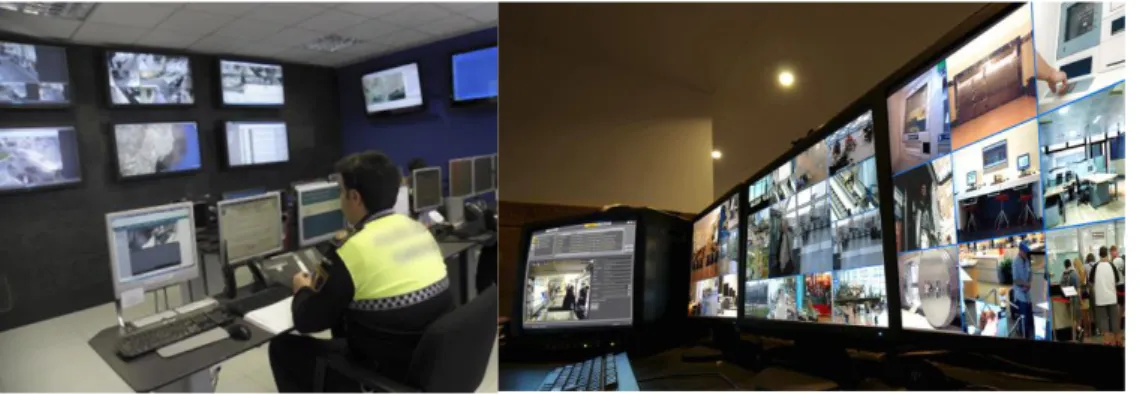
Video surveillance (closed-circuit television, CCTV) systems are becoming ubiquitous; you can hardly take a walk in a modern city center without being recorded by surveillance cameras, even less so inside shops and malls. A large shopping mall can have hundreds of cameras installed, a football stadium maybe one hundred. Typically, these cameras are connected to a control center, where a subset of the camera views is displayed on a number of screens or video walls, such as in figure 1. Human operators monitor the imagery, trying to assess the situation and detect incidents and threats.
There are several problems associated with this work situation, partly due to the difficulty for the human operator to interpret multiple channels of visual information, partly due to the limitations of what the human visual system is able to see, and partly due to the fact that we do not want surveillance operators to see everything. The aim of this paper is to categorize, describe and discuss surveillance problems that can be addressed by exploiting visualization techniques.
The problems, solutions, examples and illustrations in this paper are the results of interviews and discussions with various security and technology experts, such as security managers at sports arenas, public transport systems, and airports, as well as scientists in sensor technologies outside the author’s own expertise. While most of the results from those discussions are out of scope of this paper (i.e., they were issues of security and not of visualization), a number of existing and emerging visualization techniques were brought up. This paper is an attempt to categorize, describe and discuss them, and also to make predictions about their future use in surveillance as well as in our daily lives. Four such problems are selected, three that are associated with the main problems of surveillance technology in general (detection, situation awareness, privacy), and one where visualization is the critical component (visualizing the invisible).
The paper is written from an engineering perspective, aiming at explaining for the non-technical reader how advancements in computer graphics, sensor and surveillance technologies lead to problems (and solutions) that to their nature are of an ethical, legal or perceptive nature rather than technological. Focus is on visualization solutions, while ethical/privacy/legal issues are briefly mentioned and technology described only as much as necessary for understanding the treated concepts.
Regarding technology, much of this paper involves automatic (computerized) analysis of images, that is, a computer executes image analysis algorithms for a specific purpose; in this paper I restrict the purpose to visualization of the results to a human observer (an operator or an analyst). The art of inventing such algorithms is in the cross-section of mathematics, electrical engineering and computer science, and is in the literature referred to as computer vision,
machine vision, (automated) image analysis and (digital) image processing –for the purpose of
this paper, these terms can be regarded as synonymous. The literature in the area is plentiful, with hundreds of textbooks on different levels and subtopics to choose from. Widely used introductory textbooks on image processing and analysis are the ones by Gonzales and Woods1
and Sonka et al. 2, both starting with the fundamentals about digital images, sampling and
quantization, and then introducing the various subtopics of image processing, such as restoration, enhancement, segmentation, and compression of digital images and also expanding into the computer vision area by introducing 3D geometry and object recognition. Geometry for computer vision is further treated by, for example, Hartley and Zisserman3, while a good
introduction to computer vision in general is given by Szeliski4. An ongoing trend is that
computer vision is merging with the field of machine learning, in order to create systems that
learn from the analyzed images, exploiting the gained knowledge for solving later tasks. A good starting point for machine learning in general is given by Bishop5, and its combination with
computer vision by Prince6. Moreover, for each subtopic mentioned above, there are several
textbooks available. There are also books oriented towards specific computational tools, such as the open source library OpenCV7, the programming language Python8, and the mathematics
software Matlab9. An attempt to give an encyclopedic overview of the field was recently made
by Ikeuchi10 (and a host of editors and contributors), creating a two-volume reference guide to
computer vision.
In the context of this paper, visualization refers to methods for creating (digital) images that illustrate specific phenomena for a human observer, whereas computer graphics11 is a tool for implementing these methods. The phenomena to be visualized can be sounds, materials, actions, …, as discussed and exemplified in the paper.
For the remaining of this paper, the outline is as follows: The above-mentioned four problems will be described in the next section. Each will then be discussed in more detail in a separate section, followed by a concluding discussion.
Background: Four surveillance problems
First, the task for the human surveillance operators is to detect interesting events. This is naturally a critical issue for surveillance – if events cannot be detected, there is really no point with surveillance at all. Events regarded as interesting can include accidents, aggression, theft, or acts of terrorism. The interesting events can be hard to spot, they appear rarely, and they are also hidden in vast amounts of normality, i.e., hours of video without anything special happening. Keeping focus on an extremely boring video for hours is quite impossible for humans, and interesting events are thus bound to pass unnoticed. Thus, various methods to visualize patterns and highlight possibly interesting events are currently developed around the world.
Second, events that are spread out over multiple camera views are difficult to interpret. Tracking one single person walking through a building can be hard; when the person leaves one camera view, where does the person appear next? More complex patterns involving several persons are, of course, even harder to interpret. So, even if all the information is there, the operator will still lack understanding of the situation at hand, i.e., the operator will lack situation
awareness. One way to improve the situation awareness is to use 3D visualization of the
surveillance videos in a computer generated 3D environment.
Third, a serious problem with video surveillance is the privacy intrusion. While surveillance cameras give some people a feeling of increased security, others feel watched by “Big Brother”. Moreover, regardless of these subjective feelings, video data can, accidentally or intentionally, be misused. An important insight is that the privacy intrusion is often unnecessary for the
surveillance operators to do their job – the information they want to extract from the videos does rarely include personal looks or identity. Thus, various methods are developed in order to visualize relevant behaviors without revealing the identity of the involved persons. That is, visualization techniques are used in order to hide what is too easy to see, and, as described in the previous two problems, to visualize what is difficult to see.
Note that the three above-mentioned problems can of course all be addressed by other means than visualization. For example, operator training, use of other sensors (addressed below), replacing cameras with personnel, or reducing the need of surveillance.
Fourth, there are also various sensors capturing information that is invisible to the human eye, and needs to be visualized in some way. Some of these sensors are used mostly for military applications (reconnaissance rather than surveillance), but, for example, thermal imaging is nowadays used in many professions and is currently entering the consumer market. For such sensors, visualization is an enabler and not just an extra feature or improvement.
In the following, I will discuss these four cases of visualization as well as give pictorial examples.
Case 1: Visualization of interesting events
An event (or incident) is in this context basically something that should be discovered by the operator, i.e., the very purpose of the operator’s work and the surveillance itself. As mentioned, these events can be hard to discover, partly because of the enormous amounts of video data in which the events can be hidden, partly because they can be difficult to observe even when looking straight at. Some events are common and harmless, but can point out other things that need to be considered by the operator. Some events are completely non-interesting in one environment, but critical in others. Let me give a few examples:
Aggression is an interesting event in most surveillance situations, and its presence should thus
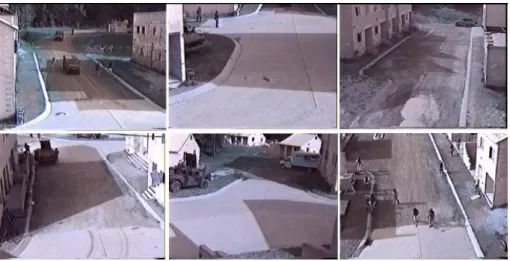
be visualized. Figure 2 shows an example with automatic analysis of images from a surveillance camera. In the top row, no abnormal behavior is detected. In the bottom row, a fight is detected. In this particular case, a detected fight is indicated by a red border.
Loitering. A person is walking on the platform on a train station. The person leaves, goes to
another platform, then another, then back to the first. This behavior is hard to spot by an operator, but suggests that the person either belongs to the cleaning or security staff (which is easy to discern) or is a pickpocket. Such loitering is thus typically a behavior that should be visualized by the computer, for example by highlighting the person and the areas the person has visited and for how long time.
Running or walking in the wrong direction. Running to the train is of course a completely
innocent action. In contrast, running through the security gate at an airport has severe consequences, as does walking the wrong way and entering through an exit. If the trespasser is not stopped immediately, the entire airport terminal might need to be evacuated for security reasons.12,13 In this case, not only the incident, but the track of the trespasser needs to be
visualized in order to find him/her as quickly as possible and also for the following search of potential bombs etc.
Falling or lying down. This is obviously an indicator that something bad might have
happened. In public spaces with stairs, such as train and subway stations, detecting people who fall in stairs is a reason for surveillance.14
Abandoned luggage. A commonly discussed indicator is that someone puts down a bag and
leaves the area.15,16,17,24 The “abandoned luggage problem” – to automatically detect abandoned
luggage – is thus a popular research topic.18
What constitutes an interesting or suspicious event varies with location, time, and social context, and there might also be a difference between what a security policy says and what a surveillance operator perceives as suspicious; Stedmon et al.19 have studied this and list
behaviors that are perceived as suspicious. Also, Troscianko et al.20 studied behaviors which
softwares provide other lists based on what they are able to detect. The list given here is thus intended to be illustrative rather than exhaustive.
An alternative approach to spotting interesting events is to look not for specific, pre-defined behaviors, but rather for anomalies, i.e., such behaviors that deviate from a normality picture.21,22,23 Such a system could support an operator in finding behaviors that stick out, in a
way unknown in advance. In this case, we need a learning system, a system that can extract features or characteristics (such as motion patterns) from the images and learn what is normal.
In order to automatically visualize any of the above events, methods for automated (computerized) analysis is needed, and certain such methods have been available for a few years. However, available functionalities are mostly quite simple, like giving an alarm when something is moving within a specified area in a camera view, an area where no one is supposed to be. Considerably more advanced functionalities are under development. In research and development labs around the world, a large number of activities are carried out in order to, for example, automatically track people and their movements and to analyze what is going on. Automatic detection of interesting events has been the topic of several European24,25,26 and
American27 research projects. Overviews of the evolving technologies and their impact on
society are given in Hellström et al.28, Adams and Ferryman29, and Porikli at al.30
It should be noted that many of these activities do not have surveillance as their purpose. Games, traffic analysis, elderly care, user interfaces, driver assistance, and sports are some of the target applications. Recent well-known examples are the game accessory Kinect31 and
pedestrian detection in personal cars32,33. Recognition of human actions is thus a wider subject,
and the emergence of publically available databases, such as the ones from KTH34 and UCF35,
INRIA/IRISA36, and UvA37 are clear indicators of the popularity of the topic.
Case 2: 3D visualization for situation awareness
When a number of people are moving in an area under surveillance, it is surprisingly hard for an untrained operator to understand what is actually going on, to interpret the actions of groups of people, and to get an overview of what is happening in multiple camera views simultaneously. The traditional way of visualizing multiple camera views is simply not very well suited for these tasks, and the more cameras, the worse the problem. The operator suffers from information overload and cannot achieve situation awareness.
One way to overcome these difficulties is to combine the realms of 3D computer graphics and video rendering. The idea is to create a 3D computer graphics model of the area under surveillance, and then insert the surveillance cameras in that model in the form of virtual
projectors or video flashlights.38 That is, the video recorded by the camera will be projected on
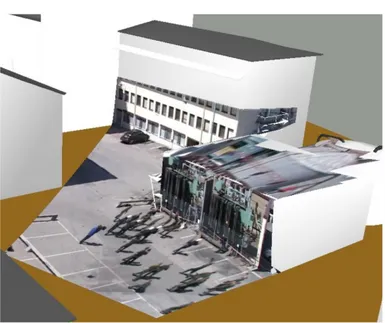
the 3D model. An object within a camera view will thus be shown in the 3D model at the place corresponding to its position in the real world. In a way, the 3D model will “come alive”. The concept is explained in figure 3 which shows two cameras as virtual projectors, projecting the camera imagery onto the 3D computer graphics model. The two images of cameras and the red lines are added to illustrate the concept. The left camera illustrates that an image can be projected on a building and/or on the ground (the image to be projected is here symbolized with a homogeneous semi-transparent blue surface). The right camera actually projects an image (a few persons and part of a police car are visible) onto the ground. The buildings are computer graphics models created from height measurements by an airborne laser scanner while the texture on the ground is copied from aerial photos. A resulting picture is shown in figure 4, where a video from a surveillance camera is projected onto a 3D model.
The operator will then view the scene through a virtual camera that can be placed anywhere in the area, and also move around. For example, the virtual camera might move to a high altitude and look down on the entire area, and thus see many of the real camera views at once. Or, the virtual camera can be moved to street level, where one or more camera views can be visualized in their spatial context. Figure 5 shows traditional visualization of surveillance camera views, that is, a video wall with one screen per camera. The relation between the views is far from
obvious. For example, when the persons walking in the bottom-right camera views exit that view, in which camera view will they appear (if any)?
Sidenbladh et al.39 notes three advantages of the 3D visualization of surveillance video:
1. The context in which each camera is placed is visualized and becomes obvious. 2. The spatial relation between different cameras becomes obvious.
3. Imagery from several cameras can be studied simultaneously, and an overview of the area under surveillance is easily acquired.
The difference between traditional visualization and the proposed 3D visualization is illustrated in figures 5 and 6, where the latter shows camera views visualized in a 3D computer graphics environment. Several images are projected into the same street, and the spatial relation between the images is obvious. Note, for example, the white car and the person walking in the street; it is clear that the car is driving towards the person (in a video, this is of course more clear than in a paper). These two objects, the car and the person, are recorded by different cameras, and would end up on different screens when visualized traditionally (as in figure 5), making the relation “driving towards” or even “is in the same street” much less obvious.
Returning to the images in figures 3 and 6, there are apparently several choices regarding design and visualization made. In figure 3, the buildings are gray, shaded blocks generated purely by computer graphics, while in figure 6 the buildings have textures (windows and structures on the walls are clearly visible). This is mainly due to the differing availability of sensor data. In the first case, the models are generated from 3D data acquired by an airborne laser scanner, while in the latter photographies were available for the building walls. With the advent of public web-based 3D map services like Google Earth, this might not seem very spectacular anymore. However, it still requires a considerable effort and thought to get such visualization right. Small errors in virtual camera placement give disturbing mismatches between the 3D model and the projected video.
Case 3: Visualization for Enhancing Privacy
The technology development described here might give the reader some worries about the impact on our privacy. And yes, the technical advances do come with such risks29,40,41, but there
are also reasons to believe that the technology can be used for increased safety, security, and convenience without privacy intrusion – whether this will happen or not is a discussion outside the scope of this paper. There is ongoing technology development specifically with the aim at protecting privacy when under video surveillance.42 An increasingly common example is
various forms of masking techniques, where persons in the imagery are blurred or masked so that they cannot be identified. For a surveillance operator, the interesting facts often are that,
where or how a person is moving in front of the cameras, while the identity of the person is of
little or no interest.
Thus, several ways of visualizing events while hiding identities have been shown, for example by covering peoples silhouettes by uniform color. At a few occasions, such systems have also been debated in public media.43,44,45
The concept is illustrated in figure 7, where people just passing by are covered with uniform but differing colors. The assignment of different colors to different persons has the sole purpose of making the image interpretable – if all persons had the same color, large parts of the image would be covered by one big blob which would not improve the above-mentioned situation awareness. The exception is the thief stealing a bag in the foreground; revealing the identity of thieves is one of the purposes of the surveillance system and the thief is therefore unmasked. The green rectangles are presumably there only to give an impression of advanced technology (the picture is from a news article, not from an operational system).
Another example is given in figure 8. A video of two groups of people is projected into a 3D model (the same as in figure 3), and each person is covered by a 3D computer graphics object with approximate human dimensions. The video shows two confronting groups of people, and
the colors indicate which group each person belongs to. In this case, the red color indicates which persons belong to an aggressive group, attacking the green group. By this coloring, behaviors of groups are much easier to understand for the human operator.
The highlighted (yellow) person is pointed out by another sensor system as described in the next section.
Case 4: Visualizing the invisible
Yet another reason for using visualization techniques instead of showing the acquired sensor data directly is that the data might not have a natural visible form. For example, what does a sound look like? Or a temperature? In fact, there are many devices sensing other signals than visible light, such as cameras sensing radiation (light) outside the visible spectrum (ultraviolet, infrared), microphones, radars, seismic sensors, ultrasound imagers and nuclear resonance imagers. Below, four visualization techniques for non-visual data are discussed; three for visualizing non-visual images and one for visualizing sound.
Visualizing non-visual images
First, let us look at thermal imagery, that is, images from a thermal infrared camera (thermal camera, heat camera). Such cameras capture the infrared radiation emitted by all objects – the hotter the object, the more infrared radiation it emits.46 The easiest way to visualize such images
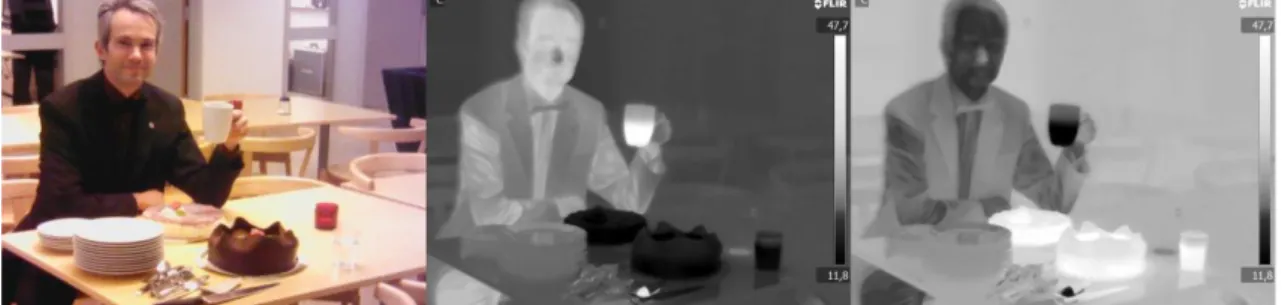
is to set a brightness value to each pixel, so that hot spots are shown as white and cold spots are shown as black. This is called “white hot”, and sometimes the opposite, “black hot”, is used, see figure 9. It is quite common, however, to assign a color map to the temperature. Two examples are shown in figure 10; the color map called “rainbow” is constructed by letting the color map traverse all the colors of the rainbow, giving a good color contrast also for small temperature differences. The color map called “iron” is constructed by letting the color map traverse the colors of glowing iron as it gets hotter, from dark blue through red and yellow to white. Such images improve interpretability for the human eye, either because it appeals to how we think hot and cold spots should look (“iron”), or because differences in temperature are visualized as a difference in brightness and color (“rainbow”) enabling us to discern small temperature contrasts. While thermal cameras have previously been reserved for military and scientific use, they have more recently become tools for certain professions and entered the consumer market in 2014.47 We are thus likely to see various kinds of visualizations of thermal imagery in our
daily lives in the near future.
Another type of images is multispectral (or multiband) images, where the camera captures light (radiation) in several different wavelength bands.48 To visualize such imagery, false color maps are commonly used. Satellite images with false colors showing the vegetation, cities,
rivers, etc. are sometimes shown in newspapers, typically without any explanations why real colors are not used. The reason is that these images come from cameras that capture wavelengths different to what the human eyes sees, that is, there are no “real colors” for those images. If the camera captures light at three different wavelength bands, then the simplest solution is to display each of them as the red, green and blue component of the image respectively (That is, the three visible components49. For more information about the human
visual system, see, for example, the textbooks by Stone50 or Findlay and Gilchrist51). However,
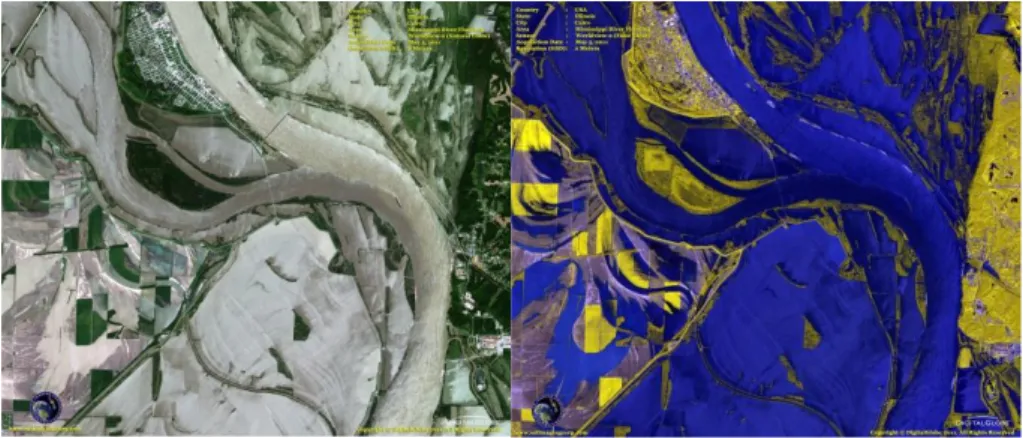
satellite images might well have been captured at more than three wavelength bands. For example, the commercially operating satellite Worldview-2 has a camera that captures light at eight different wavelength bands, of which six are within the range that is visible to the human eye. To visualize such imagery, the number of bands must be reduced to three (or less) in order to be visualized. This can be done by dropping five bands or by combining them in weighted sums, depending on the purpose – is it algae or crops that should be visualized? An example is given in figure 11, where wavelength bands indicating the presence of water in the Mississippi flooding in Illinois have been weighted and summed and the result assigned to the blue component of the image. Vegetation has been visualized as yellow (green might have been a
more intuitive choice, but would give less visual contrast to the blue water), and soil and buildings as grey. Comparing with the natural color image, where the water as well as the soil appears grey, it is much easier to see what areas are flooded.
Extending the multispectral case, a hyperspectral camera captures light at tens or hundreds of distinct wavelengths, resulting in an image where each pixel is a large set of values – a spectral signature describing color in a much more detailed way than the human eye can perceive. Visualizing each pixel as a graph, as in figure 12, showing these values is meaningful when studying one (or very few) points in the image, but creating one million such graphs for a one megapixel image is quite meaningless. Another way would be to pick three values corresponding to red, green, and blue light and create an image adapted to the human eyes as shown in figure 13. The result looks as if it was created by an ordinary digital camera. However, that visualization would remove all additional information given by the hyperspectral camera, and what would then be the point of the hyperspectral camera at all? Again, depending on the purpose, certain components corresponding to, e.g., certain types of minerals or vegetation could be selected as red, green, and blue, producing a false color map just as above. Another approach is anomaly detection, that is, to visualize the abnormal and highlight uncommon pixels. In order to do that, we need to find a mathematical measure of uncommonness (abnormality) in an image and assign this uncommonness to the brightness of each pixel. Many such measures have been developed during the last 30 years; an overview is given by Borghys et al.52
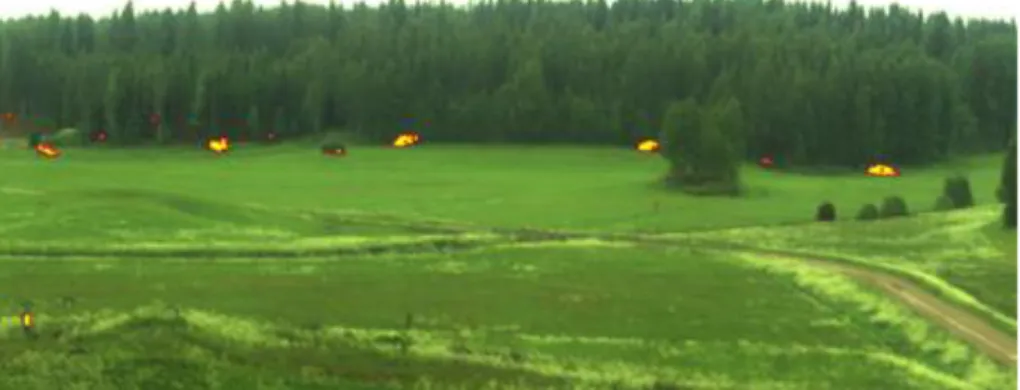
In our example, figure 14 shows that there are apparently differences in spectral signature that are not visible; some dark green pixels are very uncommon, other dark green pixels are very common, even if the colors are very similar to the human eye. The left picture shows a magnified part of the image in figure 13 whereas the right picture shows what it looks like when each pixel in the left image is colored according to how uncommon that particular signature (“color”) is. White means very uncommon, black means very common. Combining the colors from figure 13 with the abnormality values from figure 14, we create an image where the objects in the scene that sticks out in the sense of spectral signature also stick out for the human eye. We do that by coloring abnormal pixels with a color that sticks out from the scene. In figure 15 areas in the image with high uncommonness are visualized as yellow with red borders (since these colors clearly stick out from the mainly green image). In this example, the view is dominated by nature and natural objects (that is, a lot of chlorophyll). The few man-made objects in the scene try to mimic the natural colors (camouflage), and are thus difficult to see with the naked eye. However, the hyperspectral signatures of the camouflage do differ from that of the vegetation, and since the vegetation is dominant (covering a large part of the view), the camouflage signatures are relatively uncommon. Thus, coloring all pixels with uncommon spectral signature reveals most of the man-made object, making it clear that there is much more information in a hyperspectral image than what the human eye can see.
Even if it has been around for more than a decade, hyperspectral imaging and visualization thereof is still to be regarded as an emerging technique. The recent advent of faster and less expensive imagers is expected to enable more applications. Consumer applications are not likely to appear for a long time, but hyperspectral imagers might well become a part of our lives in the same ways as satellites and radars – we do not have them ourselves, but we all know about them and many of us are used to look at visualizations of their imagery.
Visualizing sound
Finally, some sensors, such as microphones, give data that do not have a natural visual form at all. But using several microphones, we can in fact create something like an image! A microphone that registers sounds cannot tell the location of the sound source. However, if two or three microphones are connected, the sound wave will hit the microphones at slightly different times. This fact can be exploited in order to compute the direction to the source. If several such multi-microphones are available, they can together pinpoint the source and reveal its location. Several sound sources can be kept track of, and the results be visualized.
When visualizing sound sources, the first choice is where to visualize. Van der Sande et al.53
chose to do the visualization in the camera view, while Sidenbladh et al.39 do the visualization
on a map.
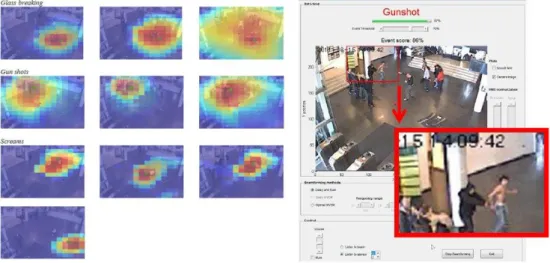
Let us first look at visualization of sounds in the camera view. In figure 16, the intensity of the sound is mapped into the camera view of a surveillance camera, and the operator can see in which parts of the view high sound levels are produced. A color map somewhat similar to the thermal camera visualization above is used to visualize the sound intensity – red for very intense sound, yellow for less intense sound, blue for low sound. In addition, a classification of the sound is given (“Scream”) together with a confidence of the classification (92%). Several examples are given in figure 17, including one camera view without sound. Note that the sound map is made semi-transparent as to not hide the camera view completely.
The alternative approach is to map the sound intensity into a more traditional map of the area. In figure 18 (left), a group of people comes marching, singing, and shouting. The group enters a square which is equipped with microphones along the walls, and a sound intensity map is created. The sound map is shown in figure 18 (right).
A few minutes later, one person in the group draws a gun and fires a few shots, see figure 19 (left) where the person is marked with a yellow ellipse. These shots are pinpointed by the microphones, and the position of the shooter is displayed on the map, see figure 19 (right). Five microphone duos/trios are placed along the walls around the square, each of them giving a direction to the gunshots. Where all this directions meet, the position of the gunshots is marked. Since the positions of the cameras are known, the position of the shooter can also be visualized directly in one of the camera views (the yellow blob in figure 8).
These examples illustrate how sensor data that has no direct correspondence to imagery can be turned into a spatial map and visualized for human interpretation.
Microphone arrays are commercially available and inexpensive (for example, they can be found on many personal cars), but the algorithms for processing and visualization are less mature and the consumer applications less obvious. Thus, this can be regarded as an emerging technology that is currently finding its way into the security market but will probably not be seen much by the general public.
Conclusion
In video surveillance systems of today, there are sometimes hundreds of cameras connected to control centers. Typically, a subset of the camera views are displayed on a number of screens or video walls, and human operators monitor the imagery, trying to assess the situation and detect incidents and threats. There are a number of problems associated with this, and in this paper I have categorized, described and discussed several visualization techniques invented in recent years in order to tackle these problems. Some of these visualization techniques are commercially available, while others are in an experimental stage. Moreover, there are several types of cameras and other sensors give data that do not have natural visual form, such as images from non-visual wavelengths or data without image form. A few methods for visualizing such data are described as well.
To conclude, let me make a few predictions about the usage of these technologies in our near future. Some of these sensor and visualization technologies will enter the lives of the general public, while others will remain in the defense and security areas. Automated analysis of behavior will be used extensively for security, sports, entertainment, and automotive applications, and the analysis results will be visualized in various ways. As cameras become ever more ubiquitous and analysis capabilities improve, the need for privacy protection will increase. This will push privacy enhancing technologies and visualizations, not only in surveillance, but basically everywhere. Hiding identities while visualizing contexts, patterns, and incidents is thus likely to be done automatically in future camera/computer systems.
Using 3D models for visualization of video will be more common as the availability of good enough 3D models improve. City centers, including large indoor spaces like shopping malls, are currently being modelled, and will presumably be the first targets. Video making 3D models “come alive” can then be used for security, safety as well as public information.
Regarding visualization of non-visual imagery, the use of thermal cameras will expand with the advent of consumer hardware. The availability of thermal imagery for home made apps, videos, … enables a plethora of artistic activities that we are yet to see.
Finally, more specialized sensors like hyperspectral imagers and microphone arrays will not be a part of our daily lives in the near future. However, mappings and visualizations of such data might well be comparable to the general public’s current experience of radars and thermal cameras – most people have seen visualizations of such data, but only a few have actually used the sensors.
Figure 1: Control centers with video walls for surveillance of a city (left) and a bank (right). (Photos from Visual Tools, Spain).
Figure 2: In the top row, images from a surveillance camera are shown. No abnormal behavior is detected. In the bottom row, a fight is detected. In this particular case, a detected fight is indicated by a red border. (Images from the ADABTS project19).
Figure 3: Two cameras as virtual projectors, projecting the camera imagery onto the 3D computer graphics model. (Graphics from the Swedish Defence Research Agency, FOI)
Figure 5: Traditional visualization of surveillance camera views as done on a video wall; one screen per camera. (Images from the Video Flashlight system.31)
Figure 6: Camera views visualized in a 3D computer graphics environment. (Images from the Video Flashlight system.31)
Figure 7: Hiding identities by covering persons with uniform color. (Image from the Swedish Defence Research Agency, FOI).
Figure 8: Visualizing groups and actions without revealing identities. Groups are identified from the direction of arrival, i.e., persons arriving from one direction are masked with red and persons arriving from another with green. (Image from the Swedish Defence Research Agency, FOI).
Figure 9: The author in visual and thermal imagery. The thermal images are visualized as "white hot" and "black hot". The coffee cup is half full with hot coffee, the glass with cold water. The cakes just came out of from the fridge. The warm spot between the cake and the glass is where the coffee cup stood just before taking the pictures, thus slightly heating the table.
Figure 10: The scene depicted in Figure 9 seen by a thermal camera and visualized with two different color maps (”rainbow” and ”iron”).
Figure 11: Left: A satellite image of the Mississippi river flooding in Illinois. Right: A false colored image visualizing which areas are covered with water (blue). Vegetation is colored yellow, and soil and buildings grey. (Images acquired using the Worldview-2 satellite and made publically available by the Satellite Imaging Corporation).
Figure 12: A graph showing the spectral signature of olive green matte paint in the visible and near infrared wavelengths (0,3-1 micrometer). Each pixel in a hyperspectral image corresponds to such a graph.
Figure 13: Image from a hyperspectral camera. The three wavelengths corresponding to red, green and blue light are used for creating a visual image. (Image from the Swedish Defence Research Agency, FOI).
Figure 14: Left: Magnified part of the previous image. Right: Each pixel in the left image is colored according to how uncommon that particular signature (“color”) is. White means very uncommon, black means very common. (Image from the Swedish Defence Research Agency, FOI).
Figure 15: Areas in the image with high uncommonness are visualized as yellow with red borders (since these colors clearly stick out from the mainly green image). The uncommon areas look natural green to the human eye, but the hyperspectral camera discovers their uncommonness. (Image from the Swedish Defence Research Agency, FOI).
Figure 16: Sound intensity mapped to a surveillance camera view. In addition, a classification of the sound is added textually. (Images from the the Netherlands Organisation for Applied Scientific Research, TNO).
Figure 17: Left: Examples of sound intensity maps from various sources overlayed on camera views. Right: One of the camera views without overlayed sound for reference. (Images from the the Netherlands Organisation for Applied Scientific Research, TNO).
Figure 18: Left: A group of shouting people. Right: The sound visualized as a sound intensity map. (Images from Sidenbladh et al.32).
Figure 19: Left: A person (marked with a yellow ellipse) fires a gun. Right: The position of the gunshots are pinpointed by the microphones and visualized on the map. (Images from Sidenbladh et al.32).
1 R. C. Gonzales and R. E. Woods, Digital Image Processing, Prentice Hall, 2008.
2 M. Sonka et al., Image Processing, Analysis, and Machine Vision, Thomson Engineering,
2007.
3 R. Hartley and A. Zisserman, Multiple View Geometry in Computer Vision, Cambridge
University Press, 2004.
4 R. Szeliski, Computer Vision: Algorithms and Applications, Springer London Ltd, 2010.
Available online at szeliski.org/Book/
5 C. M. Bishop, Pattern Recognition and Machine Learning, Springer, 2006.
6 S. J. D. Prince, Computer Vision: Models, Learning and Inference, Cambridge University
Press, 2012. Available online at www.computervisionmodels.com
7 G. Bradski and A. Kaehler, Learning OpenCV: Computer Vision with the OpenCV Library,
O'Reilly Media, 2008.
8 J. E. Solem, Programming Computer Vision with Python: Tools and algorithms for analyzing images, O'Reilly Media, 2012.
9 R. C. Gonzalez, R. E. Woods and S. L. Eddins, Digital Image Processing Using MATLAB,
Gatesmark Publishing, 2009.
10 K. Ikeuchi, Computer Vision – A Reference Guide, Springer, 2014.
11 I. Ragnemalm, Polygons Feel No Pain, http://www.computer-graphics.se, 2014.
12 “Suspect in JFK Airport Security Breach Arrested”, Fox News, Jan 18, 2010. Associated
Press.
13 ”Terminal at Newark airport evacuated after man enters secure area through exit”, NJ News,
April 5, 2010.
14 According a subway system security manager interviewed by the author, falls in stairs were,
contrary to public belief, a more common reason of injury than violence. If this can be generalized to other subway systems is beyond the knowledge of the author.
15 Y. Tian, “Robust Detection of Abandoned and Removed Objects in Complex Surveillance
Videos”, in IEEE Transactions on Systems, Man, and Cybernetics, Vol. 41, Issue 5, 2011.
16 J. Ferryman et al., “Robust abandoned object detection integrating wide area visual
surveillance and social context”, Pattern Recognition Letters, Vol. 34, Issue 7, 2013.
17 Abandoned luggage detection was also the theme of the 9:th IEEE International Workshop on Performance Evaluation of Tracking Systems (PETS), New York, 2006.
18 A related problem is that most people leaving their luggage are not bombers, so even if
automatic detection could be done, bomb squads cannot run to the place each time a piece of abandoned luggage is detected. For example, in a major subway system such as the London underground, there can be close to one hundred forgotten bags on a single day.
19 A. Stedmon et al., “Tracking a suspicious person using CCTV: But what do we mean by
suspicious behaviour?”, Contemporary Ergonomics 2008, Taylor & Francis, London, 2008.
20 T. Troscianko et al., “What happens next? The predictability of natural behaviour viewed
through CCTV cameras,” Perception, Vol. 33, pp. 87–101.
21 J. F. P. Kooij et al., “A Non-parametric Hierarchical Model to Discover Behavior Dynamics
from Tracks”, European Conference on Computer Vision, 2012.
22 D. Kuettel et al., “What’s going on? Discovering Spatio-Temporal Dependencies in
Dynamic Scenes”, International Conference on Computer Vision and Pattern Recognition (CVPR), 2010.
23 An internet search on “abnormal behavior detection” gives numerous examples of currently
24 Surveillance of unattended baggage and the identification and tracking of the owner
(SUBITO), the European Union’s Security Research Programme, Topic SEC-2007-2.3-01, 2009-2011.
25 Suspicious and abnormal behaviour monitoring using a network of cameras & sensors for situation awareness enhancement (SAMURAI), the European Union’s Security Research
Programme, Topic SEC-2007-2.3-04, 2008-2011.
26 Automatic detection of abnormal behaviour and threats in crowded spaces (ADABTS), the
European Union’s Security Research Programme, Topic SEC-2007-2.3-04, 2009-2013. www.adabts-fp7.eu
27 Future Attribute Screening Technology (FAST), United States Department of Homeland
Security.
28 J. Ahlberg, “Intelligent Surveillance: Towards More Efficient Crime Prevention While Still
Considering Aspects of Privacy”, in J. Hellström, M. Eriksson, and N. Granholm (editors)
Strategic Outlook 2011, FOI Swedish Defence Research Agency, 2011.
29 A. A. Adams and J. M. Ferryman, “The future of video analytics for surveillance and its
ethical implications”, Security Journal, January 2013.
30 F. Porikli et al., “Video surveillance: past, present, and now the future”, IEEE Signal Processing Magazine, Vol. 30, Issue 3, 2013.
31 Kinect is an accessory to the game console XBox analyzing the movements of the gamers. 32 P. Dollar et al., “Pedestrian Detection: An Evaluation of the State of the Art”, IEEE Transactions on Pattern Analysis and Machine Intelligence, Vol. 34, Issue 4, 2012.
33 For commercially available systems, see, for example, www.autoliv.com or
www.bmw.com.
34 The KTH Human Action Database. www.nada.kth.se/cvap/actions 35 UCF Action Recognition Data Set. crcv.ucf.edu/data/UCF101.php
36 M. Marszalek et al., ”Actions in Context”, IEEE Conference on Computer Vision and Pattern Recognition, 2009. www.di.ens.fr/~laptev/actions/hollywood2
37 M. C. Liem and D. M. Gavrila, “A comparative study on multi-person tracking using
overlapping cameras”, International Conference on Computer Vision Systems (ICVS), 2013
38 Sawhney et al., ”Video Flashlights - Real Time Rendering of Multiple Videos for
Immersive Model Visualization”, Thirteenth Eurographics Workshop on Rendering, 2002.
39 H. Sidenbladh et al., New Systems for Urban Surveillance, FOI Swedish Defence Research
Agency, 2005.
40 K. Gunnartz, Välkommen till övervakningssamhället, Forum/Bokförlaget DN, 2007.
Available online at www.kristoffergunnartz.com
41 L. Hempel and E. Töpfer, CCTV in Europe, Urban eye paper no. 15, 2004. Available online
at www.urbaneye.net
42 Privacy Preserving Perimeter Protection Project (P5), the European Union’s Security
Research Programme, Topic SEC-2012.2.3-1, 2013-2016. www.p5-fp7.eu
43 ”Ökad övervakning – ökad integritet”, Aftonbladet, September 20, 2005.
44 ”JK välkomnar smart övervakningskamera”, Dagens Nyheter, September 13, 2005. 45 ”Kräv intelligent övervakning”, Svenska Dagbladet, September 20, 2005.
46 If the object is really hot, it will emit visual light as well. The sun is a well-known example. 47 FLIR One. www.flir.com/flirone
48 A wavelength band is a range of wavelengths, for example light seen as red has a
49 The human visual system (HVS) is typically modeled as sensing a combination of red,
green and blue light, that is, the dimensionality of the color space equals three. Combining these, all visible colors are created. Common digital cameras thus have sensor elements for these three colors, and images to be displayed on a computer screen are represented as numbers telling the amounts of red, green and blue (RGB) in each point. That is, even if the color space dimensionality of the HVS would be higher than three (which it arguably is), a computer screen cannot reproduce more than three color dimensions anyway.
50 J. V. Stone, Vision and Brain: How We Perceive the World, MIT Press, 2012.
51 J. M. Findlay and I. D. Gilchrist, Active Vision: The Psychology of Looking and Seeing,
OUP Oxford, 2003.
52 D. Borghys et al., “Hyperspectral Anomaly Detection: Comparative Evaluation in Scenes
with Diverse Complexity”, Journal of Electrical and Computer Engineering, 2012.
53 J. v. d. Sande et al., Sound Source Localization and Analysis, ADABTS26 deliverable 5.2,