CESIS
Electronic Working Paper Series
Paper No.106
THE LISBON AGENDA FROM 2000 TO 2010
Börje Johansson, Charlie Karlsson, Mikaela Backman and Pia Juusola
The Lisbon Agenda, from 2000 to 2010
Börje Johansson, Charlie Karlsson, Mikaela Backman* and Pia Juusola
Jönköping International Business School and the Royal Institute of Technology P.O. Box 1026, SE-551 11 Jönköping, Sweden
Abstract
The Lisbon Agenda was approved in mars 2000 and at that time, the European Union was facing economic prosperity. Even so, globalization and new knowledge economies were becoming an increasing threat and the EU was in need of a transformation in its economy and society. The Lisbon Agenda was set to make the EU the most competitive, knowledge-based economy in the world, and at the same time preserving, or even improving social cohesion and maintain environmental sustainability. Another important motivation for the Lisbon Agenda was the perception that the EU was lagging behind the US and other major economies.
The main instrument that was put forward was open method of co-ordination (OMC) that includes indicators, benchmarking, peer pressure, and best practise. The time-period was set for ten years and the midterm evaluations found that the goals had not be reached. Due to the lacking results, the Lisbon Agenda was forced to change some of the implementation processes. The many quantitative goals were reduced, and only the goal to dedicate three percent of GDP to R&D stayed in its original shape. The main goals were now on growth, and jobs.
Keywords: Lisbon Agenda, knowledge economy, goals, instruments Jel-codes: F 00, N 24
1. Introduction ...4
1.1 The European Problem...4
1.2 The Productivity Problem ...7
1.3 Purpose ...8
1.4 Outline of the Report...9
2. The Lisbon Agenda ...10
2.1 Background – The ‘New’ Economy Is a Knowledge Economy ...10
2.2 The Goals of the Lisbon Agenda...13
2.3 The Instruments of the Lisbon Agenda ...14
2.3.1 Microeconomic Policies...15
2.3.2 Employment Guidelines...16
2.3.3 Open method of coordination...17
2.4 The mid-term review; “Lisbon Agenda 2005”...19
2.4.1 The Wim Kok Report...20
2.4.2 Goals...21
2.4.3 Instruments ...21
2.5 Differences between “Lisbon Agenda 2000” and “Lisbon Agenda 2005”...22
3. The Lisbon Arenas ...24
3.1 The Macroeconomic Arena...24
3.2 The Microeconomic Arenas ...25
3.2.1 The Institutional Arena ...25
3.2.2 The Infrastructure Arena ...25
3.2.3 The Policy Arena...26
3.2.4 The Spatial Arena...26
3.2.5 The geographic arena ...27
3.2.6 The Markets for New Technology ...28
3.2.7 The Markets for Goods and Services ...30
3.2.8 The Markets for Capital ...32
3.2.9 The Markets for Entrepreneurship ...33
3.2.10 The Labour Markets...33
3.2.11 The Markets for Higher Education ...35
4. Conclusions ...38
References ...39
1.
1. INTRODUCTION
1.1 The European Problem
1When the Lisbon Agenda was approved in mars 2000 the European Union was facing economic prosperity with for example high growth, net job creation and healthy balance of payments. Even so, globalization and new knowledge economies were becoming an increasing threat and the EU was in need of a transformation in its economy and society. Towards this background the top priorities of the Lisbon Agenda was set to create jobs and growth (Doc/00/07, Brussels 2000). Yet another important motivation for the Lisbon Agenda was the perception that the EU was lagging behind the US. However, from a historical perspective this lag was a rather recent phenomenon. Actually, the economies in Western Europe, after a period of rapid reconstruction after World War II, grew at an unprecedented rate until the first oil crisis in 1973. During this period, output per hour in Western Europe grew on average with more than 4 percent per year, which was substantially faster than in the US. In a catch-up process, the countries in Western Europe adopted the best-practice production and new technologies that it failed to adopt before and during World War II (Temin, 2002).
It was first after the oil crisis in 1973 that the economies in Western Europe ran into problems. Even if they continued to catch up with the US in terms of productivity, they had severe problems with inflation and unemployment, i.e. stagflation. There were substantial differences between the various countries in Western Europe but in the early 1980s the level of unemployment started to exceed that in the US. It has been suggested that the institutions that served Western Europe well during the Bretton Woods era, were less successful after the break down of Bretton Woods (Cameron & Wallace, 2002).
However, irrespective of the severe unemployment problems in Western Europe, it was first in the mid-1990s that Western Europe started to fall behind the US in growth performance. It has, for example, been estimated that in 1995, the output per hour in Western Europe was about 94 percent of the level in the US, but in 2003, it was only equal to 85 percent (Gordon, 2004). Furthermore, Western Europe has also fallen behind the US in terms of the rate of labour utilization. Working hours declined both in Western Europe and in the US in the early post-war period but while the decline halted in the US in the mid 1970s, it continued in Western Europe. Around 1960 Western Europeans worked approximately two percent more hours per year than workers in the US and the labour force participation was about 16 percent higher. In 2004, workers in Western Europe worked an average 15 percent fewer hours than their counterparts in the US and the labour force participation ratio was nine percent lower (Gordon, 2004). The gap between the Western Europe and the US can also be illustrated in the following manner: In 2002
1 When we discuss the situation and the developments in Europe in this report, we mainly disregard the high variation between different regions in Europe. These variations are very substantial and very important. However, it is beyond the scope of this report to analyze and discuss these intra-European variations.
GDP per capita in the Euro Area was 30 percent lower than in the US according to data from the 2005 OECD Economic Survey for the Euro Area. Two-thirds of the gap can be attributed to lower labour resource utilization and one-third to lower labour productivity.
Given the discouraging results for Western Europe above it is natural to ask four questions: • How big is the productivity difference between Western Europe and the US?
• Why has Western Europe started to lag in productivity growth compared with the US? • Why is the labour resource utilization so low in Western Europe?
• Why has the boom in information and communication technologies (ICT) had less effect in Western Europe than in the US?
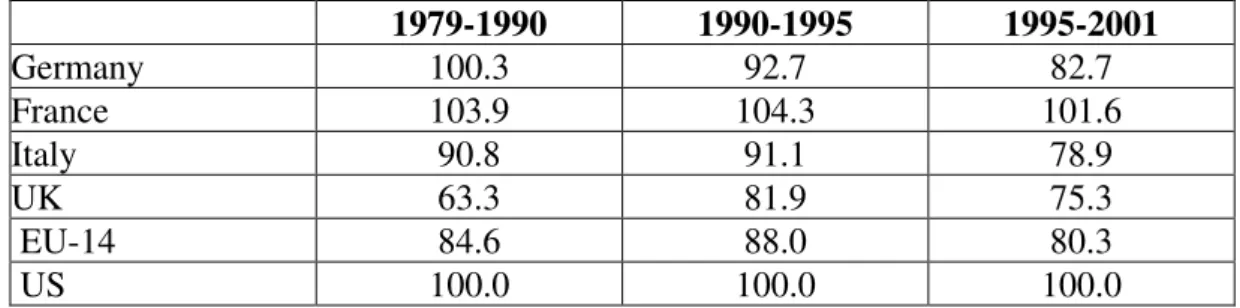
The difference in labour productivity levels is illustrated in Table 1.1. Only France can match the US but the French good performance is a chimera and the result of a high capital-labour ratio and poor labour market performance that has kept young and low-skilled workers out of employment and encouraged the substitution of capital for labour (Blanchard, 2004; van Ark, Frankema & Duteweerd, 2004).
Table 1.1 Labour productivity levels in manufacturing in EU countries compared to the US (value added per hour worked).
1979-1990 1990-1995 1995-2001 Germany 100.3 92.7 82.7 France 103.9 104.3 101.6 Italy 90.8 91.1 78.9 UK 63.3 81.9 75.3 EU-14 84.6 88.0 80.3 US 100.0 100.0 100.0
Source: O’Mahony & Ark (2003)
Several hypotheses have been launched as explanations to why productivity growth started to lag in Western Europe compared to the US in the mid-1990s. Examples of explanations proposed are (i) low R&D investments, (ii) a low rate of innovation, (iii) lack of human capital, (iv) a low rate of entrepreneurship, (v) lack of venture capital, (vi) a low rate of ICT adoption, and (vii) regulated labour markets. Of these explanations, one might question the role of regulated labour markets for an unsatisfactory productivity performance, since labour markets in Western Europe have a long history of regulation – a regulation that did not prevent a very rapid productivity growth in the early post-war period. Growth accounting exercises show that a substantial share of the weakened growth performance in Europe relative to the US in the 1990s compared with the 1980s can be explained by a significant weakening of total factor productivity (TFP)2. in
Europe but also by lower investments in ICT capital in Europe (Schreyer, 2001; van Ark, et al., 2002; Vijselaar & Albers, 2004; Daveri & Silva, 2004).
It has been claimed that the low labour resource utilization in Western Europe is due to high preferences for leisure. The underlying idea is that it is natural for well paid and secure workers to take longer holidays and shorter working hours as a substitute for higher wages (Blanchard, 2004), a substitution, which according to Prescott (2004) is stimulated by disincentive effects of taxation. However, these two conventional explanations have been criticized by Alesina, Glaeser & Sacerdote (2005) since they fail to account for relative changes in behaviour in the US and Western Europe. They argue that the short hours worked in Western Europe is the cumulative effect of labour union policies and labour market regulation. Furthermore, compared to the US, changes in the labour force participation have not shown any strong trend in Western Europe. The US has succeeded to integrate women and teenagers much more effectively in the labour force than Europe (Gordon, 2004). In addition the US has managed to maintain a higher participation among older and unskilled workers.
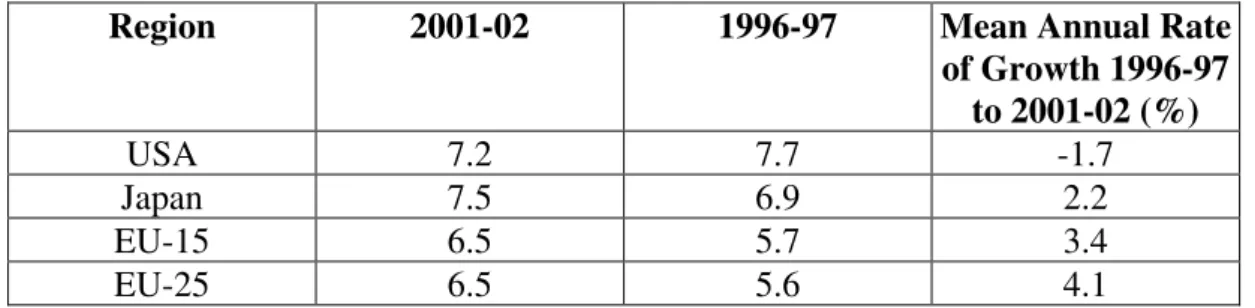
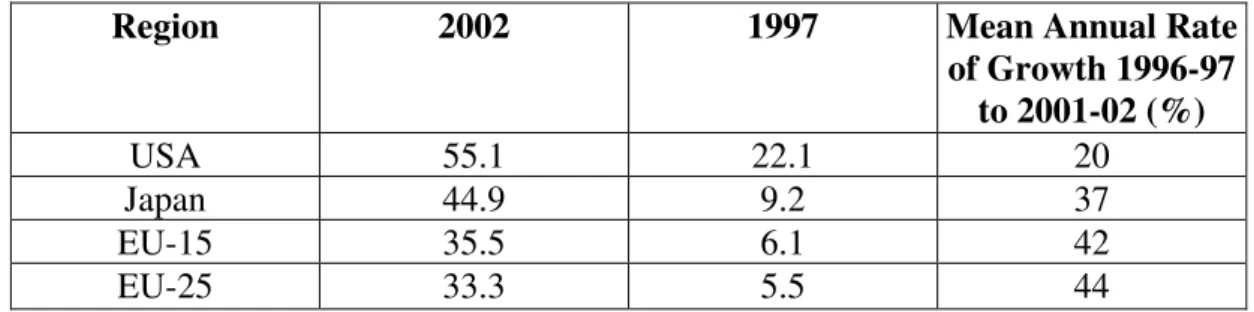
Concerning ICT, it is very intriguing that while the consumers in some countries in Western Europe have been quick to adopt new ICT products the overall picture is that Western Europe is lagging behind the US and Japan. Except for a few small countries, such as Sweden and Finland, manufacturing and service industries in Western Europe have been much less alert at exploiting the potential for new markets and new ways of organizing production and distribution. It has been claimed that the most important difference between the US and Western Europe is that firms in Western Europe have failed to change the way they do business in response to the new technologies (Gordon, 2004). Table 1.2 illustrates the expenditures on ICT in the US, Japan and the EU, and Table 1.3 provides information about Internet penetration.
Table 1.2 Expenditures on ICT as a percent of GDP
Region 2001-02 1996-97 Mean Annual Rate
of Growth 1996-97 to 2001-02 (%) USA 7.2 7.7 -1.7 Japan 7.5 6.9 2.2 EU-15 6.5 5.7 3.4 EU-25 6.5 5.6 4.1
Source: Archibugo & Coco (2005)
2 TFP is often called disembodied technological change since the change is not associated with the “quality” of
Table 1.3 Internet Users as a Percent of the Population
Region 2002 1997 Mean Annual Rate
of Growth 1996-97 to 2001-02 (%) USA 55.1 22.1 20 Japan 44.9 9.2 37 EU-15 35.5 6.1 42 EU-25 33.3 5.5 44
Source: Archibugo & Coco (2005)
Moreover, productivity growth in Western Europe compared to the US seems to have been particularly slow in three main ICT-using service sectors, namely, retail, distribution and financial services (O’Mahony & van Ark, 2003, Eds.). It is quite possible that the extent of labour market regulation in Western Europe significantly slows the speed of adoption of new technologies and new ways of doing business (Gust & Marquez, 2004). However, it should be noted that labour market regulations differ widely across the countries in Western Europe, which make generalizations difficult.
1.2 The Productivity Problem
One basic factor determining labour productivity is the capital-labour ratio. This implies that investments in physical capital are an important source of labour productivity growth. However, investments as a source of labour productivity growth in the long run in the absence of technological progress have been questioned. Moreover, aggregate growth theory precludes any long-run effects from increased levels of capital formation. However, productivity should increase as long as new investments imply that old techniques are being replaced by modern, best-practice techniques. There are indications that investment flows between countries in Western Europe have increased over time possibly as an effect of greater microeconomic integration, which may have had overall positive effects on labour productivity (Blanchard & Giavazzi, 2002). Some of these effects may take time to fully materialize.
There are, however, other factors but physical investments, which influence labour productivity. One such factor is efforts to augment the quality of the labour force in terms of education and skills. It is obvious that the higher the quality of the labour force, the higher the labour productivity. It is shown by Andersson, Gråsjö & Karlsson (2007) that accessibility to human capital (university education) has a significant positive influence on the level of labour productivity in Swedish municipalities. Further-more, it is well-known that experience increases labour productivity. An early example is Arrow (1962), who examined how production experience raises labour productivity as a result of learning-by-doing.
Second, we have technological progress, which plays a central role for labour productivity growth by on the one hand providing more efficient production methods and on the other hand introducing new products or improved versions of existing products. This implies that technological progress is the result of innovations. In addition diffusion of new technology is
fostered by absorptive capacity, which may be enhanced both by education and experiences from own R&D.
It is not straight-forward to capture the role of an abstract concept such as innovation for labour productivity growth. However, the economics’ literature contains a number of attempts to characterize the innovation process. Recent growth models capture innovation via an R&D sector, which affects the variety of inputs used in production (Romer, 1990), or their quality (Aghion & Howitt, 1992).
Empirically, R&D has been linked to productivity and productivity growth in a number of studies. Cameron, Proudman & Redding (2005) use an open economy model of innovation and technology transfer, and find for a panel of UK manufacturing industries, R&D spending affects productivity growth directly through its effects on innovation, whilst international trade facilitates technology transfer across countries. Andersson & Karlsson (2007) show that accessibility to company R&D and University R&D in 1993 had a significant positive effect on productivity growth in Swedish municipalities during the period 1993-2001.
In this connection, we must also observe that the flexibility and efficiency of the labour market is an important determinant of an economy’s capacity to carry through and take advantage of innovative activities.
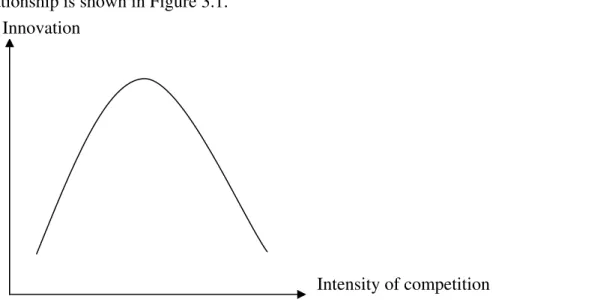
Another important issue dealt with in both the theoretical and empirical economic research concerns the effects of market structure on innovation and productivity growth. However, the relationship is more complicated than a direct causal link between increased competition and greater productivity growth. There is some evidence that competition, measured by an increased number of competitors, is associated with higher total factor productivity growth (Nickell, 1996). However, its impact on innovative activity and the imitation of ideas is more complex. From a pure Schumpeterian perspective, more competition decreases the reward to, and thus, the volume of innovation. However, the incentives to firms to escape competition by innovating normally more than compensate for this effect (Aghion, et al., 2001; Aghion, Harris & Vickers, 1997). Furthermore, some imitation of ideas is improving productivity to the extent that it stimulates neck-to-neck competition. However, too much innovation can have adverse effects.
There are also other factors of importance for productivity performance. Capital markets, which can easily accommodate changes in the demand for different types of physical investment without significant distortions due to for example financial constraints or regulation, will be more efficient in responding to structural changes in the economy driven by innovation or international competition. It has also been found that financial market pressure affecting the cost of capital and shareholder control has significant effects on firm productivity (Nickell, Nicolitas & Dryden, 1997).
1.3 Purpose
Against the above presentation of the European problem with special focus on the problem with an unsatisfactory productivity growth, the purpose of this report is to discuss and to evaluate the potential of the Lisbon Agenda to cure the economic problems that EU is facing. The issue is to
assess the attempts by EU policies to promote growth in GDP per capita, where policies include both R&D, innovation support and other means to influence industrial dynamics.
1.4 Outline of the Report
This report is structured as follows: In Chapter two we present and discuss the emerging knowledge economic as a background to the Lisbon Agenda, the goals of the Lisbon Agenda and the instruments of the Lisbon Agenda. Chapter three is devoted to a discussion of the arenas and markets where the Lisbon Agenda shall be implemented and also includes the mid-term review of the Lisbon Agenda made in 2005. Conclusions are presented in Chapter four.
2. THE LISBON AGENDA
Currently, the Lisbon Agenda plays a central role in discussions in Europe about economic policies in general and about policies related to the knowledge economy and innovation in particular. In this chapter, we present some of the background to the formulation of the Lisbon Agenda, the goals of the Lisbon Agenda, and its instruments.
2.1 Background
–The ‘New’ Economy Is a Knowledge Economy
The unexpected economic strength of in particular the US economy in the late 1990s stimulated much discussion about the ‘new’ economy (Castells, 1996), and what the emergence of a ‘new’ economy implied for the sustainability of the economic expansion in future years. The main argument was that a cluster of ICT-related innovations with their associated productivity growth was leading to a ‘new’ economy with a capacity to deliver an expansion of employment and improved standards of living (Johansson, Karlsson & Stough, 2006; Temple, 2002). Based on the impressive performance of the US economy in the 1990s, it was suggested in the political debate but also by many economists that the future welfare of nations was dependent upon their ability to adjust to and take advantage of these transformations. Countries unable to adjust to these transformations were doomed to loose in the competitive race. In the European debate, it was argued that Europe will continue to have a slower economic growth than the US because of insufficient adjustments to the rules of the ‘new’ economy (Soete, 2001; Daveri, 2002). It was also claimed that if Europe cannot upgrade its knowledge base, the traditional European model with public financing of welfare, education, and health care is threatened (cf. Rifkin, 2004). The idea that there is a ‘new’ economy certainly fascinated the business world, the political community, and the press as well as substantial parts of the academic community, in particular until the stock market crash early in the new century. However, even if the optimism was exaggerated, it is obvious that major changes have taken place in recent decades:
• The exploitation of knowledge has become more and more systematic, with an increasing propensity of firms to transform knowledge into innovations in a search for profits and growth opportunities (Andersson, 1985; Granstrand, 1999; Suarez-Villa, 2000).
• The transfer of commodities, financial resources, human capital, and information across space has become much easier and much cheaper (Antonelli, 2001; Freeman & Louca, 2001; Held & McGrew, 1999).
• The number of players able to enter both old and new fields has increased (Archibugi, Howells & Michie, 1999, Eds.; Mowery & Nelson, 1999).
This is not exactly the ‘new’ economy. Rather, it is the knowledge economy, where knowledge, know-how, skills and competence play a central role in economic life. One of the major concerns behind the Lisbon Agenda is that Europe is lagging behind in the emerging knowledge economy. Still the total volume of resources spent on R&D within the EU is rather impressive. The combined R&D budget for EU-25 is more than 70 % of that of the US and two-thirds larger than that of Japan (Archibugo & Coco, 2005). R&D in EU-25 also seems to be effective in the sense
that its R&D in the early 2000s produces 1.49 science and technology articles per one million US dollar R&D expenditure compared to 0.82 for the US and 0.60 for Japan (Archibugo & Coco, 2005). However, this result can also be an indication of a potential problem in the sense that too much R&D in EU-25 is devoted to basic research and too little to applied research and development. On the other hand, one might question the quality of R&D in EU-25 given that despite its volume and high publication rate it produces so few Nobel Prize laureates. It also turns out that if we measure the number of scientific and technical articles per one million inhabitants, the US outperforms Europe (See Table 2.1). It should be observed that scientific literature has become more and more relevant for high-technology industries in recent decades as an important source of industrial competitiveness (Tijssen, 2001).
Table 2.1 Number Scientific and Technical Articles per One Million Inhabitants Region 2000-2001 1995-1996 Mean Annual Rate
of Growth 1995-96 to 2000-01 (%) USA 700 759 -1.6 Japan 444 390 2.6 EU-15 556 510 1.7 EU-25 493 448 1.9
Source: Archibugo & Coco (2005)
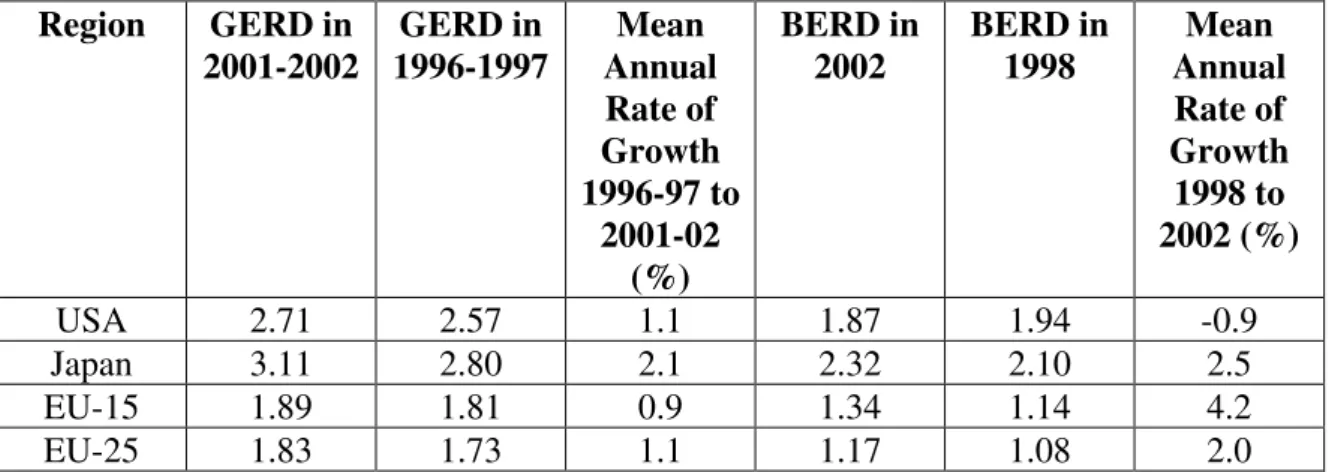
However, looking upon the R&D intensity another picture emerges. Table 2.2 shows that Europe is lagging behind both the US and Japan in terms of R&D intensity. We see that the R&D intensity is about one-third lower in EU than in the US. This holds both for Gross R&D Expenditures (GERD) and for Business Expenditure on R&D (BERD) and there is no major change in this situation from the late 1990s to the early 2000s. The gap in R&D has been interpreted as a technology gap to the disadvantage of Europe.3
Table 2.2 Gross R&D Expenditure (GERD) and Business Expenditure on R&D (BERD) as a % of GDP.
3 Concerns about a technology gap between Europe and the US go back at least to the 1960s (Servan-Schreiber,
1968; Patel & Pavitt, 1987; Archibugi & Pianta, 1992).
Region GERD in 2001-2002 GERD in 1996-1997 Mean Annual Rate of Growth 1996-97 to 2001-02 (%) BERD in 2002 BERD in 1998 Mean Annual Rate of Growth 1998 to 2002 (%) USA 2.71 2.57 1.1 1.87 1.94 -0.9 Japan 3.11 2.80 2.1 2.32 2.10 2.5 EU-15 1.89 1.81 0.9 1.34 1.14 4.2 EU-25 1.83 1.73 1.1 1.17 1.08 2.0
Source: Archibugo & Coco (2005)
An often used indicator of knowledge production is patents. Table 2.3 gives information about patenting in the US, Japan, and the EU. What is astonishing in the table is the rapid growth of patents granted and applied, indicating an increased importance of intellectual property rights and thus control over new knowledge. We also see that Japan outperform the EU in terms of patents grated at USPTO and that the US and Japan match the EU in terms of patents applied at EPO. However, the higher growth rates in Europe indicate that it perhaps is catching up but has a very long way to go to match Japan at USPTO.
Table 2.3 Patents Granted at the USPTO and Patents Applied at the EPO per One Million Inhabitants Region Mean Annual Granted Patents at USPTO 2002-03 Mean Annual Granted Patents at USPTO 1997-98 Mean Annual Rate of Growth 1996-97 to 2000-01 (%) Mean Annual Applied Patents at EPO 2002-03 Mean Annual Applied Patents at EPO 1997-98 Mean Annual Rate of Growth 1997-98 to 2000-01 (%) USA 301 260 3.0 107 80 5.9 Japan 277 214 5.3 135 106 5.1 EU-15 71 54 5.6 136 96 7.3 EU-25 59 45 5.7 114 80 7.4
Source: Archibugo & Coco (2005)
This regional perspective must be complemented by a corporate perspective. The in-ternationalization of corporate activities has increased in recent years. In particular, this is true for R&D activities. The internationalization of R&D can be described as a three-dimensional process characterized by (i) the international exploitation of nationally generated innovations, (ii) the international generation of innovations, and (iii) the increasing engagement of firms in international techno-scientific collaborations (Archibugi & Iammarino, 1999 & 2002).
In the rapidly developing knowledge economy, long-term economic growth, employment, and welfare in countries will become more and more dependent upon their capability to generate, appropriate, and use new knowledge (Archibugi & Coco, 2005; Karlsson & Johansson, 2006). It is therefore not surprising that it has become a major political concern to find ways to promote R&D, to foster innovation, and to upgrade the quality of the human capital. These are seen as key conditions for increasing employment and retaining market shares in a more and more competitive world economy. It was concerns of this kind that together with Europe’s unsatisfactory growth performance in the late 1990s led to the formulation of the Lisbon Agenda.
2.2 The Goals of the Lisbon Agenda
The Lisbon Agenda is EU’s strategic plan for its medium term growth. The general goal of the Lisbon Agenda is that Europe shall become the most competitive, knowledge-based economy in the world and at the same time preserving or even improving social cohesion and maintain environmental sustainability. A long list of sub-goals or objectives has been set up to achieve this goal, including the objectives that each member state shall increase R&D expenditures to three percent of GDP, of which two-thirds should come from the private sector, and the employment rate to 70 percent by 2010, which the Commission claims might add three percent to EU GDP by 2010 and add six million jobs. It must be noted that these objectives are very ambitious, perhaps too ambitious (Soete, 2002; Schibany & Streicher, 2003), and thus nearly impossible to attain (Sakellaris & Vijselaar, 2005). The objectives even cover ecological objectives concerning the reduction of emissions of greenhouse gases.
It has become obvious by now that the Lisbon Agenda formulated in 2000 set too many goals. According to a report by the International Monetary fund it has over 100 goals; while Jacobs & Theeuwes (2005) claim that in total 405 different objectives have been set up within the Lisbon Agenda.
It is not clear what the welfare economic arguments are behind all these objectives. Furthermore, it is clear that there are real goal conflicts between the different objectives, which are not dealt with in a proper way. The main purpose of the Lisbon Agenda seems to be to compare national achievements with the European average and to encourage underperforming countries to raise their standards where they under-perform. However, there seems to be a lack of involvement and interest of national policy makers who do not view the Lisbon Agenda as a challenge at the national level.
The Lisbon Agenda has nothing to say about the optimal level of investment in for example higher education or R&D, i.e. the social returns on such investments. There is no guarantee that increasing investments in either R&D or higher education will increase social welfare. This is critically dependent upon the rate of return on theses investments. Naturally, higher investments will only increase social welfare if it is socially profitable.
One should observe that the objectives of the Lisbon Agenda resemble planned economy types of government intervention based upon a top-down approach without making it explicit what the underlying market failures are. The Lisbon Agenda pays no attention to the crucial choice
whether an investment is made by a government or by the market. Government intervention can be justified by the existence of market failures but since governmental failures are prominent in many areas there is no guarantee that governmental intervention is effective.
An interesting aspect is that the Lisbon Agenda does not pay attention to differences between member states. It is well-known that national economies and thus the whole EU can benefit from specialization and exploitation of comparative advantages. It is, for example, not at all given that all member states have a comparative advantage in R&D. The Lisbon objective requiring all member states to invest three percent of GDP does not make economic sense if all member states do not have the same preconditions and resources to carry out R&D.
The Lisbon Agenda ignores the fact that a price has to be paid to become the most competitive and most innovative knowledge economy in the world. Private investments in R&D and innovative and entrepreneurial activities only increase if stronger economic incentives are allowed. Stronger economic incentives generally imply more income and wealth inequality and more uncertainty. Thus, the Lisbon Agenda is internally inconsistent by setting up objectives, which are contradictory. It is not possible to become the most competitive and innovative economy in the world and, at the same time, preserve or even improve social cohesion.
2.3 The Instruments of the Lisbon Agenda
The Lisbon Agenda suggested a need for action on three broad fronts. The first is explicitly macroeconomic; the second is explicitly microeconomic; and the third is more institutional in nature, focused – in particular – on the labour market:
• Macroeconomic policies are needed to create condition for more growth and jobs in a dynamic and well-functioning Euro area.
• Microeconomic policies are needed to make Europe a more attractive place to invest and work, and to enhance the climate for knowledge-creation and innovation.
• Policies under the employment guidelines are needed (i) to attract and retain more people in employment and modernize social protection, (ii) to improve the adaptability of workers and firms and the flexibility of labour markets, and (iii) to increase investment in human capital through education and the development of skills.
However, the European summits have not been sufficiently explicit about the instruments to be made available, and several basic questions remain unaddressed (Kok, et al., 2004). In particular, how will the private sector be induced to increase its own R&D spending so substantially? How should the growth of R&D be distributed between the different member states and between sectors? What role should individual governments play and what role should the European institutions play?
There is also another key element missing in the implementation process. There has not been a systematic quantitative analysis of the impact of the individual reform proposals on potential economic growth. Such an analysis would have led to a better prioritization of individual
reforms as well as an assessment of whether these reforms need to be implemented simultaneously or sequentially.
The European Commission proposed to use all the instruments available such as regulation, closer co-ordination, benchmarking, peer review and dialogue with citizens, social partners and with businesses in order to meet the objectives of the Lisbon Agenda (Doc/00/7, Brussels 2000). The already established instruments used at the EU level were: legislation, European collective agreements, social dialogue, structural funds, support programs, the integration process of different policy fields, analysis and research (Goetschy 2002). The instruments, however, needed to be simplified and better coordinated. The focus of the Broad Economic Policy Guidelines should move towards medium and long-term implications of structural policies and on reforms that aim at promoting employment, social cohesion, economic growth and a knowledge based economy. In order to develop the European dimension in new policy fields such as information society, research, innovation, education etc. the European Commission, the European Parliament and social partners adopted a new open method of coordination (Lisbon European Council 2000).
2.3.1 Microeconomic Policies
A major purpose of the Lisbon Agenda is to raise EU’s growth potential, by increasing investment and spending on innovation. Two themes underlie the microeconomic and structural reform proposals that are designed to achieve this:
• To establish a better climate for investment, the policy guidelines are aimed at (i) implementing the single market more effectively, broadening it out to incorporate the service sector, (ii) restructuring the regulatory environment, by assessing the cost and the quality of regulation, and the legislative burden on firms, (iii) increasing competition through enforcement of anti-trust laws, and reduction of state-sponsored industry protection, (iv) expanding and improving the European infrastructure, and (v) encouraging enterprise and entrepreneurship, with a focus on start-ups and medium-sized businesses.
• To promote innovation, the policy guidelines aim to (i) raise expenditures on R&D, with a target of raising R&D investment to three percent of GDP, of which two thirds should come from the private sector, (ii) facilitate the implementation of ICT, (iii) foster partnerships between universities and firms, (iv) commit member states to supporting environmentally sustainable development, and (v) establish new technologies and markets, with the development of regional and local clusters. Moreover, the European Council has initiated the establishment of a European Research Area (ERA) in which EU institutions and member states are expected to strengthen coherence of their activities in a variety of innovation related policy areas.
Several of these elements are under-pinned by economic theory. The efforts to improve competition within sectors across the EU should not only improve product market flexibility directly, so that market distortions are reduced, but should also have a positive impact on R&D, thereby stimulating both competition and innovation. Furthermore, a commitment to reduce
direct state-led protection of industries or sectors represents an important acknowledgement of the need to minimize market-distorting state intervention, when there is no justification due to a genuine market failure.
However, there are some gaps and inconsistencies in the policy guidelines. The underlying aim of the investment guidelines is to create a climate in which firms are encouraged to invest. This implies that government policies should be clearly aimed at creating an environment for firms, rather than engaging directly in investment spending. In contrast, one of the central aims of the innovation guidelines is to raise R&D spending to a centrally planned target, of which a third should be state financed.
Economic motivations can exist for such direct state intervention, if the spill-over effects of R&D are great and if firms are unable to capture enough returns on their R&D spending. In such a case, R&D spending will be too low in the absence of government policies. However, it is not obvious that this applies to EU firms in general and there might be substantial differences between different sectors and industries. Nor is it clear that all member states have the necessary information, expertise, or policy tools to implement R&D expenditures in an efficient and coherent way. Rather than aiming for an arbitrary target for R&D spending, innovation policy would benefit greatly from following the investment guidelines, i.e. focus on creating an environment, which would encourage firms in the EU to engage in R&D themselves (Cameron & Fawcett, 2005).
2.3.2 Employment Guidelines
The first goal of the employment guidelines concerns the low employment and participation rates that are seen in the EU, in particular in countries such as Greece and Belgium. The Lisbon Agenda stresses that action is needed to tackle the persistently low employment rates of young people, the unskilled, women, and older people. It suggests the use of active labour market policies including job search assistance, guidance, and training and a review of tax and benefit systems including management and conditionality of benefits in order to make work pay.
The second goal concerns the adaptability of workers and firms. It aims to ensure that both can take advantage of the new opportunities for investments. It seems as if the EU has had particular problems with the adoption and use of ICT in its service industries. It is possible that labour market institutions, such as employment protection, has retarded the ability of firms to discover new ways of doing business, and perhaps prevented the easy entry of new firms, with consequent effects on productivity and growth (Cameron & Fawcett, 2005).
The third goal concerns investment in human capital. An important background here is that EU productivity growth in high skilled and low-intermediate skilled industries has been poor since 1995 compared with the US (Inklaar, et al., 2003). In contrast, productivity growth in high-intermediate skilled industries, such as engineering, has been relatively good. Since many industries in the high skilled and low-intermediate skilled classification are either ICT-producing manufacturing or ICT-using services, respectively, this emphasizes particular areas of the EU economy that have difficulties. However, this does not necessarily imply that lack of skills and education is a major EU problem. In general, the EU workforce is quite well skilled and educated, although there are big differences across the EU. To the extent that investments in
human capital should be encouraged within the EU it is important to stimulate an increase of the skill level at the bottom to stimulate higher employment rates among the young, the unskilled, women, immigrants, and older workers. Furthermore, it can be important to stimulate increased skill levels among people in the middle and top of the workforce to make workers and firms more adaptable and to support the adoption of new technologies.
One should observe that there exist two major obstacles for implementing the employment guidelines. In some EU countries, interest groups have a rather inflexible view of the European Social Model. Thus, it will be difficult to get the necessary cooperation of labour unions and some political parties for reforms that change the relative positions of insiders and outsiders in the labour market. Furthermore, there might be problems with the goal of extending equal social protection to all workers (for example, giving part-time and temporary workers the same rights as full-timers), and of encouraging firms to pay the same wage rates to all workers. The simple reason is that it is not rational to treat all workers in the same way. It has, for example, been shown that extending the employment rights to temporary workers lead to a low rate of transition from temporary to permanent work (OECD, 2004).
2.3.3 Open method of coordination
The open method of coordination (OMC) was put forward as an instrument to be used under the Lisbon Agenda. The purpose of OMC was not to define a general ranking of Member states in each policy, but rather to organize a learning process at European level in order to stimulate exchange and the emulation of best practices. The purpose was also to help the member states to improve their own national policies. The method is called open, partly so that outlined European principles can be adapted at national level but also because there is a clear distinction between reference indicators to be adopted at European level and concrete targets to be set by each member state for each indicator, taking into account their starting point (Rodrigues, 2004). The method of OMC had successfully been used by the European Employment Agenda (EES), which inspired the use of the method in the Lisbon Agenda. OMC’s includes mutual learning processes and is creating peer pressure on the member states by increasing the transparency and multilateral surveillance. The transparency is increased by the use of indicators, benchmarks, and performance and policy targets. The decision-making authority lies within each member state (Tucker, 2003). The OMC is used to spread best practices and to reach greater convergence towards the main EU goals. The aim was to introduce the method at all levels and also to combine it with a stronger position for the European Council when it came to co-ordination and guiding. In short, the method involves:
• Establishing guidelines combined with timetables for achieving the goals set in the short, medium, and the long run.
• Converting the guidelines for the EU into national and regional policies by using specific targets and adopting measures, including national and regional differences.
• Using periodic monitoring, evaluation, and peer review organized as mutual learning processes.
• Establishing, when necessary, quantitative and qualitative indicators and benchmarks against excellent performing countries and tailor these to the needs of different member states as a procedure which entitles to compare best practices.
OMC’s are non-binding and by enhancing the transparency, mutual learning and peer pressure they intend to facilitate the convergence on the EU’s key goals. Since the OMC procedure is fairly new, it has produced new instruments, which are used to enhance monitoring of policy and performance. These are (i) National Action Plans that analyze the state of affairs in the relevant policy domain and which actions that has been put in practice or that is planned in order to meet the objectives, (ii) monitoring, the Commission and the expert committees monitor the progress in the member states and in the union and can propose specific recommendations to individual member states, and (iii) policy and performance indicators that is needed in the monitoring process and in the exchange of comparable information (Tucker, 2003).
Instead of constructing and enforcing formally binding laws, OMC’s involves codes of conduct, benchmarking and inter-state co-operation. OMC’s involve the member states in a continuous reflection upon their own programmes in a certain policy area. It also includes monitoring of their national policies that is open for evaluation for the other member states (Wincott, 2003). OMC, as a policy process, is based upon two sets of dynamics. The first, where the EU processes provide guidelines for directing and locating national policymaking and is referred to as politics of strategisation. The second one is politics of reaction, where the ones affected by the guidelines will put them in practice, have faith in them, and also provide constructive feedback upon them (Chalmers and Lodge, 2003).
In the Lisbon Agenda, OMC are used in several areas such as social protection, pensions, innovation, small and medium sized enterprises, education, R&D, and information society. The Lisbon European Council defined OMC as a fully decentralized approach, which included regional and local governments. They also stated that the Commission ought to develop benchmarking exercises for managing change (Tucker 2003).
In order to reach the objective of establishing a European Area of Research and Innovation voluntary arrangements, instruments under the treaty were put forward to be used. The
instruments were to be used in a flexible, decentralized, and non-bureaucratic manner. By using tax policies, venture capital, and Financial
Irregularities Body (FIB) to support the environment for private research investment were to improve. They also formed a number of OMC’s that were to be applied such as benchmarking and indicators.
Benchmarking
The OMC uses benchmarking as a technique by creating a European dimension and making political choices by defining European guidelines to national diversity (Rodrigues, 2004). The technique of using benchmarking is also combined with initiatives taken by the Commission, initiatives that were stated as instruments to be used in developing the Europe Action Plan. Benchmarking is also included in the process of raising the employment in Europe, where it is used in the aspect of lifelong learning by flexible working time and job rotation. It is further used by setting a new benchmark for improved childcare provision (Lisbon European Council, 2000).
The different main areas have each received a number of different benchmarking. For the education sector five key benchmarks were set: (i) early school leavers, (ii) mathematics, science and technology graduates (MST), (iii) completion of upper secondary education, (iv) basic skills, and (v) life-long learning (Commission staff working paper, 16/ 5, 2006).
Benchmarking exercise has been used within related fields such as the length of time and cost involved in setting up a company, amount of risk capital invested, number of business and scientific graduates, and training opportunities. The member states were also obliged to draw up a European chart for small companies that should commit member states to focus on the previously mentioned benchmarking that deal with small companies as the underlying motor for job-creation in the EU and respond to their needs (Lisbon European Council, 2000).
Indicators
The Commission has as a task to draw up an annual synthesis report on the basis of structural indicators. These structural indicators should provide an objective assessment of the progress towards the Lisbon Agenda. The structural indicators are coherent with the Lisbon Agenda formulated in 2000, and then further expanded in Gothenburg and refined in Stockholm and Barcelona. The structural indicators cover six main areas: general economic background, employment, innovation and research, economic reform, social cohesion, and the environment. In the annual spring report, 42 indicators were divided into five major areas. Later in the annual spring report 2004 the number of structural indicators was reduced to 144 in order to strengthen
the analytical possibilities and to improve work methods (www.nsi.bg, 070212).
The structural indicators are one of the operational foundations in the Lisbon Agenda for economic and social renewal. They can be used as reflection for the Lisbon Agenda, and its policy objectives, and can also be used as reflection in the member states, where they can evaluate their performance. The indicators works as an operational expression, that the member states use and work towards. The main task of the indicators, and bench-marking is the possibility to monitor progress (Synthesis Report, 2005).
There have been critics associated with the massive use of indicators in the Lisbon Agenda. Kok et al (2004) states that approximately hundred indicators have been used in the context of the Lisbon Agenda, which results in that almost all the countries will have at least one best ranking. This makes the instrument ineffective, since the member states does not get the incentives to improve their records. However, the European summits have not been sufficiently explicit about the instruments to be made available, and several basic questions remain unaddressed.
2.4 The mid-term review; “Lisbon Agenda 2005”
On the second of February 2005, the European Council had a meeting concerning the process of the Lisbon Agenda. The Commission concluded that the expected results had not been fulfilled. Some of it can be explained by external events but far from all. The European economy had not
4 The 14 structural indicators are the following: GDP per capita in PPS, real GDP growth rate, labour productivity
per person employed, labour productivity per hour worked, total employment growth, employment growth: female and male, inflation rate, unit labour cost growth, public balance and general government debt.
reached the wanted level in terms of productivity, growth, or employment, and the creation rate of new jobs was slowing down. Nor were the investments in R&D sufficient. The base for the evaluation of the first years was the Wim Kok report: “Facing the Challenge- The Lisbon Agenda for growth and employment”(2004).
There are clear differences between the member states in their performance at approaching the Lisbon Agenda’s goals. Sweden, Finland, Denmark, and Ireland are generally among the best performing countries. Larger economies, however, such as Germany, France, and Italy are at the other side of the scale, and are showing the least progress (Rydeman and Törnell, 2005).
2.4.1 The Wim Kok Report
The “Kok Report” was, as noted earlier, an evaluation of the first five years of the Lisbon Agenda, and was commissioned by the Commission. The report points out several reasons behind the lack of results that the Lisbon Agenda has experienced. The main reasons were an overloaded agenda, poor co-ordination, conflicting priorities, and the lack of determined political action (Kok et al., 2004).
For the Lisbon Agenda to succeed and to meet the goals of employment, and growth all the member states must take action, and be engaged in the process. The Kok report argues that all the different parts of the Lisbon Agenda will have to be included in order to fulfil the goals; it is hard to reach higher growth, and employment by just one action. Urgent actions are therefore needed across several areas of policy: (i) the knowledge society; make R&D a top priority, increase the attractiveness of Europe for researchers, and scientists, and promote the use of ICTs, (ii) the internal market; complete the internal market, and create a single market for services, (iii) the business climate; reduce the administrative burden, create a more supportive business environment, where starts-up are easier, and the legislation have high quality, (iv) the labour market; develop strategies for lifelong learning, and active ageing, underpinning partnership for growth, and employment, and to fasten the process of recommendations of the European Employment taskforce, and (v) the environmental sustainability; spread eco-innovations, encourage policies that yield long-term sustained improvements in productivity through eco-efficiency (Kok et al., 2004).
The Kok report suggests that a new focus should be taken that includes more coherence between policies, and participations, improving the process for delivery by involving national parliaments, and social partners, and clearer communication on objectives, and achievements, which will make the member states more obliged to follow their responsibilities. The report further suggested a clearer separation of tasks among the participants. The Council should take the leading role in the Lisbon Agenda; the member states conduct national programmes with engaging commitments; The Commission should support the progress by policies, and actions, and reviews, reports, and facilitates the progress, the Parliament should take a proactive role in monitoring; and the social partners should take their responsibility in the Lisbon Agenda (Kok et al., 2004).
2.4.2 Goals
After the mid-term review, and the lacking results, especially in the employment sector, the Commission decided to only keep the quantitative goal of dedicating three percent of GDP to R&D. The focus shifted from long-term goals to more urgent measures that are needed to be put forward in different member states in order to reach some progress. The attempt was not to rewrite the original Lisbon Agenda but to recognise new actions to be implemented both at the European, and at the national level. The timeframe did not change and is still set to 2010.
The main targets after the mid-term review were “delivering stronger, lasting growth and crate more and better jobs”. As growth and jobs became the immediate target, the Commission argued that this focus does not prevent that social, and environmental objectives can be promoted. The different sectors aim at corresponding targets but use different instruments, and produce results within different timeframes. In order to meet the main targets sound macroeconomic conditions, and especially stability oriented macroeconomic policies, and sound budgetary policies, is needed (Brussels, COM (2005) 24).
2.4.3 Instruments
It was argued that the responsibilities between the EU and the member states were not clearly defined and there existed overlapping, and bureaucratic reporting procedures and not enough political ownership on the Lisbon Agenda set in 2000. The governance of the Lisbon Agenda was to be more effective, and easier understood by (i) simplify the reporting, (ii) appoint at the government level a person responsible for the Lisbon process, (iii) bring forward a Lisbon Action Programme, and (iv) establish National Action Programmes in the member states (Brussels, COM (2005) 24).
The OMC that were the main instrument during the first time-period have not proven to be efficient. Neither had the Community method worked satisfying. Member states failed to use mutual benchmarking, and lagged behind with the agreed implementation. The Kok report suggested an improvement of OMC’s, peer pressure, and benchmarking, and a better use of the 14 key indicators, and of better communication (Kok et al., 2004).
The Commission brought forward a partnership for growth and employment, which creates a platform where member states, EU and social partners can work together at reaching the same goals. In light of the mixed result from the first five years of the Lisbon Agenda, the Commission proposed new implementations for reaching the goals:
• A single National Action Programme for growth and jobs, adopted by national governments after discussion with their parliament and other involved partners.
• Appointment of a person in each member state at the government level that is responsible of the co-ordination of the different elements in the Agenda, and to present the Lisbon programme.
• A single reporting structure through the national Lisbon programmes for growth, and jobs.
• Identify priorities for action at the union level, and publish it in a Community Lisbon Action Programme. The three main areas will be: (i) creating more and better jobs, (ii) knowledge, and innovation for growth and (iii) making Europe a more attractive place to live and work.
• Integrate the existing treaty based on economic and employment co-ordination mechanisms so that the reporting structure becomes easier at the union level (Brussels, COM (2005) 24).
The time-period is set for three years; hence, there will be a review in 2008 on the progress. The national reform programmes that are posted in each member are set out to be forward-looking political documents setting out an agenda to deliver jobs and growth, for the following three years. These national reform programmes will be the main source of information for the Commission concerning the progress, and policies in the member states (Brussels, SEC (2005) 622/2).
The national reform programmes are designed by each individual member state, and should be based on the integrated guidelines set at the EU level. They lie under the member states responsibility. The programmes have to be consistent with some outlines so that they can easier be used at the union level. The programmes should identify the key priorities for action, and integrate the country-specific recommendations made at the union level. The member states should motivate if they consider that no action is needed in certain areas. The public authorities and social partners should be involved at all levels. The programmes should also describe the consistency, and synergies between the macro-, and microeconomic and employment reforms (Brussels, SEC (2005) 622/2).
A number of OMC’s and sectoral processes that have been developed since 2000 should be included in the programmes. The usefulness of the OMC as a governance method is not being diminished but the reporting structure need to become easier, and more integrated in the national reform programmes. Thus, the main characteristics of the OMC such as mutual learning, benchmarking, indicators, and identification of good practise will continue. The former system of structural indicators that was drawn up for the start of the Lisbon Agenda with key, and background indicators will stay the same (Brussels, SEC (2005) 622/2).
2.5 Differences between “Lisbon Agenda 2000” and “Lisbon Agenda 2005”
As stated earlier, the first Lisbon Agenda set in 2000 was very ambitious, and some even argue that it was too ambitious. After the mid-term review there were some changes made but the main context was still intact. One of the changes was the abandonment of the many quantitative goals. The only goal that was kept was the goal of devoting three percent of the national GDP to R&D. The main focus was put on growth and jobs. From having very ambitious goals that were well formulated, the Lisbon Agenda turned to a quieter profile.In the mid-term review of the Lisbon Agenda, the time focus shifted from a long-term to a more medium-term view. One explanation behind the shift, and the willingness to use more urgent measure, is the limited time left of the Lisbon Agenda. In order to reach any progress, the
measures has to be used immediately. The implementation strategy was also altered from relaying heavily on the OMC to using national reform programmes.
3. THE LISBON ARENAS
3.1 The Macroeconomic Arena
When the Lisbon Agenda was adopted in 2000 it was a reaction to the slow-down of Europe’s economic growth in the 1990s and a feeling of a need to catch up with the US in terms of standards of living. A crucial step in any attempt to implement various growth promoting policies is to understand the true sources of the European growth slow-down. To be able to do this one must allocate the historical growth to various components. This allocation exercise, known as growth accounting, typically decomposes growth into (i) a capital-related component, (ii) a labour-related component, and (iii) a technology-related component.
Sources-of-growth calculations have always been imprecise, but evidence from the US suggests that ‘quality upgrading’, particularly in capital goods has substantially worsened the precision problem in recent decades. Quality upgrading of capital goods is the result of technological change that is embodied in capital. Quality upgrading will not show up in the measured capital stock unless quality-adjusted capital prices are used. Failure to account properly for capital quality improvements has two serious consequences. First of all, GDP and GDP growth is under-estimated. Calculations by Sakellaris & Vijselaar (2005), for example, show that GDP, for the Euro area, was underestimated on average by 0.7 percentage points annually in the late 1990s in estimations, which did not take capital quality improvements5 into account. However,
quality-adjusted estimations suggest that the US-EU growth gap was even larger than previously believed, since similar quality-adjusted estimations for the US raise its growth figures even more.
The second consequence is that the sources-of-growth estimations that have been used to make priorities in EU’s growth promoting policies are skewed. Sakellaris & Vijselaar (2005) show that that the contribution of the slow-down in disembodied technical progress, i.e. total factor productivity (TFP) growth, is even more pronounced after adjusting for capital quality improvements.
An interesting conclusion from these results is that they point to a need for the EU to concentrate more on microeconomic measures aimed at enhancing overall efficiency and boosting innovative activities instead of macroeconomic measures. These measures should generally aim at creating a better business environment by e.g. easing administrative and regulatory burdens and liberalizing energy and telecommunications markets. Increased labour market flexibility could also enhance TFP growth as it facilitates the process of reallocating resources to their most efficient uses.
3.2 The Microeconomic Arenas
In this section, we deal with the functioning of the individual arenas or markets which are of vital importance for the implementation of the Lisbon Agenda: (i) the institutional arena, (ii) the infrastructure arena, (iii) the policy arena, (iv) the spatial arena, (v) the geographical arena (vi) the markets for new technology, (vii) the markets for goods and services, (viii) the markets for capital, (ix) the markets for entrepreneurship, (x) the labour markets, and (xi) the markets for higher education.
3.2.1 The Institutional Arena
It has for a long time been stressed in economics that the institutional framework of economies is a critical factor not only for innovation but also for economic growth and development more generally. The formal institutions are the general rules that are guiding the behaviour of economic agents. They have two basic roles: first, they define the property rights of economic agents, and second they determine the level of transaction costs in the economy.
The development of the EU can be described as a process where different steps common formal institutional rules have been set up and implemented in different member countries. These different steps consist of a variety of common policies, such as a customs union, a common agricultural policy, and more recently, a common monetary policy (currently covering 13 member states). However, in many areas, such as the labour market, there is still a large diversity of institutions within the EU (Cameron & Fawcett, 2005). The same is true for the field science and technology, despite the efforts created by various multi-annual framework programmes since the early 1980s.
3.2.2 The Infrastructure Arena
Infrastructure and in particular transport infrastructure has for a long time been a major policy issue within the EU. Special interest have been devoted to on the one hand provide better transport connections between the different member states to stimulate trade by decreased transport costs, and on the other hand to improve the infrastructure in less favoured regions within the community to make EU more coherent. Plans for trans-European transport networks (TENs) have been presented and approved. Some of the links in the trans-European networks have also been built but the speed of implementation has generally been low due to lack of funding.
It seems as if the investments in TENs mainly have been motivated by a wish to improve the mobility of goods and people. In general, the importance of infrastructure for R&D and innovation seems to be neglected. This is interesting since much research has shown that knowledge flows tend to be spatially bounded and that an extension of functional regions by means of shorter travel times may stimulate knowledge production (Ejermo, 2004; Gråsjö, 2006) as well as productivity growth (Andersson & Karlsson, 2007).
3.2.3 The Policy Arena
It is obvious that the European policy arena is not organized in an optimal way to achieve the objectives of the Lisbon Agenda. The policy measures needed to implement the Lisbon Agenda are mainly controlled at the national level within the individual member states. However, the objectives of the Lisbon Agenda have been formulated within the Commission with all too little involvement of those who should implement the necessary policies at the national level. As a result, the policy makers at the national level within the member states have not felt that they are committed to the objectives of the Lisbon Agenda. The many and partly conflicting objectives of the Lisbon Agenda has certainly also created confusion about which objectives to fulfil as well as give policy makers an opportunity to pick among the objectives, since it is impossible to fulfil all objectives at the same time. Furthermore, policy making at the national level is influenced by many other factors including influences from various vested interests and preparations for upcoming elections. Hence, we can talk about a European policy failure. What EU gains in variety and diversity, it loses through a lack of cohesion and central policy decision making. This is clearly illustrated by the European innovation system that is characterized by (i) a multitude of actors at different territorial levels who have significant competencies and resources at their disposal to promote innovations, (ii) considerable differences in the measures member states apply for internal coordination in innovation policies, (iii) large institutional differences regarding member states’ publicly funded R&D systems, and (iv) significant variations in innovative performance, the industrial structure, and the patterns of technological specialization among regions and member states (Kaiser & Prange, 2005).
To reduce the influence of this policy failure it is necessary to reduce the number of objectives in the future but also to involve policy makers at the national level in the member states to be much more actively in the formulation of these objectives. Rather than concentrating on all areas of the economy, the EU should focus on a limited number of areas and it must also acknowledge the very large variation between the different member states. Thus, the optimal policy mix varies substantially between the different member states. It is also necessary to deal explicitly with actual goal conflicts to give guidance to policy makers. There might also be a need to let more policies be implemented at a European level to avoid the problem with not all member states going in the same direction with the same efforts.
3.2.4 The Spatial Arena
Today knowledge as such is a very specific economic asset. It exists in both codified and codified form. Some codified knowledge is a pure public good in the sense that it is both non-rivalrous and non-excludable. Much scientific knowledge is a pure public good in the sense that it is accessible for those with the relevant training. However, some codified knowledge is not a pure public good, since economic agents in general are excluded from using it in their production by means of patents and trade secrets. This is typical for much new technological and entrepreneurial knowledge. However, patented knowledge can be used as an input in R&D processes. Thus all types of codified knowledge can be used in innovation processes. As a result of the rapid developments in ICT and improvements in not least international passenger transport, it has become progressively easier to access codified knowledge.