The Relationship between
Education and Well-being in
China
MASTER THESIS WITHIN: Economics NUMBER OF CREDITS: 30
PROGRAMME OF STUDY: Economics analysis
AUTHOR: Sijia Liu JÖNKÖPING May 2020
2
Master Thesis in Economics
Title: The Relationship between Education and Well-being in China Authors: Sijia Liu
Tutor: Almas Heshmati Date: 2020-05-16
Education; Chinese, Females; Well-being; Principal component analysis;
Abstract
There are numerous approaches to quantitatively measure well-being. Most well-being research are based on income or health situation from economics perspective. The need for research on women’s relationship between education and well-being is an area that has not been fully investigated. It is also important to know how the situation of women’s well-being compare with men’s. The purpose of this research is to estimate women’s well-being and understand how well-being women is compared with men in China. Different characteristics of men and women is considered and estimate the specific relationship between education and well-being. Two measure of well-being are used: self-assessed unidimensional subjective well-being and parametrically estimated multidimensional well-being. Two measurement will help to understand the difference between subjectivity and objectivity of well-being. To achieve this goal, this research computes and compares the well-being of 34,054 women and men by using Chinese General Social Survey in 2012, 2013 and 2015. Well-being is measured by computing multidimensionally by principal component analysis which depend on different domains of identity, capability, material well-being. All the domains contribute to individual’s well-being. The findings suggest that, multidimensional well-being index differ from the subjective well-being in ranking individual grouped by important common characterizes. The difference is attributed to multidimensionality of the well-being index. Under this circumstance, education still does influence well-well-being positively conditional on controlling for identity, capability and material well-being.
3
Table of Content
1.Introduction ... 5
2. Background ... 6
2.Literature review ... 9
2.1 Education and Empowerment ... 9
2.2 Identity and economics ... 11
2.3 Income, capability and values ... 12
3. The Data ... 14
3.1 The dependent variables ... 14
3.2 Independent variables ... 15
4.Method ... 19
5. Estimation results ... 23
5.1 Multidimensional index of well-being ... 23
5.2 Heterogeneity in well-being by Marital status ... 25
5.3 Heterogeneity in well-being by Confucianism ... 26
6. Empirical analysis and discussion ... 27
6.1 The effects of education on female’s well-being ... 27
6.2 Male-Female comparison of well-being ... 29
7.Conclusion ... 30
Reference ... 33
Appendix ... 39
List of Tables Table 1. Definition of well-being indicators……….………....15
Table 2. Descriptive statistics………..….……….17
4
Appendix
Map 1. The Chinese General Social Survey (CGSS) data sampling map………….34 Graph 1. Variations in Self-assessed subjective Well-being (SWB) and Principal Component Analysis based Well-being (WBI) by marital status ……….35 Graph 2, Variation in Self-assessed Well-being (SWB) and Principal Component Analysis based Multidimensional Well-being (WBI) by Confucianism ….….……36 Table 4. Correlation matrix………...……….37 Table 5. Estimation of SWB and WBI for females………38 Table 6. Estimation of SWB and WBI for males………39
List of Abbreviations
CGSS Chinese General Social Survey ID Identity
OLS Ordinary Least Square Regression PCA Principal Component Analysis PRC People's Republic of China SWB Subjective Well-being
5
1.Introduction
Chinese women have always had a high participation rate in the labor market than other east Asian countries that share the Confucian culture, such as South Korean or Japan (Hare, 2016; Chen and Wen, 2019). However, high labor market participation rate does not automatically mean well-being increases. With the one-child policy, more and more educated women’s income increased. Increasing income also give women’s empowerment not only in the family but also in the society. The empowerment of women naturally conflict with traditional Confucian culture, and which also led to individual (both men and women) well-being’s fluctuation (Chen and Wen, 2019; Hannum et al., 2013; Maslak, 2011). Because the improvement of women's education leads to the change of relative income which cause the change of empowerment within the family (Chen and Wen, 2019). Whether and how does this change affect people’s well-being in life is an important research questions. One can ask to what extent can the education level of women in China influence their well-being? Here the issue is not only subjective being but also multidimensional being. How would well-being of women and men differ by their characteristics? This research attempts to provide empirical evidence based on micro-survey data from the perspective of gender identity and well-being measurement.
Related to well-being definition, subjective well-being definition is the personal answer about to what extent that they can feel their well-being. The most research on economic well-being are related to the relationship between physical quality of life and subjective well-being (Bertrand, Kamenica and Pan, 2015; Stutzer, 2004). We also call such well-being economic welfare. However, Economic well-being slowly adapts into a comprehensive concept which we can be viewed as a feeling of fairness or sense of social identity, then transferred into a capability that enable people to achieve the functioning they think that is important (Silber, 2008). The second measurement is
6
parametrically estimated multidimensional well-being, which contain the information of identity, capability and material well-being.
For the economical background, there are rapid social and economic changes happened in the Chinese society from the invention of the People’s Republic of China, through open door and reform policy and now post-reform time, which not only cause heterogeneity in regional development, but also the process have led many scholars interest into analysis of the individual well-being that so-called well-being changes (Cindy & Huang, 1998; Bian & Liu, 2020; Chen, 2018). In terms of economic transformation, China experienced a period in which agriculture was the main source of living, and with gradually industrialization, China entered the post-industrial period, and now enter a status that the tertiary industry plays the main role (Yu, & Sarri, 1997; Connelly et al., 2018; Canrong, 2001). As economic and social policy and economic transformation is progressing, the situation of individual women’s income, identity, and values must be influenced very much even from natural and social changes, which can also cause well-being change.
2. Background
For the philosophical background, there is a process of gender difference. Below shows how change gradually happened. According to Fung (1966), the traditional philosophy is far original from Taoism which begins around BC 722 and it describes male and female that: nature create female and male for some reasons, thus people should follow the principle of nature, that was believed by Chinese to result in all universal phenomena. Before this point of time, the gap between female and male is not that huge, and people are still following the natural principal living happily with their life (Fung, 1949; Harrison, 2001).
However, the biggest change started in the Song dynasty (begin from AC 960), With the increasing need for political intention for the empire of ancient China, the official
7
philosophy of Confucianism, which describes the relation between female and male that man is the superiority and female’s job is obeying. At this period of time, the female’s status becomes very deteriorated (Crowell, 2005).
From the Song dynasty until the 1900s, people followed Confucianism which resulted in women facing and accepting their fate as husband’s appendage and play the asking part in the family. Women even do not have chance to be educated and their feet should be binded hence women have no way to escape.(Gu, 2013; Chen and Wen, 2019; Harrison, 2001). This was the identity or value of women in the society during the ancient time and still be respected until now (Fung, 1964; Ji et al, 2017). The direct result is that every family prefers to have a male child rather than female for the only male can inheriting the family’s culture or wealth, a female is a only appendage of a male from the other family.
However, according to Harrison (2001), around the 1900s, this was the time when women’s education became popular. The revolutionary governor’s goal was to unbind women’s feet for the labor force, to educate all the people for labor quality, thus women have first chance to be educated equally as men (Liu, 2017). Just after World War II, the People’s Republic of China emerged as a political system in 1949, the nation encouraged people to give birth and fill the gap of labor shortage caused by war. It also had one slogan that said: “woman rising as half of the sky”, which means woman owns equal power and they have the equal rights to work as same as men (Aitsi-Selmi et al., 2013; Liu, 2017). Then, government and population expert realized that there are very big population which make the country to consume too much resource, and each person cannot have enough resource to survive.
Thus, One-child-policy started. because of the one-child policy, the abortion rate of girls increased dramatically (Srivastava & Cheema, 2019; Summerfield, 1997). However, the survived female child will gain biggest education investment (Liu, 2017), while the traditional concept of women’s identity still plays an important role (Gu, 2013;
8
Yu & Sarri, 1997; Shui et al., 2020). Recently, average women’s education level was higher than men, moreover, the returns on education are higher for women than for men in urban China (Hannum et al., 2013). The education level of individuals will influence his/her income, the income also attached to empowerment and capability, which will also change the hierarchy position in a family (Bittman et al, 2003). Thus, there is a natural philosophical conflict between Confucian women’s identity by increasing empowerment and the actual capability of women. Because Confucianism ask women to play obeying role in a family while the increase of women’s capability ask women to take more responsibility of family.
The purpose of this research is to estimate women’s well-being and compared it with the men counterpart in China. Different characteristics of women are considered and estimate the specific relationship between education and well-being. Because, women in different characteristically groups will also be influenced by education in different level, especially in China, marriage and Confucianism are the two influential factors according to the statistics test. Two measures of well-being are used: self-assessed unidimensional subjective well-being and parametrically estimated multidimensional well-being. The objective is to estimate how education influence well-being. The empirical part estimate and compare the well-being of 34,054 women and men by using Chinese General Social Survey in 2012, 2013 and 2015. The level of multidimensional well-being index is estimated by the principal component analysis method. The different domains or components of the multidimensional index include identity, capability, material well-being. All the domains contribute to an individual’s well-being. The findings suggest that education influences well-being positively, even conditional on controlling marital status and Confucianism. Multidimensional well-being index differs slightly from the subjective well-being in ranking individual grouped by marital status and Confucianism. The multidimensional well-being index shows that marital status has deeper influence for females but not for males. Confucianism have negative
9
effect on well-being of females, but not for males. The difference is attributed to the multidimensionality of the well-being index.
The rest of the research is organized as follows. The second part will be literature review about how well-being and education connected with each other; the third part is data specification; the forth part is the method; the fifth part is empirical analysis; the sixth part is the conclusion; the final part provide the implications of the result and limitation of this study.
2.Literature review
2.1 Education and Empowerment
In general, many studies have already found out the positive relationship between at least additional level of education and subjective well-being (SWB) (e.g. Blanchflower & Oswald, 2004). Some said middle level education will gain the highest subjective well-being (e.g. Stutzer, 2004). But, in developing countries, the education will gain more positive impact on well-being than developed countries for scarce of human capital (Fahey & Smyth, 2004; Aitsi-Selmi et al, 2013). Thus, in this paper, China as a developing country deserve to be tested. However, education as an indicator of well-being can influence many unobservable traits such as income for woman (Hannum et al., 2013), health (Dong and Simon, 2010; Amina Aitsi-Swlmi et al, 2013), and in some country (e.g. China) also influential for the religion belief such as the Confucianism (Frey & Stutzer,, 2002). According to Graham and Pettinato (2001), once education can upgrade social hierarchy, the empirical evidence became more clear and significant that education positively influence subjective well-being. Thus, education is directly correlated to income, health, hierarchy and well-being. By this mechanism, education can also indirectly influence well-being by income, health and hierarchy.
10
Specifically, the education level does influence women’s health in China, especially in low income quartile, the educated women owns lower rate of obesity (Aitsi-Selmi et al, 2013), which is an evidence of education’s indirect influence on well-being. Healthy women have higher chance to have higher well-being. However, what we are interested in is the influence from education on well-being of women, which also related to empowerment and identity. Deshmukh-Ranadive (2005) suggested that education is highly related to economic position, which means ability to work, gain respect and reduce gender inequality. It makes women have bargaining power in the household. Every aspect mentioned above, empowerment and economic position will increase well-being of women, however, bargaining power can be in conflict with Confucianism. Because Confucianism ask women not to argue but obey while bargaining power destined to give women’s power to argue. Bertrand (2013 and 2015) also found out that women whose relatively income is higher than men will spontaneously do more housework to remedy gender identification from American household dataset. Thus, hypothesis is that the self-efficacy, knowledge and competence can balance the influence of Confucian in case of high educated women.
What is the situation in China? According to Maslak and Mary (2011), People’s Republic of China has put serious effort to reduce discrimination against women by spreading education around female groups, which will increase well-being of Chinese women. Education does have influence on marriage by empowerment of women increased by education. Women are enable to share childcare and housework and realize their own productivity in career. Thus, marriage or family status also influence well-being (Yoshikawa, & Kamiya, 2019). Before women’s marriage, there is some phenomena that women who are more educated are less likely to marry a man, especially men who own lower education than her own (Hannum, & Wang, 2013). After marriage, Lei (2014) found out that the women who are out married (marry a man who is better than her) gained higher well-being than others, but only significant in low
11
income category or rural area. Thus, the marital status is a factor that will change women’s well-being. Yu (2014) and Zhang (2017) indicate that during Chinese marriage, empirical evidence proved that urban women who get higher income or education, gaining empowerment will decrease the time doing housework, which is different from American marriage that women will remedy for having empowerment. However, empirical evidence also indicate the situation has been weakened very much in rural place.
2.2 Identity and economics
Akerlof and Kranton (2015) proposed a new approach to form a norm for different groups which will help to explain economical irrational phenomena, which so called identity economics. According to their research, the norm plays very important part in the society. People will be happier if they feel belonging to their own social identity (Shon, & Barton-Bellessa, 2015). The social identity is the things that people care about and what make them identify themselves. The extent that people care about that thing depends on their identity and the fairness they things should be (Akerlof and Kranton, 2015). Because of the wider gender norm during this age by economic, philosophical and policy change, we can inference here that the well-being will also be influenced by social identity.
Thus, the changing situation of social identity of modern women in China will face not only labor market ignorance but also identity confusion, which can lead to decrease in well-being. However, the educated women plays an ambiguous role in this society, the education will not only bring them higher income but also a broader horizon which make them realize the identity conflict, especially in modern China, for the fact that the education return of woman are higher than man in urban China (Hannum, & Wang, 2013), which is not the normal role where women should play under the Confucianism conditions.
12
2.3 Income, capability and values
Even though education, empowerment, social norm can influence well-being, the original indicator that is income from old literature, which describe that income increase, well-being increase but with diminishing returns to income. However, some research shows the reverse causation (Graham et al., 2004). There is also some comparison income research, that is the income of a reference group on individual well-being. Some empirical evidence shows that people will be happier if their relative income is higher than reference groups (Ferrer-i-Carbonell, 2005). The capability here is the ability they think to get higher income. It is also the ability that people are enabled to achieve the functioning they value (Silber, 2008) or getting higher hierarchy in a society. As Davis and Dolfsma (2015) suggest, capability, also promises a new approach to explaining equality, which related to hierarchy.
Aspiration of income also influence well-being, high aspiration and ambitions relate to high income but relatively low well-being (Haisken-De New & MacCulloch, 2005). Relatively income will make social hierarchy higher. By the way, hierarchy and inequality can also influence people’s well-being. For that Hagerty (2000) finds that social comparisons, which is also inequality, would decrease well-being as well by 7,023 samples from the United States, they have a negative relationship. However, we can assume if people have capability to gain a higher social position or family position, the well-being will also increase (Silber, 2008). Teschl and Comim (2005) mention that even previous research agree that the ability of adaptive to a certain unpleasable environment will distorted subjective well-being. Thus, Teschl and Comim (2005) also agree that add capability into the well-being function to guarantees an objective picture of people’s life satisfaction. They also find a clear result that capability can be positive as well as a negative to well-being.
How to define the unpleasant and unfavorable environment? Some could be values, for example, money-is-all attitude in a society will increases alienation between people
13
(Kim, 2014). Kim (2014) also gained a conclusion with empirical evidence based on data from Korea, the US and Sweden that money-is-all attitude decrease well-being by increasing alienation. Thus, value or beliefs also play a very important role in well-being, even though one own much money. Value and beliefs are highly correlated. Helliwell (2003, 2006) finds out that belief in a God related to higher life satisfaction, but only in US, but not that significant in Europe. Stronger religious beliefs will also make people value other things, such as social relationship more than income and employment in UK (Clark & Lelkes, 2005). When the case of Chinese’s value and beliefs is considered, Confucianism is the kind of religion or society rule, which can be seemed as a social norm, it is strict and influential which has been deeply discussed in the background (Chen and Wen, 2019).
There is one special indicator in People’s Republic of China (PRC), the political identity, which not only connect with beliefs but also value. If the person is communist party member in People’s Republic of China, especially female will gain higher income and also higher life satisfaction in urban place (Nielsen et al., 2005).
To make everything clear, there is a graph to show the specific relationship between each indicator above.
Independent variable
Dependent variable Well-being
Education Identity Empowerment Value (Confucianism) Capability Material and Value Material Income; House; Age
14
3. The Data
The data is gained from Chinese General Social Survey (CGSS) which is funded by 985 Fund Project. The CGSS started from 2003 as the first national representative continuous survey, aimed to the changing relationship in social structure and well-being of people, please see Map 1 in the Appendix. The map shows how the organization randomly choose people to answer the questionnaire. The red parts in the map shows sampling locations (CGSS, 2020). The sample covers the whole country and weightily cross provinces, urban, rural parts and age cohorts. The sampling procedure is expected to lead to small bias of data selection. Chen and Wen (2019) have used this data to test the relationship between women and men’s income. The results show that relatively income increase of women will decrease women’s well-being in a family, more significant for men’s well-being decrease. Thus, we will set women and men into groups in the model and test to see the difference. Wang and Feng (2019) also used this dataset to test the spillover effect of identity within a family. They found out that the political identity highly influence well-being of Chinese people. Both of two papers are newly published, which means the dataset are also barely used and need to be investigate. These papers only using one year. I combined three years into one dataset get around 34,000 observations to increase credibility.
3.1 The dependent variables
Most variable are shown in the Table 1. The dependent variable is well-being, which can be measured by unidimensional subjective well-being, and Principal Component analysis index that helps to get a multidimensional well-being in order to get all information of each individual and better analyzing. The subjective well-being was measured by questionnaire that to what extent you feel happy about your life. Question will be answered by 1=very unhappy; 2=unhappy; 3=normal; 4=happy; 5= very happy.
15
People answer the question by their subjective minds. Multidimensional well-being will measured by principal component analysis by combining all the information such as subjective well-being or material well-being into index. Two different index increase the objectivity of the measurement.
3.2 Independent variables
The most important variable is education level of each individual. However, the situation of education in PRC is strictly divided into 13 classes, for the reason that education are a grade-based system and all the school or university are classified into 13 classes following the order from low to high level. For example, junior college (adult higher education) is far less advanced than college degree (formal higher education), because they are different types education. Adult education is not of high quality as a formal education. The system is very different from western education system. The specific hierarchy is showing in the notes1. The most similar education level in Europe
is the third cycle education, and in China there are three different level in “third cycle education”. The class 11 is = university degree (adult higher education), class 12 is = university degree (formal higher education), class 13 is = master graduate or doctoral graduate are equal to the third cycle education in Europe. However, the other classes of education is hard to evaluate which cycle of the education they belong to.
The second important control variable is identity that will be measured by empowerment of the female, which are based on 5 questions listed below:
1 Variable label (traditional career, traditional competence, traditional marriage, quitting, housework)
2 To what extent you agree that men put career first, women family first? There are 5 different ranks to show the extent of agreeing, 1=very disagree; 2=
1 Note: The specific hierarchy are: 1= illiteracy, 2= private school for expel literacy, 3= primary school, 4= middle
school, 5=vocational high school, 6= high school, 7= technical secondary school, 8= technical school, 9= Junior college (adult higher education), 10= college degree (formal higher education), 11= university degree (adult higher education), 12= university degree (formal higher education), 13= master graduate or doctoral graduate.
16
disagree; 3= do not agree do not disagree; 4=agree; 5= very agree (career).
3 To what extent you agree that men are inherently more competent than women, 5 scale answer as question 1 (competition).
4 To what extent you agree that better marrying well than doing job well for women? 5 ranks answer as before (marriage).
5 To what extent you agree that when the economy is bad, women should be laid off first? 5 ranks as before (quitting).
6 To what extent you agree that husband and wife should share the housework equally? 5 ranks as before (housework).
Those 5 questions mentioned above are the most concerned questions in traditional Chinese society, that captures the state of empowerment in a family, or competition in the workplace between different genders. Questions 1, 2, 4 are all about the traditional female’s identity in workplace and competition with male in the career. Question 3 and 5 are about the marrige and family empowerment. Moreover, all the questions are directly questioning female’s identity conflict in the society. It will also be the informative addition to multidimensional well-being.
Control variable will be age, subjective health situation, numbers of house that people have and income, which all belong to material and health well-being (Heshmati, & Kim, 2015). Most of the variables are categorical, but age, quantity of house and income are continuous numbers. In China, houses are very important not only for family but also for wealth preservations. The house property right highly correlated to subjective well-being in urban China (Cheng & Wang, 2016).
Capability as one of the well-being indicators will be measured by questions below: question about fairness and Specification 2: hierarchy and the ability to change the hierarchy can also be the measurement of capability (the variable id are: past, present, future and 14 years old).
1. Which hierarchy that you in 10 years ago? 10 categories, ranked from 1 which is the lowest to 10 that is the highest. (past)
17
3. Which hierarchy that you think you will be 10 years later? 10 categories.(future) 4. Which hierarchy that you think you were in when you are 14 years old? 10
categories. (14 years old)
As mentioned before, capability is kind of ability to change person’s situation, hence, question 1, 2 and 3 show how people feel about their own situation now and before, the ability they had to change hierarchy that they are in and the confidence they own to change their future. Even though questions 1 and 4 are little bit similar, but not very much related. The hierarchy 10 years ago is more about time difference, and as comparison with question 2 and question 3 in note 2. However, the hierarchy when people are 14 years old are also important, because in 14 years-old stage, basically a person’s world view, philosophy and value formed, the hierarchy in this stage will influence well-being more directly.
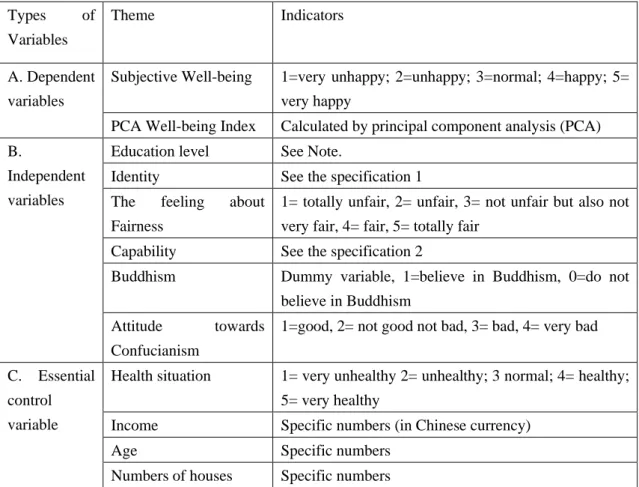
Table 1: Definition of well-being indicators
Types of
Variables
Theme Indicators
A. Dependent variables
Subjective Well-being 1=very unhappy; 2=unhappy; 3=normal; 4=happy; 5= very happy
PCA Well-being Index Calculated by principal component analysis (PCA) B.
Independent variables
Education level See Note.
Identity See the specification 1
The feeling about Fairness
1= totally unfair, 2= unfair, 3= not unfair but also not very fair, 4= fair, 5= totally fair
Capability See the specification 2
Buddhism Dummy variable, 1=believe in Buddhism, 0=do not believe in Buddhism
Attitude towards Confucianism
1=good, 2= not good not bad, 3= bad, 4= very bad
C. Essential control variable
Health situation 1= very unhealthy 2= unhealthy; 3 normal; 4= healthy; 5= very healthy
Income Specific numbers (in Chinese currency)
Age Specific numbers
18
Marital status 1= unmarried, 2= cohabitation, 3= first marriage with a spouse, 4= remarriage with a spouse, 5= separated but not divorced, 6=divorce, 7= spouse dead
Gender 1=male, 2=female
From table 2, some of the variables are only available in 2012 and 2013. However, I combined the dataset of 2012, 2013 and 2015, which contains nearly 30,000 observations. Except the variable Confucianism, whose observations are around 20,000, it is only available in 2013 and 2015. However, the observations are still sufficient for research. 0 value means some of the invalid or refuse answering questions groups. It is also means people’s attitude. To make the test robust, I also count 0 value as comparison to others. That is the reason why there are some 0 value in table 2.For the characteristics of all these variables, the mean of subjective well-being is 3.797 out of 5, which I normalized it as 75.94 out of 100 to form graphs. It will be easy to see two indices of well-being’s difference. While comparing, the mean of feeling about fairness is only 3.075 out 5. The mean of education level is also relatively low, 4.87 out of 13 class, which means the average educational level in Chinese are between middle school and vocational high school. Other variables are mostly categorical without order, for example, Gender value 1 means male while value 2 means female. For the identity and capability part, the rank 1 from 5 shows to what extent that people agree with traditional or newly identity questions. So does capability questions which is related to hierarchy that the paper mentioned before. 0 value of Buddhism means people who do not believe in Buddhism, while 1 means people who own Buddhism. From the mean of it, it is easy to get the percentage that Chinese who believe in Buddhism, which is 5%. The variable Confucianism shows to what extent people agree with Confucianism, 1 is the agreement, 4 is very disagree. From the mean 1.93 of it, people generally hold middle attitude towards Confucianism.
19
Variable2 Mean Std.Dev. Min Max
Subjective well-being(SWB) 75.95 17.27 0 100 PCA-well-being index(WBI) 59.21 8.52 0 100 Education 4.87 3.07 0 13 Fairness 3.08 1.05 0 5 Health 3.62 1.09 0 5 Income 24252.76 140000.00 0 164252 Age 49.40 22.36 17 73 Numbers of house 1.10 0.79 0 96 ID career 3.42 1.17 0 5 ID competition 2.98 1.19 0 5 ID marriage 3.08 1.17 0 5 ID quitting 2.15 1.01 0 5 ID housework 3.76 1.03 0 5 Past capability 4.24 1.70 0 10 Present capability 3.48 1.79 0 10 Future capability 5.10 2.21 0 10 14-year-old capability 3.03 1.81 0 10 Buddhism 0.05 0.22 0 1 Confucianism 1.93 1.24 0 4
The dependent variables are SWB and WBI. WBI is principal component analysis index which contains healthy or material well-being indicators. WBI is more objective than only SWB because of more informativity. In the method part, the paper will tell how did multidimensional well-being index form from principal component analysis.
4.Method
Many studies try to capture the well-being by environmental and demographic factors, and personal status (Knight and Gunatilaka, 2009; Knight et al., 2009). As with the SWB (subjective well-being) test become popular, increasing numbers of research
2 All the numbers of observations is 34,054, except Confucianism. The observations contain Confucianism only
has 22,318, because Confucianism question added after 2013 and 2015, not in 2012. Thus, it lacks one year observations.
20
papers on SWB become one of the main research trends (Kahneman & Krueger, 2006; Alesina & MacCulloch, 2004), especially, they researched about the relationship between income and SWB.
One of the main variables is self-assessment of well-being (SWB), the questionnaire asks people that how do they feel about the well-being that they have right now, 1=very unhappy; 2=unhappy; 3=normal; 4=happy; 5= very happy. One of the method is estimate the Least square method regression between SWB and education level of women and conditional on use of other basic control variables, such as income, numbers of house, age which are not subjective individual indicators but objective factors. The second method is principal component analysis of well-being. The PCA method is applying to quality control research, such as psychology, education, photographic science, chemistry or IQ test, which is an exploratory parametric statistical technique for reducing the dimensionality of raw data to notional dimensions (Hess & Hess, 2018). However, in PCA, the scale and dimension reduction will also cost loss of exact meaning of the new vectors. Regardless of the loss, which has to be lost because of its own particularity, principal component analysis is still a good method to choose (Heshmati & Kim, 2015).
In this paper, PCA is an uncovered approximate linear dependency among other variables, we can get equation below:
𝑌 = 𝑋𝐵 + 𝐸 (1) Y is a n*p matrix of central variables, which is parametric multidimensional well-being, X is the n*j matrix of scores of principal components, in here are health, housing, value and belief, identity etc., B is a j*p matrix of coefficients, which is also eigenvectors which will be calculated and formed. E is a n*p matrix of residuals left in the equation, which means the unexplained variation outside of the principal component.
n means a numbers of observations, p is the number of partial variables, and j means
21
combination of direct answer (almost all the result show ranks), the original indicators with “coefficients equal to the eigenvectors of the correlation of the covariance matrix. The principal components are sorted according to the declining scale of the eigenvalues, which are equal to the variance of the component” (Heshmati & Kim, 2015). In our case, the principal components are our main interests for adding new components from theories of identity, value, belief.
According to Chen (2018) using the same dataset in 2013 from CGSS, married women’s affected by her personal achievement and characteristics of marriage matching. For the same reason, the marital status and gender difference, education level are also tested.
After that, it is essential to estimate the effects of education on well-being of the individuals where well-being is defined in 2 different ways and compare the results of them to see their differences, and for answering the main question of this paper, namely how could the education level of women influence their well-being. With 2 different measurements, from the simplest unidimensional subjective well-being to multidimensional well-being, we will see if they will gain different results or not. Most of the economic related well-being research focus on the income as main indicators, however, Akerlof & Kranton (2010) have some more ideas about well-being, that is identity and value should play a part in well-being, even though some individual do not realized that the culture self-identification and the extent that values match with reality will be that important. Thus, we find out two ways with informative analysis, one is subjective well-being, another one is multidimensional well-being index, which will be helpful to understand the meaning of well-being.
The last step is regression analysis between well-being (subjective well-being and multidimensional well-being) and education level while controlling for different variables. To expel the influence of other characteristics, I also control for individual
22
effect on marital status and Confucianism. The function of the regression is written as below:
𝑦 = 𝛽0+ 𝛽1𝑋 + 𝑢 (2) 𝑦𝑖 = 𝛽0+ 𝛽1𝑋𝑖 + 𝑢𝑖 (3) Equation (2) is estimated by the least square estimation method which will show the relationship between each well-being and each of the explanatory variables. The dependent variable 𝑦 is SWB (subjective well-being) or PCA-WBI (principal component analysis well-being index); 𝑋 is a the matrix of the explanatory variables; 𝛽0 is the intercept of the regression; 𝛽1 is a vector of coefficient of explanatory. 𝑦𝑖 is the SWB and PCA-WBI with individual effects that are controlled. The individual effects are marital status and Confucianism. The subscript i refers to individuals. We can see how different groups influence the power of explanation of Education to well-being. The groups will be divided by marital status and different attitude towards Confucianism, according to Chen (2018) and Aryee & Luk (1999), mainland Chinese doubt importance of marriage and career, while the well-being of people who live in Hongkong highly influenced by time conflict between family and career. Thus, the married groups and unmarried groups can have difference. Meanwhile, Confucianism is also one of the very gender differential indicators. Because Confucianism ask women to play obeying role in a family while the increase of women’s capability ask women to take more responsibility of family. But, men are asked to play the main role to take all the economical responsibility in the family by traditional Confucianism without any negotiation (Chen and Wen, 2019). Thus, doing individual regression by these characteristics can eliminate unobservable effect from education.
23
5. Estimation results
5.1 Multidimensional index of well-being
Principal component analysis method is used to compute the multidimensional index and its components. The results are presented in Table 3. Part one of the table shows the eigenvalues and the proportion of the variance explained by each component. The eigenvalues exceeding 1.00 form the well-being index. The index is weighted average of the first 7 components. The weights are their share of total variance explained by each. Together they explain 63.1 percent of the variation. The second part shows the eigenvectors where each indicators contribution to the principal components is reported. Those with values exceeding 0.30 are contributors.
Table 3, Principal Component analysis
Component Eigenvalue Difference Proportion Cumulative Comp1 3.235 1.183 0.170 0.170 Comp2 2.052 0.290 0.108 0.278 Comp3 1.762 0.184 0.093 0.371 Comp4 1.578 0.316 0.083 0.454 Comp5 1.262 0.194 0.066 0.520 Comp6 1.068 0.037 0.056 0.577 Comp7 1.031 0.049 0.054 0.631 Comp8 0.982 0.035 0.052 0.683
Principal components (eigenvectors)
Variable Comp1 Comp2 Comp3 Comp4 Comp5 Comp6 Comp7 SWB 0.227 0.117 0.044 0.059 0.530 0.030 0.038 Income 0.075 -0.018 0.005 -0.002 -0.073 0.620 0.049 Education 0.291 -0.193 0.031 -0.015 -0.218 0.203 0.133 Health 0.343 -0.035 0.510 0.283 -0.047 -0.036 -0.045 House 0.073 0.046 -0.049 0.013 0.153 0.297 0.171 ID career -0.143 0.463 0.157 -0.002 -0.002 -0.015 0.132 ID compe -0.145 0.483 0.168 -0.023 -0.081 0.059 0.044 ID marry -0.126 0.394 0.162 -0.013 -0.192 0.066 0.208
24 ID quit -0.123 0.355 0.143 -0.056 -0.124 0.150 -0.204 ID housew 0.048 -0.023 -0.024 0.018 0.111 -0.142 0.897 Fairness 0.059 0.168 -0.011 -0.055 0.651 0.001 -0.170 Past 0.401 0.261 -0.211 -0.133 0.031 -0.081 -0.052 Present 0.347 0.196 -0.264 -0.187 -0.177 -0.014 -0.044 Future 0.373 0.199 -0.137 -0.045 0.042 -0.157 -0.018 14-years 0.340 0.102 -0.197 -0.134 -0.293 0.008 0.003 Buddhism 0.034 -0.132 0.318 -0.610 0.022 -0.039 0.012 Religion -0.016 0.107 -0.316 0.615 -0.049 0.054 -0.025 Age 0.343 -0.035 0.510 0.283 -0.047 -0.036 -0.045
Parametric Index: Seven of the eigenvalue are higher than 1. That is, seven of the
components will be the coefficients of computation of the overall well-being index. These seven principal components explain 63% of all variation. Specifically, the first component roughly accounts for 17% of the total variation of the whole original data. The explanatory power in the seventh principal component is 5.4% of total variance, with decreasing explanation proportion continuously. By checking the eigenvectors and the weights of each indicator, it becomes indication which indicator from the component can be a major contributor and the positivity and negativity indicates the nature of their effects. An indicator with an eigenvector over 0.3 can be a contributor to the principal component (Heshmati et al, 2008; Heshmati et al, 2015). In the first component, the capability indicators are mostly above 0.3, are main contributors. The positive signs of the coefficients present a positive relationship between the hierarchies (that people think they in 10 years before, right now, will be in 10 years later and was in when they are 14 years old) and the principal component, and vice versa. However, it is difficult to further explain, because we do not know the specific information of each component, only know that they contained most variance of our indicators. From the table of principal components (eigenvectors), almost every variable contribute their information in the component, which help us computed a conclusive well-being index. I computed the PCA-WB by weighted 7 components to gain comprehensive index.
25
The matrix of the correlation which is table 4 shows that Correlation between each of the variables. The correlation between SWB and WBI is around 0.573, that means for WBI, SWB correlated with principal component analysis index around 0.573. SWB is important for WBI measurement. Health situation are also highly correlated to WBI. Identity questions are mostly not correlated with each other. They measured different aspect of traditional or newly identity. However, present hierarchy (which represent capability in the model) are highly correlated with future hierarchy and past hierarchy, normally we will choose one variable to represent the whole capability to avoid multilinearity. But, this case is special. By checking Principal component analysis index regression, present capability has negative effect on subjective Well-being and multidimensional well-being, which is contrary to past and future hierarchy. To exclude the influence of present hierarchy, it is better to put past, present and future hierarchy inside model.
5.2 Heterogeneity in well-being by Marital status
By statistically investigation, from graph 1 and graph 2, mean value of two gender by different marital status and Confucianism show below. From Graph 1, females who are in first marriage or unmarried status feel happier than the rest groups. Especially, unmarried women’s average well-being value is the highest. Women who are in first marriage is the second happiest group averagely. For the separation and divorced group, separation group means couple who are living in different house but not divorce. Female have the lowest well-being in separation group, while males’ well-being in separation group are not that significant low, not even lower than divorced male group. The female well-being’s variance is much higher than male’s when marital status.
From the marital status, the WBI, which is PCA weighted average index is similar as SWB. Unmarried women have the highest mean value than women who are in other marital status. Similarly, males in unmarried status are happier than others. Divorce
26
status is not the worse situation for male according to WBI, the worse situation is separation but not divorced, the same as female in SWB. However, in WBI, male and female have the same highest and lowest value, that unmarried situation is the happiest situation while separation but not divorced is the unhappiest.
5.3 Heterogeneity in well-being by Confucianism
From graph 2, the most interesting result is that female who have good attitude of Confucianism and who have very bad attitude towards Confucianism have highest well-being mean value, while male’s mean value shows decreasing trends by resisting Confucianism. According to Chen and Wen (2019), Hannum et al., (2013) and Maslak (2011), Confucian is one of the resource of traditional identity. Women who obey the rule of Confucian and are willing to play the role of traditional woman will feel happier than people who still confused about their identity, the people who still hold subtle attitude towards Confucianism and identity. Moreover, woman who resist Confucian, which is who clearly know that they prefer new identity and embrace their own choice, have the highest well-being. On the contrary, male in good attitude to Confucianism group have the highest well-being value.
Last but not least, WBI of Confucianism still shows the similar characteristics as SWB of Confucianism, that male who agree Confucianism more, who are happier; while female who disagree Confucianism are the happiest group. The female-male gap of WBI is biggest in group that people who disagree Confucianism mostly. Thus, Confucianism as the most influential thoughts in China still cause people confusing about their own identity only for female, not for male. However, some female are more willing to resist traditional identity to gain higher objective well-being.
With all the analysis above, it is only the mean of male, female and their statistics. What are all these variables relationship? To solve this confusion, linear regression between SWB, WBI has showed in Appendix, table 5 for female and table 6 for male.
27
6. Empirical analysis and discussion
6.1 The effects of education on female’s well-being
We gained table 5, the estimation of female’s SWB and PCA-WBI. From OLS model 1, subjective well-being are positively correlated to education, health situation, fairness, income, age, numbers of houses, and equally sharing housework (which belong to identity), negatively correlated to quitting and present hierarchy, not correlated to traditional marital identity. That is, with all controlling, the coefficient of education is 0.228, which represent the meaning that one level up of the education, 0.228 of the extra well-being that female will gain. The value of the dependent variables are all between 0 and 100, because the dependent variable has already normalized. Thus, the 0.228 of well-being value is not high compared with other indicators. In another word, the coefficient of the education is small and education is not influential. Education as an indicator does not play the main role in this model compared with other control variables. But in this case, we cannot see the influence from education to identity, capability and materials, even though the coefficients of identity, capability and materials are relatively bigger than education. As comparison, Principal component analysis well-being index shows very different results. Due to the peculiarity of PCA, we cannot get information of the absolute value of coefficient, but, we can see through the positivity and negativity of it. However, the sign of positivity changed. For example, identity indicators, except traditional career indicators, all the indicators are showing positivity relationship with WBI, while in SWB, almost traditional identity have negative effect on Well-being. Moreover, the capability indicators also have all positive relationship with WBI, while present capability have negative effect on SWB. Back to our focus, education in OLS of PCA-WBI still have the positive effect on WBI.
When come to individual effect of marital status, the model 2, OLS marital status results shows that for female, the unmarried group as benchmark, the coefficient of
28
education is 0.252 and also highly significant, which means for unmarried female, education one level up will bring 0.252 well-being up. Even though, the benchmark of the well-being value is from 0 to 100. However, compared with unmarried female, first marriage shows higher well-being, while the cohabitation, remarriage groups and divorce females own relatively lower well-being. The marital status does influence female’s well-being not only in Vientiane (Yoshikawa & Kamiya, 2019) but also in China. We handle it by control individual marital status effects. It turns out that the coefficient of education does changed after control marital status effects. Different groups will have different level of educational influence to well-being. The happiest groups are unmarried and first marriage females, which is consistent with heterogeneity in well-being by marital status.
When come to linear regression of PCA, almost all the variables are significant, even the absolute value of coefficient of education even increase compared with OLS in PCA-WBI. Almost all other groups with different marital status shows the same significance. It shows that when concentrating all the information such as material indicators, identity and capability into one index, marital status still influence the well-being level of female. After controlled, education is still the positive indicators.
The third model of SWB is OLS controlled Confucianism groups. The Benchmark of the Confucianism is the female that do not willing to answer their attitude towards Confucianism. We can see from table 5, the coefficient of education become very low and with small significance compared with pooled OLS. The female who owns bad attitude towards Confucianism significantly have lower well-being than the female who refuse answering their attitude. Furthermore, the PCA-WBI show different results, that is almost all the groups have higher well-being than benchmark. After controlled Confucianism, the coefficient of education do not change so much compared with pooled OLS of PCA-WBI. The only difference between SWB and PCA-WBI is the information concentration. SWB is subjective, only one dimensional index, while
PCA-29
WBI contained not only material indicators but also identity and capability those subjective indicators and formed into a multidimensional index. The female who owns bad attitude has higher multidimensional well-being, while female have higher subjective well-being when they agree with Confucianism.
6.2 Male-Female comparison of well-being
From table 6, the estimation for male is as a comparison to female. We can see from table 6 that the coefficient of education in SWB-OLS is 0.202, while female has 0.228. That is, one education level up will bring female more increasing well-being value than male. What is interesting is that almost all the traditional identity variables are significant for male while some of them are not significant for female. Thus, the traditional identity is more important for male’ being rather than female’s well-being. After controlling identity part, the regression is credible. The SWB OLS-marital status shows that when the unmarried male as benchmark, the coefficient of education is 0.275, higher than 0.202 which is female’s coefficient of education. Almost all the other marital status groups’ constant are significant. The male who separated or divorced has the lowest well-being compared with other marital status. It is the same results as female. Furthermore, the coefficient value of separated and divorced groups are lower than female’s, which means male who separated and divorced feel unhappier than female who is in the same situation. However, when come to PCA-WBI OLS-marital, all the other marital status are insignificant. The insignificance is a totally inverse situation with female’s PCA-WBI OLS-marital. It is inferenced that multidimensional well-being shows the objective fact that marital status has more influence on female rather than male. But, when controlled all marital status of SWB-OLS, the coefficient of education also increased just as female’s coefficient. It is the same with PCA-WBI’s regression. After controlled Confucianism, the coefficient of
30
education increased significantly in PCA-WBI also, which is also different from female. That is, Confucianism is also more important for male rather than female.
7.Conclusion
From all the analysis above, the main conclusion is that, education level of female is one of the determinant indicators of their well-being. Material indicators, identity and capability also contribute to well-being in the OLS regression model. Education have more influence on female’s well-being, rather than male’s well-being. When it comes to PCA-WBI, education always shows to have positivity of its influence towards well-being, not only for females, but also for males as well. The marital status and Confucianism does influence well-being across different groups by gender. However, multidimensional well-being index shows that marital status has deeper influence for females but not for males. Confucianism show to have negative effect on well-being of females, but not for males.
This paper investigates specific education, identity and capability relationship with well-being based on analyzing a large dataset, which is not common in this area. Especially for philosophical and traditional identity, most of the papers do not put those indicators into their model, even in China. Second, the new method principal component analysis contained fruitful information. When compared with subjective self-assessed unidimensional well-being, the multidimensional well-being including material information will shows the different results which is helpful to understand well-being more objectively.
However, the limitation of this paper is that all the variables are categorical, not specific numbers, which means the dataset is not informative enough to use non-parametric index, just as human development index. The categorical dataset is no perfect, but it is still sufficient to prove the relationship between education and well-being.
31
The second limitation is that we still cannot get the exactly relationship between education and identity or capability. By assuming, the education will bring identity conflict because of empowerment change, moreover, capability will be also positively influenced by education. However, in our case, we cannot test their exact relationship but only to combined the information into PCA.
Thus, this research in the future can be two directions. One is waiting for the dataset updating. Once the dataset has the specific numbers of subjective well-being, for example the percentage from 0 to 100 that people feel happiness about their life. The non-parametric method, whose famous application is human development index, can be used in this case. It will be more informative and constructive for measurement of well-being. Heshmati and Kim (2015) have done the similar measurement. However, this research due to the dataset constrain now, cannot do the same. It can be done in the future. Most well-being research are focus on the relationship between income and well-being. This research has explored the influence of correlated variable of income, education, and other related variables on well-being.
Moreover, the second direction is the specific relationship between education and other control variables, identity, capability and materials. It is not easy to investigate because some of the variables are hard to measure, or only measuring in subjective ways. For example, the relationship between education and identity is not linear. Women with high income can do more housework in family in order to remedy their traditional identity, which is from Bertrand (2013 and 2015)’s results.
For the political implication, level up of general education is one way to improve well-being in general, especially for females, because of education have deeper influence to females than males from our empirical evidence. Even though the average education level of Chinese is low. The traditional identity has negative influence to well-being of females, but not very significant when compared with males. Confucianism shows the similar results. Thus, the government is encouraged to form
32
the implementation of the family law, or publicity about new identity which contained equality of genders, wage and empowerment to secure equal right for women in the society.
33
Reference
Aitsi-Selmi, A., Chen, R., Shipley, M. J., & Marmot, M. G. (2013). Education is associated with lower levels of abdominal obesity in women with a non-agricultural occupation: An interaction study using China’s four provinces survey.
BMC Public Health, 13(1), 1. https://doi.org/10.1186/1471-2458-13-769
Akerlof, G., & Kranton, R. (2010). Identity Economics How Our Identities Shape Our
Work, Wages, and Well-Being . Princeton: Princeton University Press. Page 17,
22.
Alesina, A., Di Tella, R., & MacCulloch, R. (2004). Inequality and happiness: Are Europeans and Americans different? Journal of Public Economics, 88(9–10), 2009–2042. https://doi.org/10.1016/j.jpubeco.2003.07.006
Aryee, S., Fields, D., & Luk, V. (1999). A cross-cultural test of a model of the
work-family interface. Journal of Management, 25(4), 491–511.
https://doi.org/10.1177/014920639902500402
Bian, J., Ren, H., & Liu, P. (2020). Evaluation of urban ecological well-being performance in China: A case study of 30 provincial capital cities. Journal of
Cleaner Production, 254, 120109. https://doi.org/10.1016/j.jclepro.2020.120109
Bittman,M.,P. England,L. Sayer,N. Folbre,and G. Matheson. (2003).When Does Gender Trump Money? Bargaining and Time in Household Work. American
Journal of Sociology 109 (1), 186-214.
Bian, J., Ren, H., & Liu, P. (2020). Evaluation of urban ecological well-being performance in China: A case study of 30 provincial capital cities. Journal of
Cleaner Production, 254, 120109. https://doi.org/10.1016/j.jclepro.2020.120109
Bertrand,M. (2013).Career,Family,and the Well-Being of College-Educated Wome. American Economic Review: Papers & Proceedings 103(3), 244-250.
Bertrand,M.,E. Kamenica,and J. Pan. 2015. Gender Identity and Relative Income within Households. Quarterly Journal of Economics 130(2), 571-614.
Blanchflower, D. G., & Oswald, A. J. (2004a). Money, sex and happiness: An empirical study. Scandinavian Journal of Economics, 106(3), 393–415
34
Crowell, W. (2005). [Review of Images of Women in Chinese Thought and Culture. Writings from the Pre-Qin Period through the Song Dynasty (Book Review)].
Journal of the Economic and Social History of the Orient, 48(1), 131–134. Brill.
Canrong, J. (2001). The US Global Strategy in the Post-Cold War Era and Its Implications for China-United States Relations: A Chinese perspective. Journal of
Contemporary China, 10 (27), 309–315. https://doi.org/10.1080/10670560125619
Chen, M. (2018). Does Marrying Well Count More Than Career? Personal Achievement, Marriage, and Happiness of Married Women in Urban China.
Chinese Sociological Review, 50(3), 240–274.
https://doi.org/10.1080/21620555.2018.1435265
Cheng, Z., King, S., Smyth, R., & Wang, H. (2016). Housing property rights and subjective wellbeing in urban China. European Journal of Political Economy, 45(S), 160–174. https://doi.org/10.1016/j.ejpoleco.2016.08.002
Clark, A. & Lelkes, O. (2005). Deliver us from evil: Religion as insurance. PSE, Paris.
Connelly, R., Dong, X. yuan, Jacobsen, J., & Zhao, Y. (2018). The Care Economy in Post-Reform China: Feminist Research on Unpaid and Paid Work and Well-Being.
Feminist Economics, 24(2), 1–30. https://doi.org/10.1080/13545701.2018.1441534
Cindy Fan, C., & Huang, Y. (1998). Waves of rural brides: female marriage migration in China. Annals of the Association of American Geographers, 88(2), 227–251.
https://doi.org/10.1111/1467-8306.00092
Combes, P., Thisse, J., & Mayer, T. (2008). Economic Geography The Integration of
Regions and Nations. Princeton, New Jersey : Princeton University Press.
Davis, J. B., & Dolfsma, W. (2015). The Elgar companion to social economics: Second edition. In The Elgar Companion to Social Economics: Second Edition.
https://doi.org/10.4337/9781783478545
Deshmukh-Ranadive, J. (2005) Micro-Credit, Poverty and Empowerment: linking the
triad. New Delhi: Sage.
Di Tella, R., Haisken-De New, J., & MacCulloch, R. (2005). Happiness Adaptation to
35
Dong, X. Q., & Simon, M. A. (2010). Health and aging in a Chinese population: Urban and rural disparities. Geriatrics and Gerontology International, 10(1), 85–93.
https://doi.org/10.1111/j.1447-0594.2009.00563.
Graham, C., & Pettinato, S. (2001). Happiness, markets and democracy: Latin America in comparative perspective. Journal of Happiness Studies, 2, 237–268.
Gu hui, (2013), the state, the market and the return of traditional gender concepts in society, China academia 7th.
Fahey, T., & Smyth, E. (2004). Do subjective indicators measure welfare? Evidence from 33 European societies. European Societies, 6(1), 5–27.
Ferrer-i-Carbonell, A. (2005). Income and well-being: An empirical analysis of the comparison income effect. Journal of Public Economics, 89(5–6), 997–1019. https://doi.org/10.1016/j.jpubeco.2004.06.003
Frey, B., & Stutzer, A. (2002). Happiness and Economics: How the Economy and
Institutions Affect Human Well-Being. Page 59-60. PRINCETON; OXFORD:
Princeton University Press. doi:10.2307/j.ctt7rm1k
FUNG Y-LAN, A Short History of Chinese Philosophy. (1949). The Journal of
Philosophy, 46(12). Retrieved from
http://search.proquest.com/docview/1290668715/
Harrison, H. (2001). China. London: Arnold.
Harari, Y. (2015). Sapiens: A brief history of humankind (First U.S. edition). New York: HarperCollins.
Hannum, E., Zhang, Y., & Wang, M. (2013). Why are returns to education higher for women than for men in urban China? China Quarterly, 215(215), 616–640.
https://doi.org/10.1017/S0305741013000696
Hagerty, M. R. (2000). Social comparisons of income in one’s community: Evidence from national surveys of income and happiness. Journal of Personality and Social
Psychology, 78(4), 746–771.
Hare,D. (2016).What Accounts for the Decline in Labor Force Participation among Married Women in Urban China. China Economic Review 38, 251-266.
36
Heshmati, A., Su, B., & Kim, S.-A. (2015). Measurement and Analysis of Well-Being in Developed Regions in China. China Economic Policy Review, 04(01), 1550006. https://doi.org/10.1142/s1793969015500065
Heshmati, A., Tausch, A., & Bajalan, C. S. J. (2008). Measurement and Analysis of Child Well-Being in Middle and High Income Countries. The European Journal
of Comparative Economics, 5(2), 187–249.
Hess, A. S., & Hess, J. R. (2018). Principal component analysis. 1580–1582. https://doi.org/10.1111/trf.14639
Matud, M. P., López-Curbelo, M., & Fortes, D. (2019). Gender and psychological well-being. International Journal of Environmental Research and Public Health, 16(19), 1–11. https://doi.org/10.3390/ijerph16193531
Ji, Y., W. Xiaogang, S. Sun, and G. He. (2017). Unequal Care, Unequal Work: Toward a more Comprehensive Understanding of Gender Inequality in Post- Reform Urban China. Sex Roles77, 1–14. doi:10.1007/s11199-017-0751-1.
Knight, J., L. Song and R. Gunatilaka. (2009). Subjective well-being and its determinants in rural China." China Economic Review, 20, 635–649.
Knight, J. and R. Gunatilaka. (2010). Great expectations? The subjective well- being of rural–urban migrants in China. World development, 38(1), 113–1
Kahneman, D., & Krueger, A. B. (2006). Development in the measurement of Subjective Well-Being. Journal of Economic Perspectives 20(1), 3–24.
Kim, S. (2014). Does a money-is-all attitude cause alienation? A cross-cultural comparison of Korea, the US and Sweden. International Journal of Consumer
Studies, 38(6), 650–659. https://doi.org/10.1111/ijcs.12137
Liu, Y. (2017). Women rising as half of the sky? An empirical study on women from the one-child generation and their higher education participation in contemporary China. Higher Education, 74(6), 963–978. https://doi.org/10.1007/s10734-016-0102-0
Lei, X.& Xu, W.& Zhao, Y., (2014). Are high-climbing marriages more satisfying? Marriage matching patterns and their long-term effects, Economics (quarterly)