Author:
Tim von Oldenburg
Supervisor:
Pelle Ehn
Examiner:
Jonas Löwgren
Date of examination:
June 2, 2015
June 14, 2015
Representing bicycle-based interaction
An interaction design exploration into bicycling research
Abstract
In public spaces, we constantly interact with each other — whether we are aware of it or not. Most of these interactions are indirect and subtle, ranging from flâneurial people-watching, over negotiation of turns in urban traffic, to passive aggression. This is not only true for pedestrians, but equally so for bicyclists.
Bicycling is an embodied and social practice. When designing for cycle-based experiences, interaction designers face many problems while conducting research: mobility is always on the move and therefore hard to capture; the fleeting moments of interaction are almost imperceptible to the eye; and verbal accounts of bicyclists cannot represent the experiential qualities of a ride properly. While there exists a history of ethnographic studies into bicyclists’ behaviour, it proves to be difficult to enquire into these more subtle interactions. More conventional representations of experience, such as video, fail to capture many of the qualities inherent in taking a ride and being ‘out there’. It would be naive to neglect these qualities in our research when designing for cycle-based interaction.
This thesis builds on the work of ethnographers and designers engaged in bicycling research. It ex-plores new ways of enquiry that help researchers find out what really happens on the saddle and beyond.
Acknowledgements
I dedicate this report to my grandfather, Hans-Jürgen, who gave me his old Raleigh road bike. Not only did it serve as my main research instrument; it also made me rediscover the joy of bicycling. Thank you.
Furthermore, this project would not have been possible without the help of many wonder-ful people. I would like to thank all of them for any direct and indirect contribution: My supervisor, Pelle, for helping me navigate an unfamiliar research area.
Emilija, Fredrik, Jess, Laura, Luisa, and Sonja, for spending their spare time supporting my research as workshop and experiment participants.
Kamil, for the long hours we spent at MEDEA discussing ideas over fika.
And Rebecca, for believing in my work and passion, supporting me in every step and decision on my way.
Contents
1 Introduction
1
2 Related work
3
2.1 Designing for cycle-based interaction . . . 3
2.2 Ethnographic studies into bicycling as social practice . . . 4
2.2.1 Cycling Cultures . . . 5
2.2.2 Mobile place-making . . . 5
2.2.3 Cycling and talking together . . . 5
3 Theoretical framework
7
3.1 Place-making and purpose. . . 73.2 Chance encounters & vélomobile formations-in-action . . . 8
4 Methodology
10
4.1 ‘Being there’ — experiencing and studying bicycling practice in the field . . . 104.2 Representation . . . 11
4.3 Design experiments . . . 12
5 Workshops and design experiments
13
5.1 Pilot experiment — Video-tracking bicycle sociability . . . 135.1.1 Setup . . . 13
5.1.2 Execution . . . 14
5.1.3 Post-production . . . 14
5.1.4 Result and reflection . . . 14
5.2 Workshop — What moves the Malmö bicycling community? . . . 15
5.2.1 Participants . . . 15
5.2.2 Activity I . . . 15
5.2.3 Activity II . . . 16
5.2.4 Activity III . . . 17
5.2.5 Reflection . . . 18
5.3 Experiment 1 — Mobile soundscapes . . . 18
5.3.1 Setup . . . 19
Contents
5.3.3 Results . . . 20
5.3.4 Reflection . . . 22
5.4 Experiment 2 — Mapping spaces for interaction . . . 22
5.4.1 Execution . . . 23
5.4.2 Results . . . 24
5.4.3 Reflection . . . 27
5.5 Experiment 3 — Interaction Analysis . . . 28
5.5.1 Iteration 1 — Talking about the ride . . . 28
5.5.2 Iteration 2 — Talking to the ride . . . 31
5.5.3 Reflection . . . 35
6 Conclusions
37
1 Introduction
Bicycling is often considered to be a very solitary activity. But even when we are not riding in an inten-tional group — be it for a bicycle tour or as a group commute — bicycling can still be a social experience, as it does not take place in isolation, but “in complex choreography with other multi-modal road users” (Jungnickel2012, p. 29).
Compared to other modes of transportation, bicycling offers a unique combination of experiential qualities. Bicycling happens ‘out there’, outside of an enclosed room, which allows us to use all our senses and experience the trip and the environment with our whole body. This facilitates complex interaction which would not be possible e.g. within a car. At the same time, bicycling happens at a much higher pace than walking, which limits the range of possible interactions to some extent.
The importance of bicyclists for the socio-urban landscape has been recognized by city planners, social scientists, and designers alike. Researchers like Katrina Jungnickel, Rachel Aldred, Paul McIlvenny and Justin Spinney focus on bicycling as a social practice in much of their work. But bicycling communities themselves are starting to put more emphasis on social practice as well:
The Slow Roll movement¹, in analogy to the Slow Food movement, promotes a more conscious bicy-cling experience. Bicybicy-cling communities meet to ride a slow tour through their city, along neighbour-hoods and points of interest, allowing for appreciation of the cycling experience and social interaction. A different bicycle-related social phenomenon can be observed under the hashtag#CoffeeOutsideon social media like Twitter and Instagram. On their way cycling to work, people in cities all over the world stop and meet to have a coffee outside, together. The Critical Mass movement²is a series of mass bicycle rides all over the world. Goals differ between the various rides, but some want to be seen as protest over the motorization and bad bicycling conditions in cities, others want to be seen as a celebration instead. Yet all these intentional, planned interactions that happen when meeting up for a ride (like the ones above) tell only part of the story. When cyclists ride only for themselves, for example to commute or run errands, they encounter many other cyclists. Interaction takes place here as well, but in a much more subtle way. Explicit interaction, such as starting a conversation, is often unwanted and uncomfortable; thus, this research focuses on indirect interactions.
One phenomenon that is largely unexplored are so-called vélomobile formations-in-action. McIlvenny (2014) describes them as the different formations a pair of cyclists can take in order to sustain a conver-sation. However, these formations and the processes of entering and leaving them happen as well with strangers; here, they might serve other purposes than conversations. Chance encounters happen all the ¹ Seehttp://www.slowroll.bike/
1 Introduction
Figure 1.1: A Slow Roll tour on break. Picture by Slow Roll Detroit.
time, and the subtle interactions are numerous: For example a negotiation of pace when trying to pass another cyclist; for example a mutual, silent appreciation of each other’s bicycle; for example a demon-stration of physical stamina when overtaking someone else with high speed on an upward slope. These microinteractions contribute to the total experience of every bicycle journey, and they make up one of the differences to riding the car: the opportunity to engage with other people and the environment in a direct way.
Designers are starting to recognise the possibilities that everyday mundane road interactions offer. The Hocman project, described by Esbjörnsson, Juhlin, and Östergen (2003), tries to create a space for interaction after brief encounters between motorcyclists; Cromwell (2013) approaches indirect social interaction on bicycles from the standpoint of urban planning and landscape architecture; Cheng et al. (2013) design for co-presence during bicycling exercise; and Rowland et al. (2009) derive guidelines for designing cycle-based interactive experiences. Looking at the numerous ways that bicyclists engage with other road users and the environment, one can see the role that interaction design can play in shaping the future socio-urban space. This will become even more relevant while cities adapt to the growing number of cyclists.
In order to design for bicyclists, we must find ways to capture and represent their subtle interac-tions on the road. Using a framework of design experiments, ethnographic methodology, reflection and representation, I explore the space around my research question: How can we create representations that convey a richer account of the bicycling experience and use them to enquire more deeply into cycle-based interactions? The result is a repertoire of methodological contributions — research tools —, based on videography, audiography, and mapping. They may be of interest to any enquirer into bicycling practice: design practitioners, design researchers and ethnographers alike.
2 Related work
This chapter describes related work from the area of cycle-based interaction. As this thesis research aims to yield methodological knowledge, not only design artefacts are relevant as exemplars, but also ethno-graphic and design research that enquires into the bicycling practice and, thus, shows the methodology currently used in such circumstances.
2.1 Designing for cycle-based interaction
While arguably most of the relevant literature regarding bicycling originates in the social sciences, one can find some works within different areas of design that deal with bicycling or related concepts.
There are many smartphone applications that aim to enhance or complement the bicycling experi-ence. Most of them are targeted towards professional and recreational bicycling (e.g. Strava, Map My Ride, Runtastic) and some towards (political) activism (e.g. Bikes vs. Cars, Charity Miles, Social Cyclist). But all of these applications have in common that they do not require nor afford any interactivity dur-ing the ride. They either serve as a dashboard, mounted to the handlebars and used to get a glance of data like pace, distance, route, calories burned etc.; or they work for themselves, sitting in the pocket of the cyclist for the duration of the ride. In both cases the interaction with the application is limited to starting and stopping an activity at the beginning and end of the ride, respectively. The cyclist does not engage with the application during the ride, nor does she engage with the environment or other cyclists through it during the ride. These applications are thus not good examples from an interaction design point-of-view.
Esbjörnsson, Juhlin, and Östergen (2003) describe Hocman, a mobile application that fosters interac-tion between motorcyclists to complement random encounters on the road. Hocman creates a virtual layer on top of the motorcycling community, which allows its members to enjoy each others sociability — however, not in situ. Users can create a hypertext page about them and their motorcycle, containing e.g. preferred routes, motorcycle model, and applied tunings. This page is then uploaded onto a de-vice they carry during the motorcycle ride. Whenever they pass a motorcyclist using Hocman in some distance, they exchange their respective pages automatically. This way, the motorcyclists’ engagement with each other can be deepened and extended — to find others with similar interests, appreciate each others motorcycle, and even meet up for a ride.
Cromwell (2013) approaches indirect social interaction between bicyclists from the perspective of landscape architecture. He proposes designs for bicycle facilities to enhance the social experience of everyday bicycling. Cromwell finds that main aspects to keep in mind while designing for cycle-based
2 Related work
interaction are speed and time. He concludes that, for social interaction to take place, upward slopes are actually good — because they decrease the maximum speed of any bicyclist, thus lowering the cyclists’ speed differential and allowing people to stay close to each other for a longer period. The longer two people stay in proximity, the more room for interaction exists. As a landscape architect, Cromwell aims to shape the landscape in order to better the conditions for social interaction. His work gives oppor-tunities, but does not enforce interactions that are unwanted. This is an important aspect, as we will learn in a later chapter that the willingness for social interaction is depending on culture (and other circumstances). Designing for cycle-based interaction must acknowledge this.
Rowland et al. (2009) focus on interactive experiences for cyclists. By analysing two different experi-ences they derive eight factors that are relevant for designing cycle-based interaction:
• Cycling skill varies greatly
• Cycling is a demanding physical activity
• Cyclists have a close connection with the environment
• Cyclists can cover wide areas
• Digital media must adapt to cycling
• Hardware interfaces must be carefully integrated into the overall bike hardware
• Cycling limits social interaction
• Safety matters
Although Rowland et al. analysed interactive experiences, their learnings are relevant for many kinds of cycle-based interaction, especially if additional artefacts are involved.
Cheng et al. (2013) focus on bicycling as exercise. Previous research had shown that social peer effects enhance the exercise experience, but Cheng et al. have seen a lack of concrete design advice in this area. They subsequently suggest designs for enhanced bicycling gear, such as glasses, that convey the feeling of the co-presence of another, remote cyclist. They identify factors that are relevant for and propose “an unobtrusive and intuitive interface arrangement based on light” (2013, p. 20) that indicates if you are ahead or behind your exercise partner.
2.2 Ethnographic studies into bicycling as social practice
Ethnographic studies into the practice of bicycling have been conducted by researchers with many dif-ferent foci. The following three examples constitute recent research that either includes reflection on the methodology that has been used, or document the used methodology detailed enough to allow an examination from the outside. As my research work aims to explore the methodological space, the methods applied by other researchers are an important reference.
2 Related work
2.2.1 Cycling Cultures
A prominent research project regarding the social practice of bicycling was taking place in four different UK cities as a joint effort of Rachel Aldred and Katrina Jungnickel (e.g. Aldred2010; Aldred and Jung-nickel2012; Jungnickel and Aldred2014). Cycling Cultures, a multi-method sociological research project at the University of East London, yielded insights on how cycling is practised, experienced, and repre-sented in different localities. The researchers accompanied many single and group rides over the course of two years. Aldred (2010) examines how, in a heavily-motorised country, cyclists define themselves as citizens in relation to their natural and social environments. Aldred and Jungnickel (2012) analyse how rhythm, positioning, and communication in group rides lead to the creation of mobile places. And in Jungnickel and Aldred (2014) they look into how cyclists manage their exposure to the environment using audio devices.
Part of the outcome of this study was also Jungnickel’s reflection on the methodology that was used, in particular videography and photography. In Jungnickel (2014), she describes how a time-lapse video can help represent the bicycling experience with all its “Jumps, Stutters, Blurs and Other Failed Images”. In Jungnickel (2012), she describes how she employed portrait photography to convey the out there-ness that cyclists experience — having the view ‘from the saddle’ as opposed to a view framed by a car window. While photography is not in focus of this thesis, Jungnickel’s work on time-lapse videography is adapted in the pilot experiment (see chapter5).
2.2.2 Mobile place-making
Spinney (2009), through an ethnographic narrative, tells the story of an imaginary bicycle ride through London. In this, he examines how apparently dull places, such as certain roundabouts or underpasses, have meaning for cyclists and thus become places. Spinney’s research opposes Marc Augé’s assumption that spaces of transition and mobility are non-places. Certain places lead to different route choices for different cyclists; for example, one cyclist might avoid a multi-lane, busy roundabout for reasons of safety, while another likes the challenge and sensation of ‘flowing’ between different cars and the opportunity to ride fast with the traffic.
In other work (2011), Spinney discusses three different ways to use mobile video ethnography in cycling research: “video as a way of ‘feeling there’ when you can’t be there; video as a way of apprehending fleeting moments of mobile experience; and video as a tool to extend sensory vocabularies.” (2011, p. 161)
2.2.3 Cycling and talking together
McIlvenny (2014) analyses different vélomobile formations-in-action (see chapter3) that two bicyclists create in order to sustain a conversation. His analysis makes use of video recordings and transcribed conversations. Multiple cameras are mounted in different angles from the participants’ point-of-view.
The focus in McIlvenny’s work lies on the relationship between the participants, how they act as a group and expose their being-a-group. It is not so much focused on the relationship between the
par-2 Related work
ticipants and other actors (such as other road users or the environment), but more on the internal re-lationship. McIlvenny analyses the video recordings along with the conversation, by transcribing indi-vidual moves of the cyclists (e.g. “H pulls up to the red traffic lights”) together with the spoken words. While other actors are mentioned (“a pedestrian is walking on the cycle path up ahead”), they are only treated as triggers to switch into different vélomobile formations-in-action (“Lyn moves ahead into single file formation”).
3 Theoretical framework
This chapter introduces theoretical concepts that build the foundation of this thesis. As I focus on researching the social practice of bicycling, it seems mandatory to explore the theory of social relations, with special focus on mobility. Furthermore, I look into the social creation of meaning, which leads to place-making. Lastly, this chapter introduces random vélomobile formations-in-action, which are one situation where cycle-based interaction can take place. They are used as an example throughout this thesis report.
3.1 Place-making and purpose
As bicycling is a form of transportation, the movement within space and the concept of place play an important role. Harrison and Dourish (1996) note that “a place is a space which is invested with un-derstandings of behavioural appropriateness, cultural expectations, and so forth” and that places are “spaces that are valued” (1996, p. 3). A place is made by associating meaning with a space, but what does this mean when you are mobile (and thus move within space constantly)?
Marc Augé coined the term ‘non-place’ and used it to describe spaces of transition and mobility, for example bus stops and motorways. They are places “where interactions are structured by rules not defined by the people in them” (Spinney2007, p. 25). Augé argues that “we do not find these spaces meaningful” (Spinney2007, p. 28), due to their nature of fleetingness, temporality and ephemerality. Spinney opposes this assumption with respect to bicycling, as cyclists engage with their socio-urban environment in an embodied and sensory way (2009). He offers an account of meaningful embodied experiences of non-place by means of a narrative of an imaginary bicycle ride through London (2007).
When designing for cycle-based interaction, one must keep in mind the purpose of a ride and, re-sulting from it, the nature of interactions. We ride the bike for reasons of exercise, as a recreational leisure activity with friends or family, or as a commute (‘getting from A to B’). The term ‘flâneur’ has connotations of idleness, exploration, or conoisseur. While it is mainly used with respect to pedestri-ans, it can apply to other modes of transportation just as well. Flânerie is often the main purpose for motorcycle rides, and Oddy (2007) applies this concept to bicycling. As Spinney (2007) proves, even commuting cyclists do not see their ride as pure ‘utility’, and Aldred and Jungnickel (2012) come to the same conclusion.
3 Theoretical framework
3.2 Chance encounters & vélomobile formations-in-action
Erving Goffman studied people’s relations in the public (1971). He came to the conclusion that social interaction in the public takes either place alone or in a group, and dubbed these two modes ‘single’ and ‘with’, respectively. Jensen (2010) transfers Goffman’s ‘with’ to the realm of mobility. He also acknowl-edges the ephemerality of such ‘mobile withs’:
[I]n the mundane and ordinary everyday life we make multiple ‘temporary congregations’ as we are slipping in and out of different ‘mobile withs’ … ‘Mobile withs’ might be exemplified by groups of recreational runners or cyclists. — Jensen (2010, p. 341)
During bicycle rides, especially in urban areas, we often have chance encounters — encounters with strangers who just happen to be at the same place at the same time as we are. In bicycle traffic, most of these are probably other cyclists passing by, riding into the direction we were coming from. But other encounters happen as well: we overtake or are overtaken by other bicyclists, or we ride behind someone for some time, for example because they match our pace or there is no way around them. In these cases, we temporarily form vélomobile formations-in-action.¹
Paul McIlvenny describes vélomobile formations-in-action as “specific arrangements of bodies on bikes and configurations of a ‘vélomobile with’ ” (2014, p. 137). His work focuses on two or more peo-ple on bikes intentionally riding together and trying to maintain a conversation. In chance encounters, however, these vélomobile formations-in-action are random, as the intentionality is missing. Rather, these formations describe temporary arrangements of bikes and people who are most likely strangers, and just happen to ride together in the same direction, at the same time, at a similar pace, for part of their respective journeys. This phenomenon occurs frequently in urban bicycle traffic, yet we seldom make note of it. The following imaginary narrative describes a scenario containing the phenomenon:
Johan’s commute leads him from Rönneholm in Malmö to the city’s university in the west-ern harbour. Early in this journey, he passes in front of the city library on Kung Oscars väg and turns left onto Slottsgatan, which immediately overpasses Fersens bro, a slightly ascending canal bridge. While taking the left turn, Johan moves into traffic next to Marie, who was approaching from his right. At this spot, the bike lane is wide enough for the two to ride side-by-side. As they are ascending Fersens bro, they maintain more or less the same pace and stay next to each other. After the climax, the bike lane narrows down. Johan sprints forward in order to slip in the front of Marie, making space for oncoming cyclists riding into the opposite direction. They continue to ride in a formation (in line, “singled up”) until Marie turns right towards Stortorget.
¹ It is important to note here that ‘vélomobile’ does not refer to the vehicle of the same name (seehttps://en.wikiped ia.org/wiki/Velomobile), but rather to the concept of being mobile using a bicycle (rather than a different vehicle).
3 Theoretical framework
Figure 3.1: Illustration of Johan’s and Marie’s route
During their chance encounter on Fersens bro and after, Johan and Marie are in a ‘vélomobile with’ and form a vélomobile formation-in-action. They negotiate their formation with respect to each other’s cycling abilities and the current environment, without having met each other before.
Random vélomobile formations-in-action are a relevant example for cycle-based interaction because they occur frequently. They both offer space for cyclist-to-cyclist interaction, due to their nature of proximity and matched pace, and they may serve as a trigger for other actions. In this thesis, vélomobile formations-in-action during chance encounters are used as an exemplary target of enquiry.
4 Methodology
This chapter introduces the methodological framework that defines the activities of this thesis project. It encompasses the concepts of ‘being there’, the creation and use of representations, and the exploration of the design space through experiments.
4.1 ‘Being there’ — experiencing and studying bicycling practice in
the field
Bicycling is a practice that is shaped by “the sensory, embodied and social nature of performance” (Spin-ney2011, p. 163); embodiment concerns the placement of the cyclist’s body and her acting within the environment. It is therefore crucial to perform bicycling research in the field, with one’s own body and always paying attention to the subject’s body and interactions. In order to design for cycle-based inter-action, one cannot (only) study bicyclists in the lab. In this, enquirers into the cycling practice seem to agree with each other: the knowledge is in the practice of bicycling, not in the head of the cyclist.
Spinney states that “techniques such as surveys are too distant from the embodied practice of cycling, relying at best on verbalised accounts of practice divorced from the context of doing that is so funda-mental to the creation of meaning in mobile practices.” (2011, p. 163) And as many studies successfully show, ethnography provides more capable tools to capture the experience of bicycling: they do not only rely on in-depth interviews or informal chats, but on ride-alongs and videography. Spinney also ex-presses the importance of domain-orientation: in order to study bicycling, it sure helps to spend time on the bicycle and with bicyclists.
Reflection in situ
‘Being there’ affords a mode of reflection that does not happen after, but during the bicycle ride. Beyer and Holtzblatt (1997) describe Contextual Inquiry, part of which is a ‘think aloud’ — the activity of ver-bally describing what you are doing and why you are doing it at the exact moment of doing it. For Beyer and Holtzblatt, it is also important for the researcher and subject to take on roles similar to ‘apprentice’ and ‘master’ — the researcher tries to learn from the subject. The way of reflecting that is required in a Contextual Inquiry is what Schön (1983) calls ‘reflection-on-action’.
To complement existing videographic methods, this mode of reflecting in situ can lead the cyclist to make her subtle actions and interactions more obvious to the researcher. Therefore, to explore the ways
4 Methodology
that reflection in situ might contribute to research methodology, I let the work of Schön and Beyer & Holtzblatt inform one of my experiments.
4.2 Representation
Things are made visible so that they can be seen, talked about, and potentially, manipulated. — Suchman (1995, p. 62)
As stated earlier, much knowledge about the practice of bicycling is not in the cyclist’s consciousness, but in her body. It is tacit, which means it is difficult for the cyclist to communicate it to the designer-researcher in situ. Yet re-presentation of an experience can help codify this knowledge, as Spinney (2011) suggests.
When researching cycle-based interaction, the researcher needs to make the subtle interactions ob-vious in order to be able to consider them in the design process. For this, Jordan and Henderson (1995) describe a research practice called Interaction Analysis. It makes use of audiovisual recording, transcrip-tion, and re-views with analysts and subjects. Spinney (2011) further elaborates how video ethnography can be used in bicycling research. Two of the experiments described in chapter5make use of video-graphic methods, and I subsequently reflect on them in relation to Interaction Analysis (Jordan and Henderson1995) and Spinney’s framework.
Video, however, is not the only medium of representation I apply in my experiments; a second one is audio, and a third one is mapping. While I use videography and audiography in a way that is focusing on a single bicyclist’s interactions, I use mapping in a way that encompasses many cyclists and aims to extrapolate possible spaces for interaction.
Reflection through representation
Jordan and Henderson (1995) correctly recognise the bias of camera operator, technology, and analyst in doing Interaction Analysis using videography; they remind the researcher to always be aware of those biases. Having said that, I think they miss an opportunity that Suchman states as follows:
The representations ethnographers create, accordingly, are as much a reflection of their own cul-tural positioning as they are descriptions of the positioning of others. This is not a problem or limitation to be overcome; it is a fundamental aspect of representational work, to be understood and incorporated into our practices and into what we produce. — Suchman (1995, p. 62)
In other words: ethnographers can embrace and make use of the interpretive power of representa-tions, while never just seeing representations as empirically definite. In my research work, videography is not simply used to observe and describe, but to enquire into and have a conversation with bicycling practice. This takes place by deliberate manipulation of the video material to represent otherwise invis-ible events, and by conversing over the video material in a similar way that Jordan and Henderson (1995) suggest.
4 Methodology
Maps are affected by biases in the same way, and can be utilized the same way. Denis Wood states: “Freed from a pretense of objectivity that reduced it to the passivity of observation, the map can be restored to the instrumentality of the body as a whole.” (in Suchman1995, p. 61) In my research I do not use the map as an instrument of reflection, like I do video, but it still is a tool that I tweak for my purposes. This becomes very explicit in my own discussions on experiment #3 (see chapter5). In there I elaborate how the outcome — a map highlighting places with good conditions for cycle-based interaction in Malmö — depends not only on the data, but also on the researcher’s choice of parameters: how many rides in one area make an area “frequently visited”? How slow is “slow”?
4.3 Design experiments
This thesis does not aim towards creating a new, better method for enquiry into cycle-based interaction. Instead, I aim to explore the design space of tools for the enquiry into cycle-based interaction. The main vehicle for this exploration is a set of design experiments.
Binder and Redström suggest the notion of “exemplary design research driven by programs and exper-iments” (2006, p. 3). While the frame of my research work is not a research programme, its explorative nature invites a similar approach. Binder and Redström further state that their suggestion “enables crit-ical dissemination through examples of what could be done and how” (ibid.). There is a clear parallel to how my research progresses:
I create examples — the actual artefacts; representations like videos, maps, and sound recordings, produced by my design experiments. At the same time I create the experimental methods that lead to those representations. In doing so, I suggest changes to design research practice in a similar way that Binder and Redström think of changes to design practice. My work is located in the area of methodology, so the intended outcome is naturally different than what they have in mind; it is research about research. Given the limited time of this project, I argue that a programme-like approach is most fruitful. Bang and Eriksen (2014) advocate the use of design experiments through all stages of a design research pro-gramme. In their vocabulary, my explorative work would be settled in the Beginnings stage of a (hypo-thetical) research programme: setting the stage, driving and framing the research efforts. On a smaller scale, though, this formulation allows me to reframe the research question without having to start from zero. While it is not reflected in this document, my focus shifted over the course of this project: from a search for possible design openings for vélomobile formations-in-action, towards ways to enquire into them, finally to an exploration of methodological instruments for bicycle-based interaction research. The use of design experiments in a programme-like manner made this possible, while still ensuring relevant knowledge contributions.
5 Workshops and design experiments
This chapter describes the different workshops and experiments that I conducted in the course of this project. Due to the explorative nature of my design process, the chapter’s five sections do not represent my activities in chronological order:
To get a first impression of the design space, I executed the pilot experiment before the actual thesis work started. Subsequently, I conducted the workshop to learn more about the bicycling community in Malmö. However, the three main experiments — although numbered 1–3 — had not been executed in this order, nor did one experiment lead to another. They all explore methodology for doing bicycle-based interaction research through different aspects: soundscapes, mapping, and videography.
5.1 Pilot experiment — Video-tracking bicycle sociability
Jungnickel (2014) describes a method of creating time-lapse videos of bicycle rides with the aim of conveying a sense of ‘there-ness’ resulting from the visual experience. This experiment builds on her method and, in addition to the feeling of ‘being-there’, tries to convey a sense of the fluctuating social environment during the ride as well. In other words, I aim to represent Jensen’s (2010) interpretation of the ‘mobile with’ as well as was Jungnickel (2014) calls ‘feeling there’.
In order to do so, I recorded photos of two rides around the city of Malmö. Just as Jungnickel did, I composed these photos without any further editing or filtering into a time-lapse video. However, instead of just playing the time-lapse at a constant speed, I modified the frames per second (FPS) of the video depending on the size of my current formation: when I was riding alone, the video would play at a fast pace, and it would slow down whenever I would be with others; the bigger the formation, the slower the video.
5.1.1 Setup
After a few short tests with several time-lapse applications, using a mobile phone camera for image capture proved not to be feasible. The bike mount I had available did not allow for the phone to be in an upright position (so that the camera could point forwards). The images it caught were shaking, alternating in brightness, had blurs (probably because of refocusing) and were — worst of all — not very interesting, as they showed mostly my front wheel and part of the road in front of me. Instead, I used an action camera (in this case a GoPro HD Hero 2). The camera came with a proper bike mount for the handlebars, and is made for ‘action’ situations, i.e. short exposure, bad lighting conditions, and heavy
5 Workshops and design experiments
shaking. Before starting the ride, I set the camera to time-lapse mode, which means that it captures still images in defined intervals. I set the interval to be 500ms, which is the shortest interval supported by the camera. This seemed sufficient for the purpose, as Jungnickel used 2-second intervals.
In addition to the equipment for capturing pictures, I used my phone to record audio. Using a simple audio recording application and a headset with the microphone placed near my neck, I could record any thoughts and remarks I had during my ride, and thus record any non-visual impression: specifically, the size of any vélomobile formation-in-action I was part of.
5.1.2 Execution
Before going on the ride, I started the audio recording on my phone. I then started the action camera while noting the exact time in my phone. The ride itself was made at a more or less constant pace, but as naturally as possible. Whenever the number of people around me changed because I joined or left a formation, passed someone, or was passed by someone, I recorded the number of people in my formation by speaking into the microphone. This way, I captured two different rides on the same day, in the following referred to as Ride A and Ride B.
5.1.3 Post-production
Ride A went for about 30 minutes and captured more than 3000 photos, whereas Ride B went for about 15 minutes and captured more than 1500 photos. With the command-line programffmpegI created a time-lapse video from each of the rides at 30 frames per second (FPS). This would be the speed repre-senting my solitary phases during the ride. Then, using the video editor iMovie, I slowed down all the scenes in which I was part of a formation. As I carried out this modification manually, the exact speed at which the non-solitary parts of the video play is not constant, but precise enough to make the viewer understand the connection.
Ride A
time-lapse video can be found here:https://youtu.be/OpHkQP4lNroRide B
time-lapse video can be found here:https://youtu.be/lr9p_OyNHlA5.1.4 Result and reflection
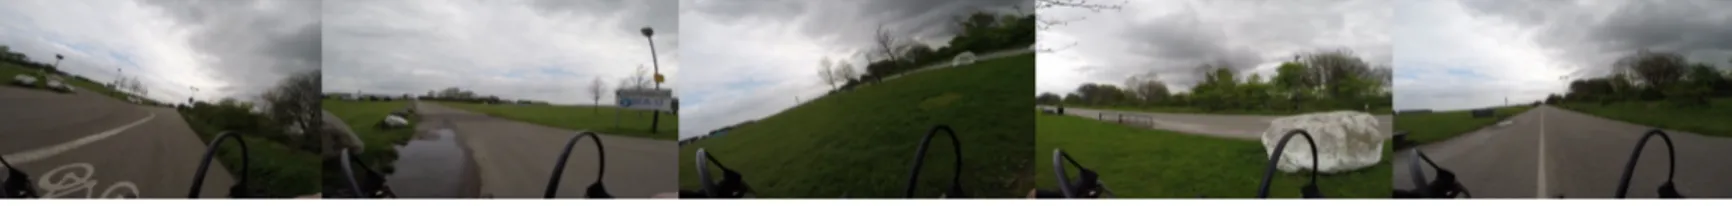
The result of this experiment are two time-lapse videos of my bike rides through the city of Malmö.
Figure 5.1: Stills from Ride B
In both videos, the solitary parts (‘single’) are significantly more prominent than the parts I am part of a formation (‘with’). However, in the video of Ride B I am part of a bigger formation — up to five people
5 Workshops and design experiments
at one point. The contrast between the different playback speeds can be ‘felt’ and seen quite clearly here, more so than in the video of Ride A.
Both videos start with a solo ride and the full 30 FPS. Thus, the transitions between individual frames are short and the overall scene gives a smooth visual impression. However, as soon as I slip into a for-mation with other cyclists, the number of FPS is (intentionally) cut in half. This is very visible, as not only the playback is slower, but the transitions are sudden and somewhat ‘choppy’. While it is generally beneficial that the change in formation is very noticeable, the visual characteristic distracts from the ac-tual message at hand, because it feels like a decrease in quality (which, strictly speaking, it is). With this in mind, it might be worth to utilise a proper video recording instead of time-lapse in another iteration of the experiment. This way, the video would never fall underneath 30 FPS and would be more pleasant to watch.
This experiment did not serve the purpose to explore ‘new’ methods for bicycling research; back when it was conducted, this was not the frame of my research yet. It led me, however, to question the ways in which we employ representations in our research. Using simple existing tools and a metaphor of time, I could employ video to represent and convey a non-obvious aspect of the bicycling experience.
5.2 Workshop — What moves the Malmö bicycling community?
In order to get a general understanding of the bicycling culture in Malmö, as well as to learn about bicyclists’ understanding of vélomobile formations-in-action during chance encounters, I conducted a workshop at the beginning of the project phase. This section describes the workshop structure, tasks, and outcomes.5.2.1 Participants
The workshop had four participants; three students and one full-time employee. Two participants were female, the other two were male. The participants were all of different nationalities. All participants named “commute” as their main reason to cycle; however, one also stated “I bike because I take my daughter back and forth”, and two others said they would bike just for fun sometimes.
5.2.2 Activity I
The first activity stood under the general question “What moves cyclists in Malmö?”. The goal was to identify topics that are of high importance to Malmö’s bicycling community. These topics could be pos-itive, negative, or neutral, and could be as general as “the bad weather” and as specific as “the confusing roundabout near Kungsgatan”.
The format of this activity was a short, solo brainstorming session followed by a round of presenting and discussing the results. Finally, we created an affinity diagram of the topics.
The outcomes were quite balanced between positive and negative impressions. The clustering showed that two topics are especially concerning for the participants: infrastructure and other road users. Other
5 Workshops and design experiments
Underpasses Flat
Bike traffic lights Short distances Heavy winds
Air pumps
coffee, moving,
transporting kindergarten kids
Infrastructure Environment
Positive Negative Positive Negative
Bike transport with train/bus is not easy Tree roots coming out of the surface Speed bumps hurt
Great bike lanes (some areas) Bike stands fit only narrow tires Bad weather: wind, rain
Waste bins for throwing while riding Why can't I cross the Oresund bridge?
Bike parking at Centralen Areas without bike lanes Community / Society
Too narrow bike roads
Hand rails at traffic lights Zebra crossings without stop lights Good Bad
Glass on the bike path
Bike stands that do not allow to lock your bike Everyone bikes all year People walk on the bike path Bike turnabouts are badly designed Big bike community: Cykelkoket, Slow roll, etc Cars take your right of way
Nobody uses the turn signal
Bicycle Drivers open car doors and do not look
Positive Negative
Cargo bikes for everything: Bike lights are mostly crap
Where do I register my bike (theft etc)?
Figure 5.2: Cluster diagram — what moves the Malmö bicycling community?
topics of concern were the bike itself and the environment. These four clusters provide design spaces for different disciplines, such as urban planning, landscape architecture, and interaction design.
5.2.3 Activity II
After the first activity, I introduced the participants to the concept of vélomobile formations-in-action. I showed one of the time-lapse videos that were produced during the pilot experiment, and told a story reminiscent of the narrative in chapter3. After making sure that everyone had an understanding of the phenomenon at hand, I asked the participants to share their own experiences with it. This took place in a conversational manner.
The participants agreed that they had not thought about these situations consciously before. They also agreed that in most cases, they do not take any effort to stay together with someone else — three said they would probably overtake other cyclists, except if they got stuck because of oncoming traffic. One participant stated that she never talked to a stranger while on the bike. If they would bike up to a stranger and stay next to them for a while, the participants stated that it would make themselves really uncomfortable. They expected the stranger to perceive it as privacy-invading and odd. Partly, they grounded this assumption in Swedish culture: “Swedes are famous for not starting conversations.” While only one of the four participants was Swedish, this activity shows that the cultural background and the goal of the cyclists cannot be disregarded. Looking at the participants’ goals when riding, most of them stated that they ride for utility purposes mostly (“It’s just something you do, right?”). Two of them, however, mentioned that they would sometimes ride just for fun — without a specific destination,
5 Workshops and design experiments
but more in a flâneurial manner. In these cases they would bike slower, not trying to overtake everyone they encounter.
It was also mentioned that vélomobile formations-in-action during chance encounters are probably more common in Copenhagen than in Malmö. In Copenhagen, some bicycle paths have nearly the character of roads or highways, and you can often see “road trains” of bikes passing by.
5.2.4 Activity III
The aim of the last activity was to connect the themes identified during Activity I to random vélomobile formations-in-action, which had been introduced in Activity II. This was executed as a form of brain-storming in groups of two. Each group picked three themes that they found most interesting; I then asked them to come up with as many ideas as possible that would connect their themes to vélomobile formations-in-action, either fostering them or making use of them in some way. The participants had 10 minutes for this activity.
Doing so proved quite difficult for the participants. While some results came up that related to these formations, most drifted away from the original goal.
Handrail dating
In Malmö, many bicycle path crossings with traffic lights have handrails on theirsides. Bicyclists can rest their hands and feet on them while waiting for the light to turn green, without having to get off the saddle. One idea that came up was to match romance-seeking bicy-clists at these spots, similar to a service like Tinder¹. The cyclist at the front of the handrail could express interest in the one on the opposite side of the crossing. Another variation we discussed was to do a sort of biological matching depending on the cyclists hand- and fingerprints. While this idea is about chance encounters, it does not concern vélomobile formations-in-action.
Ad-hoc tandem
A bicycle model that, together with others of its kind, can quickly be assembled into an ad-hoc tandem. Just by owning this kind of bicycle, people express interest in meeting other people. We thought that this could be especially interesting to people who are new to a city and seek someone to explore it with, or for tourists with the same intention.Mesh messaging
Using proximity of two cyclists, a message could be spread over from one cyclist tothe next. This sort of mesh messaging was used, for example, in Hongkong during the student protests of 2014²while the cell network was overloaded. It is easy to imagine variations thereof, most of them as games: a team tag game in which you tag other, unknown bicyclists, by means of their Bluetooth fingerprint; a game where you have to spread a message from one place in the city to another, without actually going there; a way of peer-to-peer file-sharing without a centralized network.
¹ Tinder is a mobile dating application, seehttp://www.gotinder.com/
5 Workshops and design experiments
All these rely on people riding close to each other for at least a short time. In case of a game, this time could be artificially extended, by requiring that you have to stay at leastnseconds next to someone — which would sometimes even force you to take a different route than you intended.
5.2.5 Reflection
This workshop intended to get an overall impression of the bicycling community in Malmö. It was quite challenging to find any participants at all, and one can say that the four participants of this workshop are not representative for the bicycling community in Malmö.
The workshop format seems reasonable to uncover general issues of concern for a biking community. The participants did not have a hard time recalling why they like to bicycle in Malmö, and what factors are detrimental to their ride experience. They had, however, more difficulties when the focus changed towards vélomobile formations-in-action. While they all understood the concept, it was hard for them to relate to these phenomena out of context. The workshop format seems not suitable to enquire into specific interactions, especially if they are rather subtle and experiential. This is an interesting learning outcome in itself — other methods might be more successful.
That being said, the workshop results are still interesting and relevant. A common theme of the ideas generated in Activity III is playful interaction. While only the last of the ideas listed in the previous section could be an actual game, it can be said that ad-hoc tandems and handrail dating at least have a playful side to it. Another relevant outcome is the collection of relevant themes. The four identified clusters offer different foci for possible future research in interaction design, landscape architecture, sociology, politics, and more.
5.3 Experiment 1 — Mobile soundscapes
The pilot experiment yielded two time-lapse videos of bicycle rides through Malmö. While listening through the audio files that I recorded in order to retrace the different vélomobile formations-in-action that I had been part of, I noticed a certain quality of the audio: just by listening, I could recall my ride in high detail — I knew where I had been simply by following along the playback, and the audio recalled detailed memories of the ride. Yet in the end I produced the two time-lapse videos without any sound, as the original audio track sped-up would have sounded ridiculous. The end product, then, missed a richness that the audio could have provided.
This experience led to the planning of Experiment 1. This design experiment captures the sound-scapes of a single route over the time of one day. It aims to explore the role of audio in representing a bicycling experience: which qualities of the ride experience can it capture and convey, and which does it miss?
5 Workshops and design experiments
5.3.1 Setup
As this experiment works with a single route over different points in time, I picked a route that was convenient for me to ride — one that I would ride frequently anyway. The way from my home in Rön-neholm to the student union building of Malmö University in Dockan served therefore as experiment route. It starts in a residential area, goes along a park and the city library, as well as along a busy road between a park and the old town, and ends in the industrial area of the harbour. It has a length of about 2.2 kilometers.
Prior to each ride, I mounted my phone on my handlebars using a rubber bike mount (see Figure5.3). I used a simple audio recording application (the same as in the pilot experiment) without a headset or external microphone to capture the soundscape.
Figure 5.3: Setup for mobile audio capture
5.3.2 Execution
With the phone mounted, I rode the route as I would normally do — depending on my mood, my current well-being, urgency, and traffic.
Forth Back
Ride # Time Duration Time Duration 1 09:49 06:13 11:06 06:41 2 13:20 06:47 16:25 06:32 3 16:31 07:47 17:39 06:54
4 17:29 06:49 19:54 07:03
5 23:15 07:03 23:22 07:03
5 Workshops and design experiments
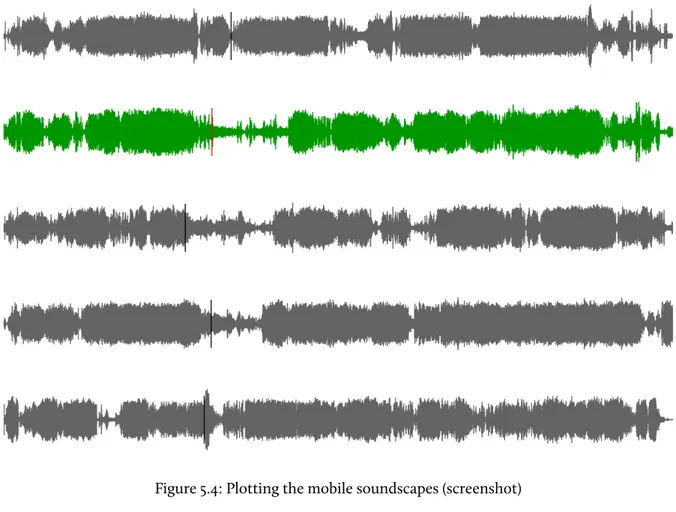
As can be seen, the ride durations do not differ much, except for the rides during rush hour. In the following, the different recordings are compared based on their wave form (amplitude) and the actual audio samples. In order to do so, I created a Processing¹sketch that allowed playback of the audio as well as its presentation as wave forms.
Figure 5.4: Plotting the mobile soundscapes (screenshot)
Figure5.4shows the five wave forms of the tracks recorded on the rides forth. They are plotted below each other, for easy visual comparison. By ‘stretching’ each track to a certain width, I make sure that the X axis represents the route, rather than the time. The currently playing track is highlighted in a green colour, and its playhead is red. The playheads are displayed at the same temporal position for each track; due to the different lengths of each track their playheads have different visual positions (on the X axis).
5.3.3 Results
The Processing sketch allows you to play and pause the audio, and jump between the different rides as they play. It can be found, along with the recorded sound files, on Github:https://github.com/t vooo/tp2-soundscape
5 Workshops and design experiments
Technical issues
Listening through the audio tracks, I noticed that the general signal-to-noise ration is quite low. Specif-ically, for most parts of the tracks, it is difficult to hear anything over the sound of wind. While Malmö is a city with heavy winds, this issue might still be reduced by using proper equipment or screening the microphone from wind. For now, however, it makes the interpretation of the audio more difficult due to the constant noise. This reaches so far that, whenever the wind stops, it has a seemingly soothing and relaxing effect on the listener.
Patterns
Comparing the wave forms allows for the identification of common patterns in the distinct journeys. During the rides 2, 3 and 4, beginning with the position of the active playhead in Figure5.4, one can see calmer periods which do not appear in rides 1 and 5. These periods constitute waiting at a traffic light, while in rides 1 and 5, I arrived at the traffic light during a green phase and could cross immediately.
Another common pattern is the long, nearly uninterrupted block of noise in the last third of the journey. This constitutes a long stretch next to a busy motorised road, and the noise comes from both wind and motor traffic.
Despite that, I found that the interesting parts are those that break out from the established patterns. The wave forms of rides 2 and 5, which happened during noon and night, respectively, are much more varying than the other ones — especially in the last third, while riding next to the road. While it is similarly windy in all the tracks, during rides 2 and 5 there was a lot less motorized traffic on the road. This makes sense, given the respective times of day, but it is made very explicit in these soundscapes.
Interactional qualities
What is the measure for “interaction” in these soundscapes? While the pilot experiment focused on the number of people around oneself, this experiment has focused on sound, and can therefore work with the types of sounds being heard or with distinct qualities, such as volume.
Volume has only a very indirect relation to interaction; when we interact, we do not necessarily make a noise. This happens more frequently in direct, vocal interaction. But sometimes, noise arises alongside our interaction, for example the sound of brakes or a bell. On the other hand, volume is associated with behavioural imperatives, for example the silence in a library or the chatty noises in a café. While bicycling, though, loud noise generally indicates busyness, be it due to traffic or construction sites. The fact that I met fewer cyclists when riding at night is reflected well in the audio — but so is the lack of motorised traffic. This allows for the perception of the natural environment in more clarity. It also becomes clear that many events during a bicycle ride take place next to the road, not in its middle. During the ride cyclists are often very focused on the road, and videography supports this “tunnel vision”. Audio, on the other hand, shifts the focus to the periphery of our perception.
5 Workshops and design experiments
5.3.4 Reflection
The qualities of auditive representations offer interesting potential both for the bicycling researcher and her subject. This potential, however, is not in identifying specific interactions. Instead, it allows to capture the mood, or the character, of a single ride. Besides that, one can find patterns regarding the periphery of the ride — surroundings, environment, urban landscape, traffic behaviour.
For a cyclist, an auditive representation can be a way to re-live the experience of her ride; it can also be a way to share the experience of her ride with others. Possible further design experiments could make use of the audio to accompany a narrative, for example of a bicycle race or tour.
As researcher, I could be interested in the influence of different sound characters and parameters on the bicyclist. Do certain sounds, such as motorised traffic, cause distress — and if so, which alterna-tive routes offer a better soundscape? Can the soundscape be linked to socioeconomic factors of an area? What role does sound play in repairing interactional hitches? And, connecting a soundscape with geolocation data (see next section), how do certain places on the route compare over time?
It is worth looking at the audio separately from any video material. Both can be captured at the same time, using a single capturing device; but reviewing both at the same time makes it hard to focus on the audio, as vision is our predominant sense.
Finally, the temporal dimension — comparing the same route over the course of time — might shed light on why cyclists ride at certain times rather than at others.
Auditive research has seldom been used constructively in bicycling research, yet audio has experi-ential qualities that make bicycle rides meaningful, enjoyable, and unique. This experiment was barely touching the potential of this design space, and I expect much more to come in this respect in the future.
5.4 Experiment 2 — Mapping spaces for interaction
This experiment builds on the premise that there are certain conditions that foster social interaction on the bicycle. It tries to find geographical spaces within the city where these conditions exist; thus, it identifies places where interaction is most likely to take place — interactional “hot spots”.
Cromwell (2013) makes several assertions about cycle-based interaction, three of which are: 1. Proximity of bicyclists is crucial for interaction to take place
2. A lower speed differential between two bicyclists means that they will remain in proximity for a longer time
3. Places of pause provide the best opportunities for interaction, as bicyclists have no speed differ-ential
Consequently, to identify areas that offer good conditions for meaningful social interaction to take place, one can look towards areas where cyclists are slow. At the same time, a certain amount of rides must be taken through said area, in order for it to offer any social interactions at all.
5 Workshops and design experiments
5.4.1 Execution
This experiment relies on existing location data of bicycle journeys throughout Malmö and its surround-ings. The ride data were provided by courtesy of The Bike Data Project¹, which collects bicycle ride data in order to convince local governments of the importance of more bicycle-friendly cities and facilities. The data were provided in a GeoJSON²file and are constituted of approximately 2600 distinct rides. For each ride, the GeoJSON file contains the geographic coordinates (latitude and longitude, also called geolocation) of individual points within the ride.
To plot the rides onto a map, I decided to create one JavaScript program for filtering the rides for rele-vant data, and a second JavaScript program that uses the Leaflet³library to display the rides and analysed interactional hot spots in a web browser. JavaScript’s functional programming paradigm allows for easy filtering of the masses of data points, while Leaflet provides tools to easily display and manipulate maps and GeoJSON data.
The source code for the programs can be found on Github:https://github.com/tvooo/tp2-m ap. The resulting map, with settings described as below, can be found at:http://tvooo.github.io/ tp2-map/.
Identifying areas of frequent bicycle traffic
In order to identify areas, the map (central Malmö) is divided into a grid of arbitrary size (see Figure5.5). For every field of this grid, an equivalent to the following procedure is executed:
1. Retrieve the number of rides that cross this field
2. If the number is above a certain threshold, mark this field and the rides within it
Identifying areas of low speed
The current speed or pace is, unfortunately, not tracked by The Bike Data Project. Nevertheless, a gen-eral approximation of it (slower/faster) can be derived from the individual location coordinates of one ride. This algorithm makes use of the fact that it is common practise for route tracking applications, such as Bikes vs Cars, Map My Ride, Strava or Runkeeper, to record the geolocation in certain time in-tervals (e.g. every second or every two seconds). Therefore, if the geolocation points of one ride, in a certain area, are closer together, one can assume that the cyclist was riding slower; on the other hand, if the points are further apart, one can conclude that the cyclist was riding faster.
The following procedure assumes the grid from the previous step and is applied to each of the marked fields:
¹ Seehttp://www.bikedataproject.org/
² GeoJSON is a file format for encoding collections of simple geographical features, seehttps://en.wikipedia.org/w iki/GeoJSON
³ Leaflet is an open source JavaScript library used for building interactive mapping applications, seehttp://leafletj s.com/
5 Workshops and design experiments
Figure 5.5: Grid overlaying a map of Malmö
1. For each marked ride, check how many of its data points (geolocation data) are located within the field
2. Get the average number of data points per ride in this field 3. If the average is above a certain threshold, mark the field
Visualizing
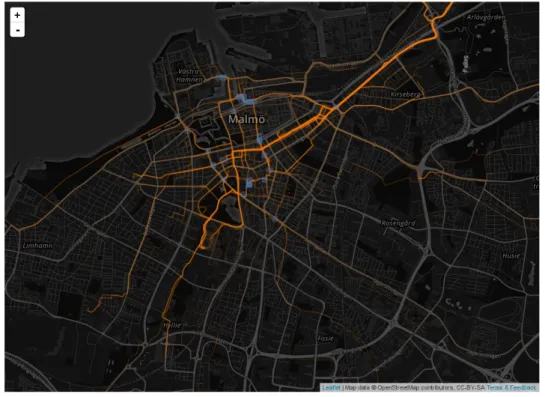
After the programmatical analysis of the ride data, the results can be visualized on a map. The rides are drawn in a bright orange, but nearly transparent, colour. This way, it is easy for the eye the comprehend if there are more or less rides at one spot, as the lines get more opaque if they overlay each other. The areas which contain interactional hot spots are drawn using blue rectangles. The degree of opacity indicates the average density of geolocation points within it; the slower the average pace of bicyclists is in an area, the more opaque is the blue rectangle.
5.4.2 Results
As was to be expected, many of the spots identified are obvious points of frequent, slow traffic: stop lights, crossings, bike parking. But of much more interest are spots where there is no obvious reason, on first sight, for people to cycle slowly. Two of the identified spots are analysed in this section.
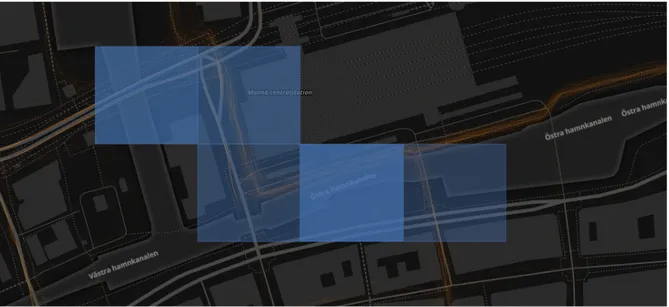
Figure5.7shows details of Malmö central station along with its bus hub. The highlighted areas from left to right, top row first:
• The first area contains a bike path leading towards a traffic light (but not the traffic light itself). It also contains bike parking spaces, a bridge, and a way to enter the train station underground.
• The second area is a crossing with several bike paths. It also contains the longest streak of a bike path going in front of the main entry of Malmö central station, which is passed quite often by pedestrians. Presumably, cyclists are careful in this spot.
5 Workshops and design experiments
Figure 5.6: Relevant routes and interactional hot spots
• The third area contains some dangerous spots: the entry and exit of buses into the bus hub. Cy-clists who come from the north and continue on the bike path have to take a left turn, where they often encounter pedestrians trying to cross the cycle path right at the corner.
• The fourth area is most interesting: there is no bike parking here, nor are there any traffic lights or crossings. But out of the five fields around central station, it is the one with the highest average “slow-ness” of cyclists — something that I would have expected of the previous area. This one, however, contains only a straight bike path, in between the bus lane and pavement. It could be that cyclists are slowed down because of pedestrians crossing the cycle path; it could also be that cyclists, after the rather stressful area before, enjoy the ease of the ride at this spot. This is a question this experiment cannot answer, but which moves this area in focus of further research.
• The last area contains a small crossing as well as a way towards the entrance to underground bike parking, but also a major road crossing with traffic lights.
Another interesting spot is Erik Dahlbergsgatan (Figure5.8). This spot is not spectacular at all — while there is a crossing, this area is part of a residential neighbourhood and does not have any heavy motorized traffic. It is at the same time part of the route of many bicycle commuters. There is no obvious reason for cyclists to ride slowly here. This spot therefore invites further research, for example using ethnographic methods.
5 Workshops and design experiments
Figure 5.7: Interactional hot spot: Malmö central station
5 Workshops and design experiments
5.4.3 Reflection
The results in this experiment depend on many factors: the quality, amount and relevance of data, the parametric choices the designer takes, and the actual research interest of the designer.
An important role plays the data source, because different data sources represent different types of cyclists. Applications like Strava, Endomondo or RunKeeper are mostly used for exercise, and would thus show predominantly the routes of exercise rides by physically active cyclists. The Bike Data Project, one can assume, holds mostly data from bicycling enthusiasts and activists: people who care about bicycling as a practice in their daily lives, and want to chance the conditions for bicycling in their city for the better. Both groups are not representable for everyday urban commute bicycling, and one has to keep that in mind while interpreting the outcomes.¹ 2600 rides in about two weeks average about 185 rides per day — barely a fraction of the number of rides taking place in Malmö each day. Consequently, it can be said that the data provided to me are not representable; however, this circumstance does not diminish the value of using data analysis as a research instrument.
The second factor to keep in mind is the designer’s power to make choices that influence the inter-pretation:
• Changing the grid size influences the geographical precision. The smaller each field (and thus, the smaller the area covered), the more detailed can we look at a certain piece of urban landscape. Very small fields, though, can lead to bad results, e.g. if the field is so small that only a few data points on each ride touch it.
• How many rides per field does the designer consider to be “many”? It very much depends on the amount of data and the chosen grid size, but also on the designer’s decision where to set the threshold.
• How many data points per ride and field does the designer consider to be “many”? A ride can cross a rectangular field at a corner, go straight through, or even take a loop inside. The derived “pace” is not comparable in this case — which means that the designer has to rely on an idealisation. As can be seen, these questions do not only concern the designer’s choice but also technical problems inherent in the algorithm. Arguably, there are better algorithms that would lead to more precise results. Yet making the map as precise as possible was not the goal of this experiment; rather, I wanted to show that, using existing route data, a designer can derive knowledge about how people cycle the city. It is an inherent property of maps (and other representations) that they are not a precise reflection of reality, but magnify some aspect over others (Suchman1995).
The last factor of importance is the designer’s research interest. While, in this experiment, I was interested in spaces for probable social interaction based on Cromwell’s presumptions, a designer can use these data along with visualisation to find many other spaces of interest. For example, one could identify spaces where cyclists often come to a sudden stop, which would indicate failed negotiation of ¹ A more representable data source would be movement profiles created e.g. by Google for Android phones; however, using
5 Workshops and design experiments
social rules between road users; one could design a real-time version of this map to help people avoid heavy traffic, or to help the “flâneur on wheels” to find spots and routes for people-watching.
Using quantitative data analysis in the context of bicycling research is not a new practice; quite the opposite, it has been a predominant way of enquiry in the past. However, as Spinney (2011) states, quan-titative analysis cannot capture and represent the fleeting moments of subtle interaction that make up much of the cycling experience. It has nevertheless still a place in researching cycle-based interaction: we can use it to inform further, possibly ethnographic or phenomenological, research, for example by identifying foci for analysis.
5.5 Experiment 3 — Interaction Analysis
‘Video records maintain the animation, dynamics of lived experience.’ — Video records freeze activity, while affording a (mis)illusion of experience. — Suchman (1995, p. 60)
These two contrasting statements came to being while Lucy Suchman was reading through a paper of her colleagues Francoise Brun-Cottan and Patricia Wall. By example, this juxtaposition illustrates the imperfections of videography as an ethnographic method. Suchman is well aware of these imper-fections, this lack of objectivity: “practice is lived experience, only partially representable” (1995, p. 60). She even embraces and utilises it as a quality of representations:
The goal is to develop our representational practices in ways that maintain the connections among representations, their authors, their interests, and other knowledge and images that might be relevant. — Suchman (1995, p. 63)
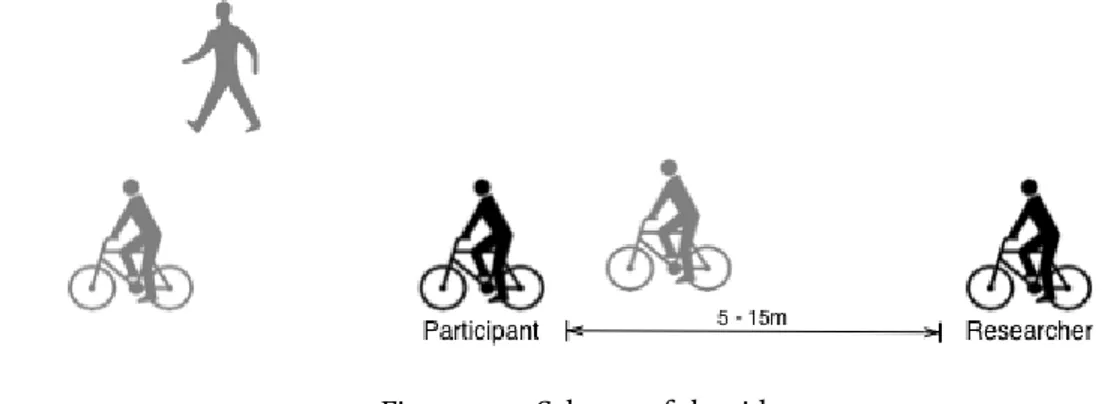
Following in Suchman’s footsteps, this experiment aims to explore a way of enquiry that is not just representational, but also reflective. The participant reflects on her own acting and interacting during a bicycle ride with the help of the design researcher — both during the ride using a voice call or audio recording, and after the ride with the help of videography.
The experiment took place in two iterations with two different participants, Laura and Luisa. The iterations are described individually and compared at the end of this chapter.
5.5.1 Iteration 1 — Talking about the ride
The first iteration of this experiment resembles the Interaction Analysis methodology described by Jor-dan and Henderson (1995). In addition to simply riding and re-viewing the ride later along with the researcher, the participant actively reflects upon the ride in situ. Similar to the method of ‘think aloud’, as it is common practice in HCI research (see Beyer and Holtzblatt1997), the participant is asked to say her thoughts out loud while bicycling. The audio is recorded using a microphone, and is part of the later review session.