Comparison of the university hospital
and county hospitals in western Sweden
to identify potential weak links in the
early chain of care for acute stroke:
results of an observational study
Birgitta Wireklint Sundström,1Johan Herlitz,1Per Olof Hansson,2Peter Brink3
To cite: Wireklint Sundström B, Herlitz J, Hansson PO,et al. Comparison of the university hospital and county hospitals in western Sweden to identify potential weak links in the early chain of care for acute stroke: results of an observational study.BMJ Open 2015;5:e008228. doi:10.1136/bmjopen-2015-008228
▸ Prepublication history for this paper is available online. To view these files please visit the journal online (http://dx.doi.org/10.1136/ bmjopen-2015-008228). Received 18 March 2015 Revised 25 June 2015 Accepted 29 July 2015
For numbered affiliations see end of article.
Correspondence to
Professor Birgitta Wireklint Sundström;
birgitta.wireklint.sundstrom@ hb.se
ABSTRACT
Objective:To identify weak links in the early chain of care for acute stroke.
Setting:9 emergency hospitals in western Sweden, each with a stroke unit, and the emergency medical services (EMS).
Participants:All patients hospitalised with a first and a final diagnosis of stroke−between 15 December 2010 and 15 April 2011. The university hospital in the city of Gothenburg was compared with 6 county hospitals.
Primary and secondary measures:(1) The system delay, that is, median delay time from call to the EMS until diagnosis was designated as the primary end point. Secondary end points were: (2) the system delay time from call to the EMS until arrival in a hospital ward, (3) the use of the EMS, (4) priority at the dispatch centre and (5) suspicion of stroke by the EMS nurse.
Results:In all, 1376 acute patients with stroke (median age 79 years; 49% women) were included. The median system delay from call to the EMS until (1) diagnosis (CT scan) and (2) arrival in a hospital ward was 3 h and 52 min and 4 h and 22 min, respectively. The system delay (1) was significantly shorter in county hospitals. (3) The study showed that 76% used the EMS (Gothenburg 71%; the county 79%;
p<0.0001). (4) Priority 1 was given at the dispatch centre in 54% of cases. (5) Stroke was suspected in 65% of cases. A prenotification was sent in 32% (Gothenburg 52%; the county 20%; p<0.0001).
Conclusions:System delay is still long and only a small fraction of patients received thrombolysis. Three of four used the EMS (more frequent in the county). They were given the highest priority at the dispatch centre in half of the cases. Stroke was suspected in two-thirds of the cases, but a prenotification was seldom sent to the hospital.
INTRODUCTION
Stroke is the common name for cerebral infarctions, intracerebral haemorrhages and
subarachnoid haemorrhages. Approximately 17 million patients suffer from stroke each year in the whole world, and stroke causes almost 6 million deaths.1 2 In addition, a large number of the survivors are left with mental and physical impairment and require assistance with the activities of daily living. Thus, stroke constitutes an enormous burden for the individuals affected and for society.1 2 A variety of symptoms are described in stroke. The most known are the sudden onset with hemiparesis, hemihy-pesthesia, loss of vision, speech disturbances, loss of consciousness, nausea and compro-mised balance.3 Sometimes, the symptoms
Strengths and limitations of this study
▪ The major strength of this study is that all patients with stroke were included in the ana-lyses, regardless of whether or not patients were admitted to a stroke unit.
▪ The complete period of time from symptom onset until diagnosis, arrival in a hospital ward and treatment with thrombolysis or thrombecto-mia was studied. This makes the study sample more representative and unique than those most often found in the literature.
▪ Patients treated in university hospitals were com-pared with those in county hospitals.
▪ The limitations are partly due to the observa-tional retrospective design, which might have led to selection bias. We are therefore not able to draw any certain conclusions about cause and effect.
▪ A major limitation was that data were missing for many of the variables mainly due to poor docu-mentation in the emergency medical services and medical records. Furthermore, a majority of the patients did not know the exact time of the onset of symptoms and could not therefore be included in the analyses.
are more atypical and the onset of symptoms might be more gradual.4 The duration and degree of ischaemia determine the extent of damage.5 6In the assessment of stroke, medical staffs have to rely on the patient’s medical history, risk factors and clinical examination. Stroke is an acute condition that requires immediate treatment and the advent of thrombolytic therapy in acute stroke has resulted in improved prognosis.7 Improved outcome has also been reported for patients with stroke treated in stroke units, focusing on rehabilita-tion, early mobilisarehabilita-tion, acute general care such as control of blood glucose and blood pressure.8 9 However, the number of patients eligible for thromboly-sis is unsatisfyingly low, to a large extent due to the fact that patients arrive in hospital late after onset of symp-toms.10The delay until start of treatment can be divided into two major components: prehospital and in-hospital delay. The prehospital delay constitutes the largest pro-portion of delay time and is a major challenge,11 where the patient’s decision time accounts for the largest part.8 Prehospital time encompasses symptom onset to hospital arrival.
Prehospital delay can be reduced by decreasing the patient decision time, increasing the utilisation of the emergency medical services (EMS) system, improving the early identification of stroke symptoms and finally increasing the utilisation of clinical trials. Prehospital clinical trials have been developed for patients in whom the EMS nurse suspects stroke, in order to gain fast access to thrombolysis and care at stroke units. The stroke triage pathway has been started to shorten door-to-needle time12 13and to shorten dramatically the time from call to the EMS until arrival at a stroke unit.14 Studies have also shown that prenotification by person-nel in the EMS is associated with shorter door-to-needle time15 16 and the increase of the use of thrombolysis in stroke.9
The fact that all potential candidates for thrombolytic therapy must undergo a CT scan before treatment con-tributes to in-hospital delay. Availability and efficiency of in-hospital CT scanning is therefore crucial.9 However, for patients arriving early in hospital, inappropriate delay may occur prior to being seen by a physician and performing a CT scan; inefficient in-hospital manage-ment might preclude candidates for thrombolysis.17 By increased knowledge about what causes delay in acute management of stroke and by evaluation of weak links, the number of patients eligible for thrombolytic treat-ment can be increased. Several studies have demon-strated delays in stroke care,3 4 9 11 18 19 but only a few have attempted to study the complete period of time including both prehospital and in-hospital delay.9 Prehospital delay has been shown to be strongly corre-lated to in-hospital delay.20 This study focuses on system delay, that is, delay time from call to the EMS until diag-nosis (CT scan) and arrival in a hospital ward.
The aim of this study is to identify weak links in the early chain of care in acute stroke care. Primary and
secondary measures: (1) the system delay, time from call to the EMS until diagnosis (CT scan), was designed as a primary end point. Secondary end points were: (2) the system delay time from call to the EMS until arrival in a hospital ward, (3) the use of the EMS, (4) priority at the dispatch centre and (5) suspicion of stroke by the EMS nurse. Patients treated in a university hospital were com-pared with those in six county hospitals.
METHODS
Study design and setting
The study has an observational retrospective design and was carried out in Region Västra Götaland in western Sweden. The region has approximately 1.6 million inha-bitants and nine emergency hospitals with a stroke unit at each hospital. In the region, there are 84 ambulances, all staffed with one EMS nurse day and night all days of the week.
The participating hospitals were the Sahlgrenska University Hospital in the city of Gothenburg (which consists of three separate hospital units: Sahlgrenska, Östra and Mölndal, each with an emergency ward and a stroke unit), Södra Älvsborg Hospital (Borås), Norra Älvsborg Hospital (Trollhättan), Skaraborg Hospital (which consists of two separate hospital units: Skövde and Lidköping), Alingsås Hospital and Kungälv hospital. All the hospitals are linked to the EMS. This implies that the EMS nurse initiates direct contact with a stroke coordinator at the stroke unit. This system makes it pos-sible for many patients to be transported either directly to a stroke unit or directly to a CT scan, thus bypassing the emergency department (ED). The study was con-ducted from 15 December 2010 to 15 April 2011.
Inclusion and exclusion criteria
Patients were included in the study if they were admitted to a hospital ward in Region Västra Götaland, and where the final diagnosis was stroke. The diagnoses included were: intracerebral haemorrhage, unspecific brain haem-orrhage, cerebral infarction and stroke not classified as infarction or haemorrhage (International Classification of Diseases 10th Revision; ICD-10: I61.0-I64.9, with the exception of I62.0 and I62.1).
The exclusion criteria were patients with a final diag-nosis of stroke in whom symptom onset took place after admission to hospital. Patients with subarachnoid haem-orrhage (ICD-10: I60.0-I60.9) and extracranial haemor-rhage (ICD-10: I62.0-I62.1) were not included in the analyses.
Data collection
Data were gathered from hospital and EMS records including the hospital diagnosis register. The data were divided into four phases: (1) symptom onset, (2) the dis-patch centre, (3) the EMS transport or other transport if not the EMS and (4)first assessment at hospital.
The EMS is using the Rapid Emergency Triage and Treatment System (RETTS).21 With the support of the RETTS, each patient is given an emergency symptoms and signs (ESS) number, based on symptoms and vital parameters (objective signs), and is assigned a triage colour that serves to indicate the priority.
Statistical analyses
All data were registered in a database designed for this project. All analyses were performed using the SAS soft-ware. Descriptive data are presented mainly as crude percentages. When comparing the university hospital with county hospitals, any eventual differences in pro-portions were evaluated with Fisher’s exact test for dichotomous variables, and continuous variables were evaluated with the Wilcoxon two-samples test. All tests were two tailed. Owing to the large number of p values calculated, a p value of <0.01 was regarded as statistically significant.
Ethical approval
Written informed consent was obtained from all patients prior to any data collection.
RESULTS
Baseline characteristics
The total number of patients registered during the 4-month period was 1376 of whom 534 (39%) were brought to units of the University Hospital in Gothenburg (able 1). Of all cases, 165 (12%) had a final diagnosis of intracerebral haemorrhage (ICD-10:
I61.1-I61.9), seven cases (0.5%) had afinal diagnosis of unspecified haemorrhage (ICD-10: I62.9), 200 cases (14.5%) had a final diagnosis of embolic infarction (ICD-10: I63.2 or I63.4), 359 (26.1%) cases had a final diagnosis of non-embolic infarction (ICD-10: I63.0, I63.1, I63.3, I63.5-I63.8), 605 cases (44%) had a final diagnosis of unspecified infarction (ICD-10: I63.9) and 40 cases (2.9%) had a final diagnosis of unspecified stroke (ICD-10: I64.9) (not shown in the table).
The most frequent previous diseases were a history of hypertension, stroke and atrial fibrillation (table 1). There were no significant differences between patients treated at the university hospital compared with those in county hospitals. Results were further divided into three groups: all included patients, patients at the university hospital and patients at county hospitals in the region.
Time to CT, hospital ward and treatment
The median system delay from call to the EMS until diagnosis (CT scan) and arrival in a hospital ward was 3 h and 52 min and 4 h 22 min, respectively (not shown in the table). System delay, from calling the EMS until diagnosis (CT scan), was significantly shorter in county hospitals (table 2). However, system delay from calling for EMS until arrival in a hospital ward tended to be shorter in university hospitals. When individual hospitals were evaluated, we found that in the university hospital the median delay from call for EMS until CT was per-formed varied from 4 h and 14 min to 7 h and 14 min in the three units. In the six county hospitals, the median delay varied from 2 h and 28 min to 7 h and 31 min.
Table 1 Baseline characteristics of patients on admission to hospital
All patients University hospital County hospitals
n=1376 n=534 n=842 p Value*
Age (0)† (years; mean, median) 76, 79 76, 78 77, 79 0.27
Sex % (0) Women 49 50 51 0.82 Patients history (%) Diabetes (0,1) 19 18 20 0.48 Hypertension (0,2) 51 52 50 0.70 Atrial fibrillation (0,3) 24 24 24 0.95 Heart failure (0,3) 10 11 10 0.27 Myocardial infarction (0,4) 16 15 17 0.26 Angina pectoris (0,4) 7 6 7 0.38 Amaurosis fugax (0,2) 0.9 0.9 0.9 1.00
Transitory ischaemic attack (0,2) 8 8 8 0.68
Stroke (0,1) 26 27 26 0.57
Claudicatio intermittens (0,2) 2 2 2 0.86
Sleep apnoea syndrome (0,4) 2 2 1 0.52
Malignancy (0,4) 14 16 12 0.054
Living alone (%) (3)
Yes 50 49 49 0.50
Need for interpreter (%) (0,1)
Yes 3 5 3 0.046
*p Value refers to a comparison between university and county hospitals.
The shortest delay was seen in the smallest of all nine hospitals (Alingsås; 100 beds). The number of beds in each hospital varied between 100 and 800.
The overall median times from arrival in the hospital until CT scan and arrival in a hospital ward were 3 h 0 min and 3 h 11 min, respectively. The in-hospital delay, from arrival in the hospital until a CT scan, was shorter in county hospitals. The median time from arrival in hospital until thrombolysis or thrombectomia was 45 min, with no differences between groups.
Of all the patients, 70% were directly referred to a stroke unit and 11% were never admitted to a stroke
unit (table 3). This was more frequent in university hos-pitals. Only 7% of all patients were treated with either thrombolytic agents or underwent thrombectomy or carotid endarterectomy.
Circumstances at onset of symptoms
Of all the patients, 76% used the EMS (more frequent in county hospitals; table 4). One of four patients woke up with their symptoms (more frequent in the university hospital). The proportion of patients who arrived in hos-pital within 4 h after onset of symptoms was 67%, but
Table 2 Time to CT, hospital, ward and treatment
University hospital County hospital
n=534 n=842 p Value*
Radiological evaluation (CT)
From call to EMS (N=227, N=508)† 0.006
Range 29 min−6 days 7 h 2 min 32 min−6 days 22 h 5 min
Median, IQ range 4 h 55 min; 2 h 31 min−9 h 8 min 3 h 27 min; 1 h 59 min−7 h 7 min
From arrival in hospital (N=483, N=625) 0.005
Range 1 min−6 days 6 h 15 min 3 min−6 days 20 h 10 min
Median, IQ range 3 h 35 min; 1 h 42 min−6 h 42 min 2 h 38 min; 1 h 11 min−6 h 22 min Arrival in ward
From call to EMS (N=211, N=629) 0.011
Range 3 min−21 h 8 min 35 min−17 h 38 min
Median, IQ range 3 h 49 min; 2 h 4 min−6 h 13 min 4 h 26 min; 3 h 2 min−6 h 33 min
From arrival in hospital (N=486, N=801) 0.0007
Range 0 min−23 h 45 min 0 min−22 h 52 min
Median, IQ range 2 h 46 min; 1 h 12 min−4 h 57 min 3 h 22 min; 1 h 40 min−5 h 31 min Thrombolysis or thrombectomia
From call to EMS (N=19, N=29) 0.64
Range 52 min−15 h 58 min 61 min−3 h 36 min
Median, IQ range 1 h 40 min; 1 h 4 min−2 h 49 min 1 h 43 min; 1 h 30 min−2 h 7 min
From arrival in hospital (N=25, N=30) 0.53
Range 0 min−2 h 36 min 11 min−2 h 47 min
Median, IQ range 45 min; 19 min−1 h 17 min 44 min; 34 min−1 h 13 min
For the variable‘time to arrival in ward’, 24 patients were excluded due to delay times of more than 24 h. *p Value refers to a comparison between university and county hospitals.
†Number of patients with information in university and county hospitals. EMS, emergency medical services.
Table 3 Type of medical ward, radiological evaluation and revascularisation
All patients University hospital County hospitals
n=1376 n=534 n=842 p Value*
Type of medical ward (0,1)† %
Stroke unit directly 70 77 65 <0.0001
Initially other ward but later referred to a stroke unit 19 16 22 0.014
Other ward 11 6 13 <0.0001 Radiological evaluation (0,2) % CT 99 99 99 1.00 MR 11 14 10 0.014 Revascularisation Thrombolysis (13 0,1) 5 5 4 0.33 Thrombectomy (14 0,1) 0.7 0.8 0.6 0.73 Carotid endarterectomy (14 0,5) 1 1 1 0.78
*p Value refers to a comparison between university and county hospitals.
information was only available in a minority of patients (not shown in the table).
Prehospital assessment by the dispatch centre and EMS nurse
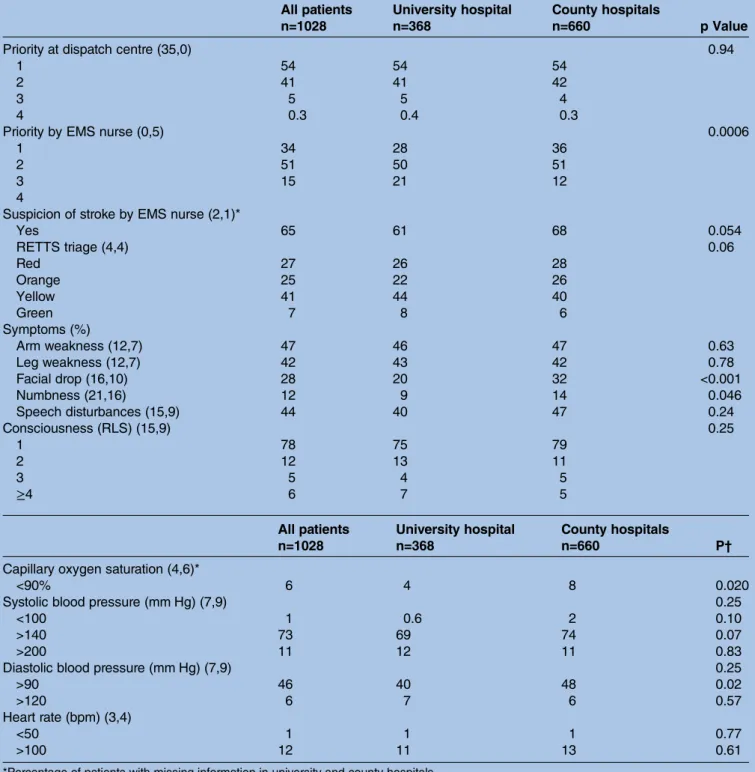
Only 54% of patients were given the highest priority by the dispatch centre (table 5). Thisfigure was reduced to 34% when the patients were assessed by the EMS nurse (higher priority in county hospitals). However, the EMS nurse suspected a stroke in 65% of cases. Assessment by the EMS nurse showed that the most common symptoms were paralysis and speech disturbances (facial droop was more common in the county hospital group). The degree of consciousness was Reaction Level Scale 122 in 78%. Almost all patients had oxygen saturation over 90%. The diastolic blood pressure was over 90 mm Hg in 46% and 12% had a heart rate above 100 bpm.
Prenotifications by EMS nurses to the hospital were made in 32% of patients using EMS transport; that is, the nurse contacted a stroke coordinator/neurologist (52% in the university hospital vs 20% in county hospi-tals; p<0.0001).
First assessment at hospital
Thefirst physician who examined the patient at the hos-pital (in the ED or ward) suspected a stroke in 82% of cases (more frequent in university hospitals). Stroke signs and warning symptoms such as hemiparesis, hemi-hypesthesia and syncope were more frequent in univer-sity hospitals. Elevation of diastolic blood pressure was more frequent in county hospitals (table 6).
DISCUSSION
This study shows that the need exists to improve the early chain of care for patients with stroke in western Sweden in order to decrease the system delay time until diagnosis (CT scan). The delay times are shown to be very high (almost 4 h, on average). This result is
nevertheless in agreement with a previous study from the same area where the median time from emergency call to the ward was almost 5 h.12
Although some patients are rapidly transported to the appropriate level of care, the early chain of care in subsets of patients with stroke probably needs to be improved. A system where stroke diagnoses are set by the EMS nurse and the patient is transported directly to the CT scan and thereafter directly to the stroke unit instead of the ED may shorten this delay. Bypassing the ED can decrease the delay time to treatment for the patient and reduce the number of patients admitted to the ED. This stroke triage pathway was unfortunately not fully utilised in the participating EMS systems and was not fully developed in all participating hospitals at the time of the present study.
That as many as 76% of the patients with stroke in this study used EMS transport is a higher proportion than was previously reported. Studies from France and the USA showed that the percentage of patients with stroke transported by the EMS was lower, only about 35– 65%.18 23 24 Still, in this study, one of four patients with stroke did not use the EMS. Since studies have shown that EMS transport is related to a shorter time to hos-pital admission and shorter in-hoshos-pital delay prior to the right treatment,19 25–28 it is not acceptable that one-fourth should receive delayed treatment. Thus, in terms of EMS transport in cases of stroke, there is still room for improvement. The cause might be unspecific symp-toms with a gradual onset, not motivating the patient to call the emergency dispatch centre. Studies have shown that factors such as a gradual onset of symptoms, no motor dysfunction, unspecific and mild symptoms are less often recognised as representing stroke.19 Non-recognition of the warning signs of stroke increases the delay time before calling the dispatch centre and seeking medical care.27 29 Only 39% of the patients in this study were certain about the time for symptom onset.
Table 4 Circumstances at onset of symptoms
All patients University hospital County hospitals
n=1376 n=534 n=842 p Value*
Wake up with symptoms (%) (35,32)†
Yes 25 31 21 0.002
Place of symptom onset (%) (8,11)
Indoors 96 96 96 1.00 If indoors (%) (0,5) At home 94 93 95 0.10 Mode of transport (%) (1,0,4) EMS system Yes 76 71 79 <0.0001
If yes, detour via primary care (0,4)
Yes 7 6 7 0.51
*p Value refers to a comparison between university and county hospitals.
†Percentage of patients with missing information in university and county hospitals. EMS, emergency medical services.
To increase the awareness of stroke signs and warning signals, educational campaigns are needed. In the USA, a study in Missoula showed that a high-intensity public education campaign can increase community awareness of the warning signs for stroke and the need to call the dispatch centre.30In Texas, a similar campaign increased the number of patients with stroke treated with thromb-olysis.31 Another study in Korea showed that stroke awareness on the part of patients, as well as of
bystanders, had a great impact on arrival time at hos-pital.32 A national campaign to increase awareness of stroke symptoms was started in Sweden in 2011, after this study was carried out. This campaign may have reduced prehospital delay and increased the number of patients transported to hospital by the EMS.
The next weak link is the priority given at the dispatch centre, which in this study showed that only 54% were given priority 1. In a subset of patients where
Table 5 Prehospital assessment (%) by dispatch centre and EMS nurse
All patients University hospital County hospitals
n=1028 n=368 n=660 p Value
Priority at dispatch centre (35,0) 0.94
1 54 54 54
2 41 41 42
3 5 5 4
4 0.3 0.4 0.3
Priority by EMS nurse (0,5) 0.0006
1 34 28 36
2 51 50 51
3 15 21 12
4
Suspicion of stroke by EMS nurse (2,1)*
Yes 65 61 68 0.054 RETTS triage (4,4) 0.06 Red 27 26 28 Orange 25 22 26 Yellow 41 44 40 Green 7 8 6 Symptoms (%) Arm weakness (12,7) 47 46 47 0.63 Leg weakness (12,7) 42 43 42 0.78 Facial drop (16,10) 28 20 32 <0.001 Numbness (21,16) 12 9 14 0.046 Speech disturbances (15,9) 44 40 47 0.24 Consciousness (RLS) (15,9) 0.25 1 78 75 79 2 12 13 11 3 5 4 5 ≥4 6 7 5
All patients University hospital County hospitals
P†
n=1028 n=368 n=660
Capillary oxygen saturation (4,6)*
<90% 6 4 8 0.020
Systolic blood pressure (mm Hg) (7,9) 0.25
<100 1 0.6 2 0.10
>140 73 69 74 0.07
>200 11 12 11 0.83
Diastolic blood pressure (mm Hg) (7,9) 0.25
>90 46 40 48 0.02
>120 6 7 6 0.57
Heart rate (bpm) (3,4)
<50 1 1 1 0.77
>100 12 11 13 0.61
*Percentage of patients with missing information in university and county hospitals. †p Value refers to a comparison between university and county hospitals. RLS, reaction level scale.
information was available, we found that 67% of patients arrived in hospital within 4 h of symptom onset. Previous studies from other countries have shown longer delay times.25 33Of all the patients with stroke including 12% with a cerebral haemorrhage, only 7% were poten-tially revascularised with medication or surgery. Previous studies have found that the major reason for the low rate of early thrombolysis is the late admission to hos-pital.25 34The time frame for thrombolysis is set at 4.5 h, which means that the patient needs to get to the hos-pital at least within 4 h after symptom onset. A rando-mised study has reported that a higher prioritisation of stroke at the dispatch centre increases the use of
thrombolysis and reduces the time to the stroke unit.35 The findings of this study therefore underline the fact that the management of acute stroke can and must be improved at the dispatch centre, through being given the highest priority and through stroke protocols with high compliance.36
The EMS nurse suspected a stroke in 65% of all cases compared to 82% for the first examining physician at the hospital. There is a difference of 17% between the EMS nurses and the physicians’ ability to detect stroke on the scene. A pilot study from Sweden, where the EMS nurses had special training to diagnose stroke symptoms, showed that a prehospital diagnosis of stroke
Table 6 First assessment at hospital
All patients University hospital County hospitals
n=1376 n=534 n=842 p Value* Suspicion of stroke (0,6,1)† Yes 82 87 80 0.001 Consciousness (according to RLS) (8,5) 0.47 1 78 77 78 2 10 8 11 3 4 3 4 ≥4 5 6 5 Uncertain 3 6 2 Symptoms (%) Hemiparesis/plegia (8,4) 55 58 50 0.006 Facial droop (10,5) 33 36 31 0.09 Numbness, hemihypesthesia (4,11) 21 25 16 <0.0001 Double vision (17,12) 3 2 4 0.11 Aphasia/dysphasia (11,7) 40 39 41 0.68 Headache (15,14) 15 16 14 0.35 Vertigo (15,15) 23 25 20 0.08 Syncope (13,14) 4 6 2 <0.0001 Compromised balance (17,14) 21 22 20 0.26 Dysphagia (20,17) 5 5 6 0.79 Oxygen saturation (5,22) <90 4 3 5 0.06
All patients University hospital County hospitals
n=1376 n=534 n=842 p Value Blood pressure (mm Hg) Systolic (1,12) <100 5 5 5 0.69 >140 74 71 77 0.02 >200 3 3 4 0.42 Diastolic (3,12) >90 40 33 44 <0.0001 >120 4 3 4 0.46 Heart rate (bpm) (3,15) <50 2 2 2 1.00 >100 9 9 9 0.92 Heart rhythm (7,18) Sinus rhythm 74 74 74 0.89 Atrial fibrillation 22 21 22 0.48 Other rhythm 4 5 4 0.73
*p Value refers to a comparison between university and county hospitals. †Proportion of patients with missing information in university and county hospitals. RLS, reaction level scale.
led to a relatively high diagnostic accuracy of stroke.12 It also resulted in decreased delay to treatment at a stroke unit, also shown in other studies.12–14 Improved prehos-pital triage is also shown with a specialised stroke ambu-lance staffed with a specialised stroke team.37 As new treatments for acute stroke are discovered, the EMS and prehospital personnel are assuming increasingly import-ant roles in the assessment and treatment of acute ischaemic stroke.38 However, they must be appropriately trained and working within a established and well-coordinated healthcare system for stroke management.39 A study from the USA investigated how to increase more inexperienced physicians’ ability to diagnose patients with stroke. They found that increased knowledge about key features that distinguish stroke from other facial symptoms made the physicians better at identifying stroke diagnoses.17 Earlier studies suggest offering indivi-dualised feedback on each separate case to all health-care professionals on a monthly or quarterly basis,40as a method of keeping them up to date concerning the results of their care input.41 The overall aim is to opti-mise stroke care and management and to improve implementation times and outcomes.
The EMS nurse sent a prenotification to the hospital by contacting a physician or a stroke coordinator in only 32% of the cases. Of these patients, some were referred to the ED and not to a stroke unit. This means that they only used the stroke pathway for about half of all the patients in whom they suspected a stroke. Thus, 11% of the patients were not treated at a stroke unit. It is well known that stroke units are the most efficient and evidence-based wards for managing patients with stroke.8 15 42 Therefore, it is not reasonable that 1 of 10 patients with stroke does not reach a stroke unit at all during their hospital stay. Further investigation is needed to discover the reasons for this. These results are significant since one of the major aims of this study was to identify the weak links. According to these results, there is need for improvement in using the EMS nurses’ opportunity to contact a stroke coordinator/neurologist each time a stroke is suspected.
The medical history of patients with stroke indicated, as one might suspect, a group of patients with athero-sclerotic disease. About half of the patients had a history of hypertension prior to the event. It is possible that this figure might be even larger if the cases discovered during hospital treatment for stroke were included, since many patients probably had undiscovered hyper-tension. The social circumstances showed that most patients had symptom onset in their home. This may be related to the time period of the study, being during the winter months. According to this study, almost half of the patients lived alone, which is an important finding since previous studies have shown that living alone is associated with longer delay time to treatment.19 One study from Australia found that only 3% of all patients called the emergency dispatch centre themselves; the rest were dependent on a relative or friend.43
Comparison between the university hospital and county hospitals
An interesting observation was that system delay, that is, time from calling the EMS until diagnosis (CT scan), was significantly shorter in county hospitals. However, system delay to arrival in a hospital ward tended to be shorter in the university hospital. Nevertheless, the median time from arrival in hospital until thrombolysis or thrombectomia showed no differences between groups. The most important difference between the two groups was that the use of the EMS was more frequent in county hospitals, probably a beneficial factor. However, the university hospital group showed a greater frequency of suspicion of stroke by the ED physicians.
The shorter delay to arrival in a hospital ward in the university hospital may be explained by a higher rate of prenotification by the EMS nurse resulting in more direct admissions to a hospital ward.
Further improvements of the acute care of stroke
There are a number of possibilities to shorten the system delay in the EMS system. With the use of tele-medicine, a physician at a distant hospital might assess the patient via videophone and thereby improve the early diagnostic procedure.44 45 The use of brain imaging prior to hospital admission has already been started in Germany with a specialised ambulance vehicle46and in Norway with air ambulances.47The time from onset of symptoms to thrombolytic treatment can be reduced to <90 min with the aid of an ambulance equipped with a CT scanner.48 Finally, a microwave system in order to eliminate cerebral bleeding has shown promising results in the hospital setting49and will soon be evaluated also in the prehospital setting in Sweden.
There is most likely a huge variability in terms of system delay in the early handling of stroke when seen in a global perspective. We know that in some regions CT is performed in the ED,50 whereas in some develop-ing countries this type of investigation is not even available.
Strengths and limitations of the study
The major strength in this study is that all patients with stroke were included in the analyses, regardless of whether or not patients were admitted to a stroke unit. Furthermore, there are few previous studies that have studied the complete period of time from symptom onset until diagnosis. This makes the study sample more representative and unique than those most often found in the literature. That patients treated in university hos-pitals were compared with those in county hoshos-pitals should also be considered as a strength of the study.
The limitations are partly due to the observational retrospective design, which might have led to selection bias. We are therefore not able to draw any certain con-clusions about cause and effect. A major limitation was that data were missing for many of the variables mainly
due to poor documentation in the EMS and medical records. With regard to the primary end point, we com-pared patients with and without information on the time between call for EMS and CT scan on a number of back-ground variables including age, sex, patients history and priority given by EMS. No significant differences were found, suggesting that a representative population was evaluated. A majority of the patients did not know the exact time for the onset of symptoms and could there-fore not be included in the analyses. The limited data that are presented on this variable should therefore be interpreted with caution.
CONCLUSIONS
For further improvement of the early care of stroke, the system delay time should be reduced even more. In western Sweden, only half of the patients were given the highest priority at the dispatch centre. Three of four patients were transported by the EMS and in two-thirds of these cases the EMS nurse suspected stroke, but they seldom sent a prenotification to the stroke unit. By improved training in identifying and assessing patients with stroke, EMS nurses will be able to contact the stroke unit and use the stroke pathway system even better. The study showed that patients often arrived in the hospital within the time window for thrombolytic therapy, but that most of these patients were still not treated with thrombolytics. The reason for this in-hospital delay is not clear and further studies are required.
Author affiliations
1Faculty of Caring Science, Work Life and Social Welfare, Research Centre PreHospen, University of Borås, The Prehospital Research Centre of Western Sweden, Borås, Sweden
2Department of Molecular and Clinical Medicine/Cardiology, Sahlgrenska Academy, Institute of Medicine, University of Gothenburg, Gothenburg, Sweden
3Emergency Medical Service System, NU-Hospital Organisation, Trollhättan, Sweden
AcknowledgementsThe authors would like to thank Helle Wijk, University of Gothenburg, for support in design of the data protocol and the application form to the Research Ethics Committee; Jonny Lindqvist, Sahlgrenska University Hospital, for statistical analyses and hosting the data. They also thank the data collecting group staffed with Sylvia Kalju, Emelie Larsson, Sofie Nordkvist and Andreas Wändahl from the EMS in Region Västra Götaland, who retrospectively collected data from medical records.
Contributors BWS, JH, POH and PB were involved in study conception and design, analysis and interpretation of findings, and finally the development of the manuscript. PB organised and carried out the data collection together with the data collecting group. BWS and JH were responsible for manuscript preparation and final approval of the manuscript.
Funding This work was supported by The Health and Medical Care Committee of the Regional Executive Board, Region Västra Götaland, Sweden.
Competing interests None declared.
Patient consent Obtained.
Ethics approval The design of the study was approved by the Research Ethics Committee in Gothenburg (registration number 514-10).
Provenance and peer review Not commissioned; externally peer reviewed.
Data sharing statement No additional data are available.
Open Access This is an Open Access article distributed in accordance with the Creative Commons Attribution Non Commercial (CC BY-NC 4.0) license, which permits others to distribute, remix, adapt, build upon this work non-commercially, and license their derivative works on different terms, provided the original work is properly cited and the use is non-commercial. See: http:// creativecommons.org/licenses/by-nc/4.0/
REFERENCES
1. Bennett DA, Krishnamurthi RV, Barker-Collo S, et al., Global Burden of Diseases, Injuries, and Risk Factors 2010 Study Stroke Expert Group. The global burden of ischemic stroke: findings of the GBD 2010 study.Glob Heart2014;9:107–12.
2. Krishnamurthi RV, Moran AE, Forouzanfar MH, et al., Global Burden of Diseases, Injuries, and Risk Factors 2010 Study Stroke Expert Group. The global burden of hemorrhagic stroke: a summary of findings from the GBD 2010 study.Glob Heart2014;9:101–6. 3. Palomeras E, Fossas P, Quintana M, et al. Emergency perception
and other variables associated with extra-hospital delay in stroke patients in the Maresme region (Spain).Eur J Neurol
2008;15:329–35.
4. Gargano JW, Wehner S, Reeves MJ. Do presenting symptoms explain sex differences in emergency department delays among patients with acute stroke?Stroke2009;40:1114–20.
5. Donnan GA, Fisher M, Macleod M, et al. Stroke.Lancet 2008;371:1612–23.
6. Lakhan SE, Kirchgessner A, Hofer M. Inflammatory mechanisms in ischemic stroke: therapeutic approaches.J Translat Med2009;7:97. 7. Lee KR, Bluhmki E, von Kummer R, et al. Time to treatment with
intravenous alteplase and outcome in stroke: an updated pooled analysis of ECASS, ATLANTIS, NINDS and EPITHET trials.Lancet 2010;375:1695–703.
8. Díez-Tejedor E, Fuentes B. Acute care in stroke: the most importance of early intervention to achieve better brain protection. Cerebrovasc Dis2004;17:130–7.
9. Evenson KR, Foraker RE, Morris DL, et al. A comprehensive review of prehospital and in-hospital delay times in acute stroke care.Int J Stroke2009;4:187–99.
10. Barber PA, Zhang J, Demchuk AM, et al. Why are stroke patients excluded from TPA therapy? An analysis of patient eligibility. Neurology2001;56:1015–20.
11. Chang KC, Tseng MC, Tan TY. Prehospital delay after acute stroke in Kaosiung, Taiwan.Stroke2004;35:700–4.
12. Wennman I, Klittermark P, Herlitz J, et al. The clinical consequences of a prehospital diagnosis of stroke by emergency medical service system. A pilot study.Scand J Trauma Resus Emerg Med 2012;20:48.
13. Kim SK, Lee SY, Bae HU, et al. Prehospital notification reduced the door-to-needle time for iv t-PA in acute ischemic stroke.Eur J Neurology2009;16:1331–5.
14. Desai JA, Smith EE. Prenotification and other factors involved in rapid tPA administration.Curr Atheroscler Rep2013;15:337. 15. Mehdiratta M, Woolfenden AR, Chapman KM, et al. Reduction in IV
t-PA door to needle times using an Acute Stroke Triage Pathway. Can J Neurol Sci2006;33:214–16.
16. Lau AY, Soo YO, Graham CA, et al. An expedited stroke triage pathway: the key to shortening the door-to-needle time in delivery of thrombolysis. Hong Kong Med J 2010;16:455–62.
17. Hand J, Kwan J, Lindley RI, et al. Distinguishing between stroke and mimic at the bedside: the brain attack study.Stroke2006;37:769–75. 18. Lacy CR, Suh DC, Bueno M, et al. Delay in presentation and
evaluation for acute stroke: Stroke Time Registry for Outcome Knowledge and Epidemiology (STROKE).Stroke2001;32:63–9. 19. Wester P, Rådberg J, Lundgren B, et al. Factors associated with
delayed admission to hospital and in-hospital delays in acute stroke and TIA: a prospective, multicenter study. Seek-Medical-Attention-in-Time Study Group.Stroke1999;30:40–8.
20. Faiz KW, Sundseth A, Thommessen B, et al. Reasons for low thrombolysis rate in a Norwegian ischemic stroke population.Neurol Sci2014;35:1977–82.
21. Widgren BR, Jourak M. Medical Emergency Triage and Treatment System (METTS): a new protocol in primary triage and secondary priority decision in emergency medicine.J Emerg Med
2011;40:623–8.
22. Starmark JE, Stålhammar D, Holmgren E. The Reaction Level Scale (RLS 85).Acta Neurochir (Wien)1988;91:12–20.
23. Derex L, Adeleine P, Nighoghossian N, et al. Factors influencing early admission in a French Stroke unit.Stroke2002;33:153–9. 24. Kleindorfer DO, Lindsell CJ, Broderick JP, et al. Community
socioeconomic status and prehospital times in acute stroke and transient ischemic attack: do poorer patients has longer delays from 911 call to the emergency department.Stroke2006;37:1354–5. 25. Harraf F, Sharma AK, Brown MM, et al. A multicentre observational
study of presentational study of presentation and early assessment of acute stroke.Brit Med J2002;325:17–21.
26. Barr J, McKinley S, O’Brien E, et al. Patient recognition of and response to symtoms of TIA or stroke.Neuroepidemiology 2006;26:168–75.
27. Meretoja A, Strbian D, Mustanoja S, et al. Reducing in-hospital delay to 20 minutes in stroke thrombolysis.Neurology 2012;79:306–13.
28. Millin MG, Gullett T, Daya MR. EMS management of acute stroke— out-of-hospital treatment and stroke system development (resource document to NAEMSP position statement).Prehosp Emerg Care 2007;11:318–25.
29. Yasuyuki I, Kuniyasu W, Kensaku S, et al. First impression at stroke onset plays an important role in early hospital arrival.Intern Med 2006;45:447–51.
30. Fogle CC, Oser CS, Troutman TP, et al. Public education strategies to increase awareness of stroke warning signs and the need to call 911.J Public Health Manag Pract2008;14:e17–22.
31. Morgenstern LB, Bartholomew LK, Grotta JC, et al. Substained benefit of a community and professional intervention to reduce prehospital delays in patients with cerebrovascular events. Arch Intern Med2009;169:1484–90.
32. Kim YS, Park SS, Bae HJ, et al. Stroke awareness decreases prehospital delay after acute ischemic stroke in Korea.BMC Neurol 2011;11:2.
33. Keaskin Ö, Kalemoglu M, Ulusoy RE. A clinical investigation into prehospital and emergency department delays in acute stroke care. Med Princ Pract 2005;14:408–12.
34. Herlitz J, Wireklintsundström B, Bång A, et al. Early identification and delay to treatment in myocardial infarction and stroke: differences and similarities.Scand J Trauma, Resusc Emerg Med 2010;18:48.
35. Berglund A, Svensson L, Sjöstrand C, et al., ASTA Collaborators. Higher prehospital priority level of stroke improves thrombolysis frequency and time to stroke unit: the Hyper Acute STroke Alarm (HASTA) study.Stroke2012;43:2666–70.
36. Ramanujam P, Guluma KZ, Castillo EM, et al. Accuracy of stroke recognition by emergency medical dispatchers and paramedics— San Diego experience.Prehosp Emerg Care2008;12:307–13.
37. Wendt M, Ebinger M, Kunz A, et al., STEMO Consortium. Improved prehospital triage of patients with stroke in a specialized stroke ambulance: results of the pre-hospital acute neurological therapy and optimization of medical care in stroke study.Stroke 2015;46:740–5.
38. Rajajee V, Saver J. Prehospital care of the acute stroke patient. Tech Vasc Interv Radiol2005;8:74–80.
39. Crocco TJ. Streamlining stroke care: from symptom onset to emergency department.J Emerg Med2007;33:255–60. 40. van Dishoeck AM, Dippel DW, Dirks M, et al. Measuring Quality
Improvement in Acute Ischemic Stroke Care: Interrupted Time Series Analysis of Door-to-Needle Time.Cerebrovasc Dis Extra 2014;4:149–55.
41. Sheppard JP, Mellor RM, Bailey SM, et al., BBC CLAHRC Investigators. Protocol for an observation and implementation study investigating optimisation of the management of stroke and transient ischaemic attack (TIA).BMJ Open2012;2:e001430.
42. Leonardi-Bee J, Bath PM, Phillips SJ, et al., IST Collaborative group. Blood pressure and clinical outcomes in the International Stroke Trial.Stroke2002;33:1315–20.
43. Mosley I, Nicol M, Donnan G, et al. Stroke symptoms and the decision to call for an ambulance.Stroke2007;38:61–366. 44. Demaerschalk BM, Vegunta S, Vargas BB, et al. Reliability of
real-time video smartphone for assessing National Institutes of Health Stroke Scale scores in acute stroke patients.Stroke 2012;43:3271–7.
45. Gonzalez MA, Hanna N, Rodrigo ME, et al. Reliability of prehospital real-time cellular video phone in assessing the simplified National Institutes of Health Stroke Scale in patients with acute stroke: a novel telemedicine technology.Stroke2011;42:1522–7.
46. Ebinger M, Winter B, Wendt M, et al., STEMO Consortium. Effect of the use of ambulance-based thrombolysis on time to thrombolysis in acute ischemic stroke: a randomized clinical trial.JAMA
2014;311:1622–31.
47. Lossius HM, Lund CG. Pre-hospital treatment of stroke—time is brain.Tidsskr Nor Legeforen2012;132:1848–9.
48. Walter S, Kostopoulos P, Haass A, et al. Diagnosis and treatment of patients with stroke in a mobile stroke unit versus in hospital: a randomised controlled trial.Lancet Neurol2012;11:397–404. 49. Persson M, Fhager A, Trefne HD, et al. Microwave-based stroke
diagnosis making global prehospital thrombolytic treatment possible. IEEE Trans Biomed Eng2014;61:2800–17.
50. Handschu R, Littmann R, Reulbach U, et al. Telemedicine in emergency evaluation of acute stroke: interrater agreement in remote video examination with a novel multimedia system.Stroke 2003;34:2842–6.
observational study
of care for acute stroke: results of an
identify potential weak links in the early chain
county hospitals in western Sweden to
Comparison of the university hospital and
Brink
Birgitta Wireklint Sundström, Johan Herlitz, Per Olof Hansson and Peter
doi: 10.1136/bmjopen-2015-008228
2015 5:
BMJ Open
http://bmjopen.bmj.com/content/5/9/e008228
Updated information and services can be found at:
These include:
References
#BIBL http://bmjopen.bmj.com/content/5/9/e008228
This article cites 50 articles, 15 of which you can access for free at:
Open Access
http://creativecommons.org/licenses/by-nc/4.0/
non-commercial. See:
provided the original work is properly cited and the use is
non-commercially, and license their derivative works on different terms, permits others to distribute, remix, adapt, build upon this work
Commons Attribution Non Commercial (CC BY-NC 4.0) license, which This is an Open Access article distributed in accordance with the Creative
service
Email alerting
box at the top right corner of the online article.
Receive free email alerts when new articles cite this article. Sign up in the
Collections
Topic
Articles on similar topics can be found in the following collections(55) Nursing (130) Emergency medicine (429) Cardiovascular medicine
Notes
http://group.bmj.com/group/rights-licensing/permissionsTo request permissions go to:
http://journals.bmj.com/cgi/reprintform
To order reprints go to:
http://group.bmj.com/subscribe/