Bachelor’s Thesis 15 credits
Consistency in Web Design from a User Perspective
Konsekvent webbdesign utifr˚
an ett anv¨andarperspektiv
Anton Axelsson m09p0891@student.mah.se
Exam: Bachelor of Science 180 credits Subject area: Computer Science
Examiner: Bengt Nilsson Supervisor: G¨oran Hagert
Abstract
Within Human-Computer Interaction, it has long been speculated that in-consistency impedes the user experience. However, defining and categor-ising consistency has been shown to be a challenging task. Several studies on the subject have categorised consistency with mixed perspectives of the system, its developer, and its user. The present thesis considers only the user perspective, and categorises consistency into Perceptual, Semantic, and Procedural consistency. 21 subjects, with moderate experience in us-ing the web, participated in an experiment designed to explore the effect inconsistency might have on usability. In order to test both main and in-teraction effects between the three proposed consistencies, the experiment was based on a full 2 × 2 × 2 factorial design for repeated measures. The participants’ task was to use eight partly different versions of a mock-up web shop in which a subject selection drop-down menu was experimentally manipulated. Multiple Analysis of Covariance revealed that Perceptual and Procedural inconsistency affected user performance negatively. It also indicated that inhibitory interaction effects occurred between some of the (in)consistencies. The results have important implications for web de-velopers in designing usable applications. By adapting a user perspective, they can aid users to avoid performing faulty actions.
Sammanfattning
Inom människa-datorinteraktion har det länge spekulerats huruvida in-konsekvent design påverkar användarupplevelsen. Att definiera och kate-gorisera olika typer av konsekvens har visat sig svårt. Flera studier på området har kategoriserat typer av inkonsekvens med blandade perspek-tiv av såväl systemet, dess utvecklare samt dess användare. Denna uppsats sätter användarens perspektiv i fokus och kategoriserar typer av inkon-sekvens i perceptuell, semantisk och procedurell koninkon-sekvens. 21 personer, med måttlig erfarenhet av att bruka nätet, deltog i ett experiment utfor-mat att utforska effekterna av inkonsekvent design på användbarhet. För att pröva såväl huvud- som interaktionseffekter baserades experimentet på en fullständig 2 × 2 × 2 faktordesign för upprepade mätningar. Del-tagarnas uppgift var att använda åtta prototyper av en webbutik där en dropdownmeny för ämnesval utsattes för experimentell manipulation. En trevägs variansanalys med kovariat visade att perceptuellt och procedu-rellt inkonsekvent design påverkade användarupplevelsen negativt. Resul-taten pekade också på att hämmande interaktionseffekter uppstod mellan vissa av de tre inkonsekvenserna. Resultaten ger viktiga implikationer för webbutvecklare när de skall utveckla användbara applikationer. Genom ett användarperspektiv kan utvecklare hjälpa användare att undvika fel-aktiga handlingar.
Nyckelord: konsekvens, användbarhet, webbdesign, MDI, användarper-spektiv
Contents
1 Introduction 1
1.1 Previous Research on Consistency . . . 1
1.2 Redifining Consistency within HCI . . . 4
1.3 Purpose and Expected Outcomes . . . 6
2 Methods 9 2.1 Participants . . . 9 2.2 Material . . . 9 2.3 Design . . . 11 2.4 Procedure . . . 12 2.5 Measurements . . . 13 3 Results 15 3.1 Sample . . . 15 3.2 Handling Covariance . . . 15 3.3 User Satisfaction . . . 17 3.4 User Error . . . 18 3.5 User Efficiency . . . 19 4 Discussion 21 4.1 Implications . . . 21 4.2 Limitations . . . 22 4.3 Further Research . . . 23 4.4 Conclusions . . . 24
A Baseline Choice Selections 29
B Variations of Inconsistency in Subject System 30
C Task Compendium 33
1
Introduction
It has long been debated whether or not consistency is an important factor of usability within Human-Computer Interaction (HCI). Shneiderman (1992) claimed consistency to be the primary concern when putting forth his heur-istic eight golden rules of dialogue design. Grudin (1989) argued antithetically against this by pointing out instances where consistency might counteract usab-ility. Reisner (1981) highlighted early on that there is very little agreement as to what consistency actually is. Many have since tried to approach an explanation by singling out and categorising different types of consistencies (e.g., Grudin, 1989; Kellogg, 1987; Tanaka, Eberts & Salvendy, 1991).
Findings from studies and experiments on the subject have since been brought forward, disclosing mixed results (e.g., Adamson, 1996; AlTaboli & Abou-Zeid, 2007; Kellogg, 1987; Mendel & Pak, 2009; Ozok & Salvendy, 2000; Satzinger, 1998). Therefore, the answer as to what consistency within HCI should entail remains elusive.
The aim of the present study is to explore whether consistency affects usab-ility, by an experiment testing the main effects and interactions of Perceptual, Semantic, and Procedural consistency. In contrast to previous research, we ex-plicitly define consistency entirely from the user’s, rather than the developer’s or system’s, point of view.
1.1
Previous Research on Consistency
1.1.1 Difficulties in Defining Consistency
Attempts at capturing the essence of consistency were made already in the times of terminal based operating systems and applications. The focus of research was initially aimed at consistency in command language (e.g., Barnard, Hammond, Morton, Long & Clark, 1981; Payne & Green, 1986; Reisner, 1981).
At the ACM CHI’88 conference in Washington, a workshop was held with 15 usability experts aiming to agree on a joint definition of consistency for HCI (Nielsen, 1989). An agreement was never met and, therefore, the term still has not been given an adequate definition. Instead, it has been, and still is, used implicitly under its conventional meaning.
Generally, it is claimed of consistency within HCI, that it allows users to reason analogically and thereby predict actions within novel tasks (Blake, 1986; Mayhew, 1992). Others reason that consistency means that similar actions lead to similar results (Wolf, 1989; see also Shneiderman, 1992; Wiecha, Bennett, Boies & Gould, 1990).
Kellogg (1989) argued that consistency is meaningless on its own, thus ren-dering a guideline with consistency as an independent goal meaningless. Con-stantine and Lockwood (1999) made a similar claim saying that striving for consistency for its own sake might lead to “consistently bad solutions” (p. 62).
Conversely, it has been claimed that there are instances where inconsisten-cies are desirable. Shneiderman (1992) mentions for example how passwords should not be echoed to users and that delete operations should result in a con-firmatory prompt, also pointing out that these types of inconsistencies should be kept at a minimum.
Kimball, Verplank and Harslem (1982) deemed it the most difficult characteristic to attain within system development.
1.1.2 Frameworks for Consistency
Grudin (1989) requested a new way of viewing consistency within HCI. He put forth an antithetical view that consistency of a user interface is an unwork-able concept and said it to lead designers astray, disguising good design as an interface property.
After the ACM CHI’88 workshop he came to the conclusion that work on defining consistency should be restarted. As a way of starting anew, he proposed three categories of consistency: (1) internal, (2) external, and (3) analogue. The internal category comprises consistencies within an application (or web site), the external category comprises consistencies between applications or platforms, and the analogue category comprises consistencies with conceptual metaphors, such as the desktop metaphor (Smith et al., 1982). He also hinted at a fourth category, (4) veridical, which would be an interface fully consistent with its system’s design (rather than the user’s needs).
Subsequent to the theoretical work of Grudin (1989), attempts at defining consistency was abandoned and instead work was aimed at finding types and categories of consistencies.
Building on Moran’s (1981) ideas of interface levels, Kellogg (1987) con-structed a framework consisting of (1) conceptual, (2) communicational, and (3) physical consistency, which were all either internal or external. Conceptual consistency concerned correspondence to metaphor and mapping between user and system tasks. Communicational consistency concerned interaction between user and system, and physical consistency was related to screen layout.
Tanaka et al. (1991) distinguished between two types of consistencies: (1) cognitive and (2) display. Cognitive consistency is characterised by consistency in user knowledge, whilst display consistency is defined as consistency in screen layout.
Somberg (2000) argued that too much focus within development of interface standards had been aimed at the look and feel of systems. A new approach called functional user interface standards, based on object-oriented programming, was proposed to deal with task performance, thereby facilitating what he called procedural consistency.
1.1.3 Measuring Usability
In order to measure the usability of a system, usability metrics are used. Two categories of metrics are normally used in experiments on consistency within HCI: (1) performance metrics and (2) self-reported metrics. Performance met-rics can be measured through the time it takes to complete a task (time-on-task), number of errors made, or the number of clicks made (click rate), whereas self-reported metrics are measures self-reported by users themselves, such as how they rate an application or how difficult they found a task to perform (Tullis & Albert, 2008).
1.1.4 Preceding Experiments
Adamson (1996), Ozok and Salvendy (2000), and AlTaboli and Abou-Zeid (2007) found physical inconsistency to increase user errors. AlTaboli and Abou-Zeid (2007) also found evidence that it affects user satisfaction.
Adamson (1996) found indications that communicational inconsistencies af-fect user performance and satisfaction, which Ozok and Salvendy (2000) did not.
Kellogg (1987) found that conceptual inconsistencies affected both user per-formance and satisfaction, whilst Ozok and Salvendy (2000) found no such evid-ence.
Mendel and Pak (2009) pointed out the fact that the mixed, and sometimes even detrimental, results of all these experiments may lie in the manipulation of task difficulty. Adamson (1996) used a combination of radio buttons and drop down menus to create his inconsistencies. It is both interesting and surprising that he found evidence for effects on user performance and satisfaction for such a simple experiment. One factor might be that nearly 30 percent of his subjects had very little experience of using graphical user interfaces. Ozok and Salvendy (2000), on the other hand, had participants more experienced with user inter-faces, which could account for the diametrically opposite results of Adamson (1996) with regard to communicational inconsistency.
Another possible explanation for the mixed results of these experiments is that experimenters might be tainted by their own interpretations of what is consistent and what is not. Satzinger (1998) carried out a study on consistency of conceptual models. He found no evidence that his manipulation affected user performance or satisfaction. He did, however, find indications that “more accurate mental models might be developed when conceptual models are incon-sistent ” (p. 11, original emphasis). Participants in his experiment were asked to carry out tasks in two separate systems. All participants used a system called NUCLEUS as a first system. Half of the participants used a second system con-sistent in action grammar to NUCLEUS and the other half used a second system inconsistent in action grammar to NUCLEUS. For example, in the inconsistent version the action ‘Delete’ was called ‘Erase’. The question is whether the terms ‘Delete’ and ‘Erase’ are really conceptually inconsistent from a user’s point of view. Perceptually they look different, but semantically they mean the same thing, and in the two systems they resulted in the same action. This would make them conceptually consistent. If, on the other hand, the two terms had been used within the same system with the same outcomes then this could be perceived as inconsistent, and would thereby possibly confuse users.
1.1.5 Consistency from the Developer’s Perspective
The current view on consistency seems to be founded in a developer’s perspect-ive. Satzinger’s (1998) study on conceptual consistency illustrates this, but the most prominent example is one of Grudin’s (1989) arguments of when incon-sistencies are desirable. Although acknowledging the fact that what a developer (or designer) might consider consistent might as well be inconsistent in the eyes of the user, he seems to overlook this in his example.
The example is one from early word processors, where a user selects a phrase in order to italicise it through a menu. The next time the user selects a phrase
and enters the same menu, the italic option is preselected. Thus, the system con-sistently preselects previously used options to ease word processing. However, when the user returns to the menu after copying a selection to the clipboard, this time the paste option is preselected. According to Grudin (1989), this is a facilitating inconsistency in the word processor. But, this example is only inconsistent when considered from the developers reasoning when building this feature. If we instead look at it from a user’s perspective, this feature is consist-ently facilitating the user with what action the user most probably would like to perform next.
Thus, it is proposed that we shift our focus from a developer’s, and even a system’s, perspective to one which only considers the user’s perspective with regard to consistency in HCI.
1.2
Redifining Consistency within HCI
In recent years outspoken professional web developers have claimed consistency to bear no importance, at least with regard to web usability (37signals, 2006; Hurst, 2004). Instead they advocate that user needs should be prioritised over interface consistency. Hurst coined this way of reasoning intelligent inconsist-ency.
The shift of concern regarding consistency from Shneiderman (1992) saying its vital, via Grudin (1989) calling it misleading, to Hurst (2004) deeming it is insignificant, is possibly due to the fact that consistency has become easy to take for granted within application development. This because it has become easier to achieve over the years thanks to concepts such as object-oriented pro-gramming and graphical user interface libraries. These ensure reuse of code and graphical elements. The definitions of HTML standards do the same for web site applications, as do the multitude of usability guidelines which many developers and designers adhere to.
This is possibly why Hurst (2004) considers consistency a non-issue when it comes to web site design. However, it does not alter the necessity of consistency from a user’s point of view. It might be somewhat easier to achieve, thanks to a tremendous work of standardising the development of applications, but consistency is still of fundamental importance. It is therefore vital to come to a conclusion as to what consistency really is and decide on a definition of what it means within HCI.
1.2.1 Etymology of ‘Consistency’
The term ‘consistency’ is derived from the Latin word consistere whose literal meaning is “to stand still”. Encyclopedia Britannica (2012) defines ‘consistent’ as “not having or showing any apparent conflict”, whilst The Free Dictionary (2012) defines the term as “[r]eliability or uniformity of successive results or events”. Thereby, consistency is purely relational and concerns perceived uni-formity between two or more occurrences. Related words include ‘coherence’, ‘familiarity’, and ‘regularity’.
The opposite of consistency is inconsistency, which entails that irregular patterns emerge when two or more occurrences are compared, between which we would expect regularities. This, as we shall see, can be crucial for decision making.
1.2.2 Cognition and Consistency
In a fire’s seemingly haphazard behaviour there are regular patterns which an experienced firefighter can interpret. In order to explain the inner workings of intuition, Klein (1999) referred to a particular case that illustrated how a commander reacted on a gut feeling to flee when a fire did not act as anticip-ated, and thereby he saved the lives of himself and of a group of several other firefighters.
Tiny clues in the environment can be picked up by humans and other an-imals. Regular patterns are subconsciously registered upon which decisions are based. All species alive today are the product of their ancestors’ decisions. By evolving in an environment with regularities, we have learned what to eat and what to avoid. Poor decisions means being left out of the gene pool. The survivors have thereby added refined skills of pattern recognition to succeeding generations by making the right choices (Shermer, 2011).
We are dependent on our ability to recognise inconsistency for survival. We recognise familiar patterns, or acknowledge disruption of patterns, and upon this we base our decisions. Our innate ability to recognise inconsistency alerts us also when interacting with computers, and the conventional view is that it impedes usability.
1.2.3 Definition and Categorisation
As previously acknowledged, through the dictionary definitions, consistency is a relational concept. It can be argued that it is therefore also a subjective, observational phenomenon. In order to have consistency, you need an observer who apperceives. Thus, in HCI, this implies that consistency of a web site can never exist independently from its user’s experience and expectations; they are intricately intertwined because consistency is founded in the user’s apperception. With the view that consistency should be redefined from a user perspective, the need for a new definition of consistency within HCI also arises. The following definition will be used for this study:
Consistency is the user’s apperception of regularities within a sys-tem, leading the user to actions in the task environment based on previous experiences.
This leaves Grudin’s categories somewhat counterintuitive because they are based on a claimed consistency’s origin, and therefore bears little relation to the user. The veridical category leaves the user completely out of the picture, whilst the analogue category is unreliable because it is dependent on knowledge transfer. Studies have shown that there are no guarantees that the knowledge transfer will occur on its own, without connections being explicitly pointed out to the learner (or user; Gick & Holyoak, 1980 in Barnett & Ceci, 2002). Internal and external consistencies can be somewhat useful as a means of discussing whether an argued consistency is derived from, for example, industry standards (external) or company guidelines (internal).
Based on previous work on categorising and developing frameworks for con-sistency (e.g., Grudin, 1989; Kellogg, 1987; Tanaka et al., 1991), we propose a new categorisation, redefined from a user’s perspective, taking cognition into
consideration. This is motivated by the subjective nature of consistency, as dis-cussed in Section 1.2.2. Previous categories mixed features of the system with the user’s cognitive abilities. These must be kept apart. The three redefined categories proposed are Perceptual, Semantic, and Procedural consistencies. Perceptual Consistency
Perceptual consistency has to do with what we perceive when interacting with, for instance, a web site. Most commonly it will be through the visual perception, but can of course be auditory for visually impaired. This includes the use of colours and graphical elements, adhesion to the gestalt principles (e.g., Kanizsa, 1979), and so forth. For example, the use of the same fonts and font sizes in a text in a paragraph facilitates reading. Perceptual consistency is similar to Kellogg’s (1987) physical consistency, although with a shift in focus from screen layout to the user’s perception of the system.
Semantic Consistency
Semantic consistency is derived from our semantic memory for facts and words. It has to do with consistent use of symbols and icons in correct context; if what has been perceived is consistent in meaning so that the correct action can be taken in the next step. When a system is semantically consistent it facilitates the user’s conceptual model (Foley & van Dam, 1982). The term “semantic” is here used in its traditional meaning, but with the amendment of including the position of objects and symbols. In interaction design, the placement of an object is as important as its appearance for inferring the object’s purpose in the same way that words can have different meanings in different contexts. Examples of Semantic consistency include that all anchors should be coloured blue and underlined, or that submit buttons should appear in the same place in all forms throughout a web site.
Procedural Consistency
Procedural consistency has to do with whether action types and sequences ne-cessary to achieve a goal are consistent or not. For example, all drop-down menus need one click to reveal options, and another click to choose one of the revealed options. Procedural consistency is similar to Kellogg’s (1987) commu-nicational consistency with the alteration that it only takes the user’s actions into account when interacting with the system. In the present model, the sys-tem part of the communication is considered under Perceptual consistency, in how the user perceives feedback from the system.
1.3
Purpose and Expected Outcomes
The area of consistency within HCI lacks in clear theories. As mentioned earlier, the conventional view is that inconsistency impedes usability, but (in)consistency has previously only been loosely defined. Our purpose is to explore whether or not Perceptual, Semantic, and Procedural inconsistencies affect user perform-ance and satisfaction, and if there are any interaction effects when combining these inconsistencies. Empirical results on the relationships between different kinds of inconsistency, based on the user’s point of view, is expected to contrib-ute to the development of theory of consistency within HCI. Adapting a user’s
perspective justifies the need for conducting a behavioural experiment.
Drawing on previous research (Adamson, 1996; AlTaboli & Abou-Zeid, 2007; Kellogg, 1987; Ozok & Salvendy, 2000) it is expected to find main effects on both user performance and user satisfaction from the three kinds of inconsistencies. Importantly, it is unusual to consider interaction effects in studies of inconsistency, but drawing on previous results, any interaction effects between the three inconsistencies are expected to be cumulative, leading to an amplified decrease in user performance, as well as, satisfaction.
2
Methods
2.1
Participants
A convenience sample of 21 participants was recruited for the experiment (7 women, 14 men; Mage = 31 years, SD = 7.04 years). The minimum computer
experience was 10 years. Of the 21 participants, 8 had either begun or completed a university degree in, or worked professionally within a computer related field. On average, the participants reported spending 3.5 hours each day actively on the Internet. They also reported having, on average, moderate experience (3 on a 4-point category scale) filling out forms on the web, as well as purchasing products over the web.
2.2
Material
Data was collected in a computer lab at the Malmö School of Technology. Each participant was assigned a computer, running Windows 8, and the assignments were performed using eight Web site versions of a mock-up web shop running in a Firefox (v14.0.1) browser. Each participant was also given a pen and an assignment compendium, consisting of a cover page, an introduction, and eight numbered tasks (an example compendium is enclosed in Appendix C).
2.2.1 Mock-Up Web Shop
The web shop was built using PHP, HTML5 and JavaScript (Figure 2.1b). The back-end was running on an Apache server and utilised a MySQL database. All user activity, key strokes and mouse clicks, was logged through JavaScript and sent in the background through AJAX requests to the server.
Throughout the web shop, sequences of drop-down menus were used to select categories and subcategories of options (see Figures in Appendix A & B). Initially, in the consistent, or baseline, version of the web shop, only one drop-down menu for subcategory selection was visible. Once an option was selected in the visible drop-down menu, the next subcategory drop-down menu appeared. This system of drop-down menus was used to select newsletter options, expiry date for credit card payment, and subject categories in a contact form, in three separate parts of the web shop.
The subject drop-down menu system (henceforth, subject system) in the web shop’s contact page was subjected to experimental manipulation, whereas the newsletter and expiry date selections were kept constant in the experiment. The rationale behind this design was that inconsistency is relational, and may thus only occur in relation to a baseline. Hence, in the present experiment the drop-down menu system for selecting newsletter options and expiry date options for credit card payment was used as the baseline.
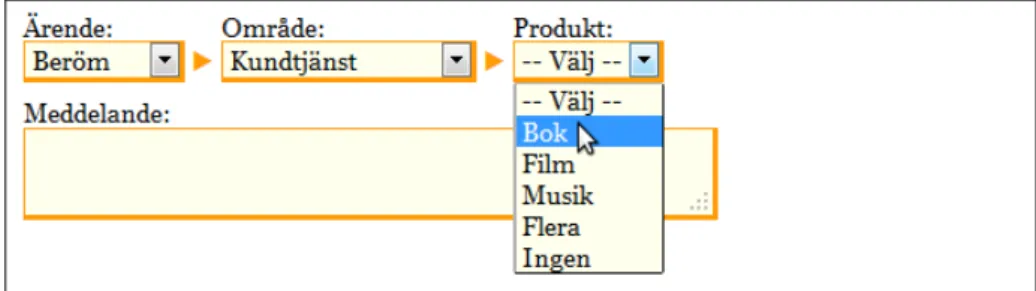
All combinations of presence/absence of the three inconsistencies (Percep-tual, Semantic, and Procedural) were used in a full 2 × 2 × 2 factorial design to alter the subject system on the contact page. This resulted in eight different versions (W1-8) of the web shop, or rather, eight different versions of the subject system on the contact page depicted in Figure 2.1c. The figures in Appendix B depicts the manipulations of the subject system.
(a) Introductory demographics form. (b) Web shop mock-up.
(c) Contact page. (d) Post task evaluation. Figure 2.1: Web site setup.
Web site 1 (W1) included none of the inconsistencies (Figure B.1). Thereby, the subject system on the contact page was fully consistent with the baseline newsletter and expiry date selection.
Web site 2 (W2) included Perceptual inconsistency in the subject system on the contact page when compared to the baseline drop-down menus (Figure B.2). In this version the subject system was replaced by buttons and radio buttons, this in order to change its visual appearance compared to the baseline. A web developer might argue that this would be a Semantic inconsistency, referring to the semantic web. However, the manipulation is carried out from the user’s perspective, in such a manner that it only affects how the subject system looks, keeping the interaction of subject selection constant.
Web site 3 (W3) included Semantic inconsistency in the subject system on the contact page when compared to the baseline drop-down menus (Figure B.3). The drop-down menu system was kept. However, the drop-down element was given the visual appearance of the baseline element label. Conversely, the element labels were given the visual appearance of the baseline drop-down ele-ment (see Figure B.1). In addition, the eleele-ment label was placed to the right of the drop-down element instead of above as in the baseline version. Thus, the baseline semantics were interchanged; an orange frame and yellow background with black text represented the drop-down element in the baseline, but here rep-resented a label, whilst black text on white background reprep-resented the element label in the baseline, but here represented the drop-down element.
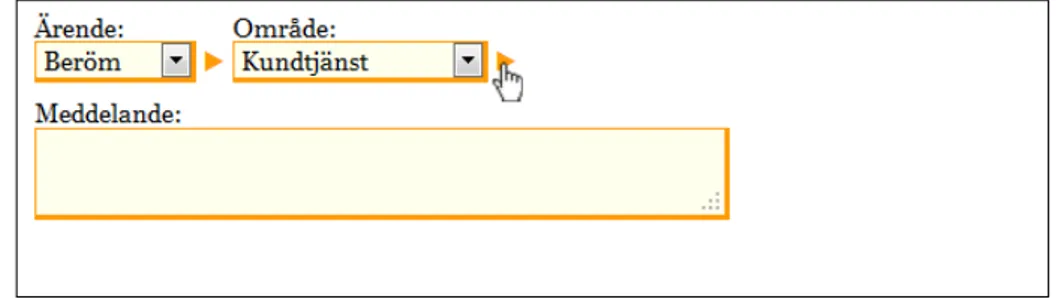
Web site 4 (W4) included Procedural inconsistency in the subject system
on the contact page when compared to the baseline drop-down menus (Figure B.4). The drop-down system was kept. However, when choosing a subject subcategory in this version, the subsequent subcategory drop-down menu did not appear automatically. Instead, the user had to click on an orange arrow to the right of the subcategory in order to reveal the subsequent subcategory drop-down menu. This obliged the user to carry out additional actions (pointing and clicking) in the procedure of choosing the contact subject. This resulted in an inconsistent procedure when choosing contact subject compared to the baseline’s automatically appearing drop-down menus.
Web site 5 (W5) combined Perceptual and Semantic inconsistencies (Figure B.5). Thereby, the subject selection drop-down menus on the contact page were replaced by buttons and radio buttons, and also, an interchange of semantics was carried out in a similar fashion of W3.
Web site 6 (W6) combined Semantic and Procedural inconsistencies (Figure B.6). The exact interchange of semantics applied in W3 was used in this version, along with the need to click the orange arrow in order to reveal the subsequent subcategory drop-down menus.
Web site 7 (W7) combined Perceptual and Procedural inconsistencies (Fig-ure B.7). Buttons and radio buttons replaced the drop-down menus and the orange arrow had to be clicked to reveal the subsequent subcategory buttons and radio buttons.
Web site 8 (W8) combined all three inconsistencies (Figure B.8). Thus, the contact page used buttons and radio buttons, along with interchanged semantics of the elements in line with W3, together with the need to click the orange arrow to reveal subsequent subcategory buttons and radio buttons.
2.2.2 Task Sheets
The participants’ task was to assist eight fictive customers in buying three differ-ent products from the web shop. For this purpose the participants were provided eight unique task sheets (T1-8; Appendix C) holding pretend customer inform-ation, including contact, as well as, credit card details. In addition, all task sheets included (1) three unique products to be purchased in the web shop, (2) customer request to obtain a specific newsletter, and (3) a contact message from the customer. On all eight task sheets, the customer message was kept to an average length of 164 characters (Range: 160-168 characters). All eight tasks were designed to first introduce the participants to the consistent, baseline fea-tures of the web shop before they used the experimentally manipulated contact form.
2.3
Design
As indicated above, the experiment was conducted with a within-subject, 2 × 2 × 2 factorial design. The Perceptual, Semantic and Procedural inconsistencies were the independent variables, where the two levels of the factors represented presence or absence. One web site in combination with one task (e.g., W6:T2) was considered a treatment for each participant. All participants were given eight treatments.
An irregular Latin Square design was adapted in order to counterbalance the task, as well as, web site order. To minimise carryover effects, four criteria
were established for the design of a basic8 × 8 design matrix:
(1) Every one of the eight participants, in a basic design matrix, should perform all eight tasks (T1-8), and evaluate all eight web sites (W1-8).
(2) Each web site (W1-8) should be evaluated using all eight tasks (T1-8). Thus,8(W ebsites) × 8(T asks) = 64 combinations were to be used. (3) Every one of the eight participants, in a basic design matrix, should use all
the eight web sites (W1-8), combined with a task, in a unique order (i.e., Latin Square).
(4) A basic design matrix should be organised in such an order that each of the eight web sites (W1-8), combined with a task, should be followed by any other web site only once (i.e., irregular Latin Square).
The four criteria resulted in a design matrix for 8 participants. The pro-cedure was then repeated to create a different design matrix for another 8 par-ticipants. In all, it is possible to create 16 unique design matrices based on these four criteria. The design means that at least 8 — and thereafter multiples of 8 — participants are necessary in order to secure that an imbalance in the combination of tasks and web sites will not influence the experimental results.
2.4
Procedure
Data was collected at three separate group sessions with 7 different participants at each occasion. Each session started with the experimenter reading an intro-duction aloud for the participants. The participants were asked to read along in the compendium, or on the computer monitor in front of them. The parti-cipants were explicitly told to finish each task as fast as they could but with as few errors as possible.
Before the participants were allowed to start they were instructed to use the provided pen to circle the treatment number once they had finished a treatment, and before continuing on to the next. Remember that a treatment consisted of a web site (W1-8) combined with a task sheet (T1-8). It was stressed that it was important that the participants finished the treatments in the order given, and that circling the treatment number should help them to achieve this. The parti-cipants then entered an individual nine digit identification number on the start page of the experiment web site, and were redirected to a demographics form (Figure 2.1a) asking for their year of birth, sex, and computer experience. Once this form was completed the participants started on their first treatment. The unique treatment order for each participant was held in a pre-filled relational database with the individual identification number as a primary key.
Within each treatment, the participants conducted two subsequent tasks: (1) completing a purchase of three products, and (2) sending a customer con-tact message to the fictional company behind the web shop (Figure 2.1c). All information the participants needed was provided on the eight task sheets. A purchase was completed by placing the three specified products in the shop-ping basket, creating a new customer account with specified contact details and desired newsletter, and completing the order with delivery and credit card de-tails. Sending the message meant finding the web shop’s contact page, entering
customer details and specifying the subject, as well as writing the specified customer message. Once the contact message was sent the participants were redirected to an evaluation form (Figure 2.1d) where they rated their experi-ence with the web site (Table 2.1). When the evaluation was submitted, the participants were redirected to the next web site and they continued on their next task sheet. When participants had finished all eight treatments, they were given a consent form allowing for the use of their recorded data in analysis and they were asked to read and sign it (Appendix D). Completing the experiment took, on average, 53 minutes (SD= 9 minutes).
2.5
Measurements
There were four dependent variables measured in the experiment divided into three categories: user efficiency, user error and user satisfaction.
2.5.1 User Efficiency
Efficiency was measured through (1) Time-On-Task for contact form comple-tion, and (2) Click Rate for selecting a subject on the contact page. Timestamps where registered as checkpoints throughout the web sites so that activities car-ried out between these checkpoints could be monitored. Time-On-Task for com-pleting the contact form was measured between a start point when the user entered the contact page and an endpoint at contact form submission. Click Rate was measured by the number of clicks carried out between a start point at first interaction with the first subcategory selection element and an endpoint at the last interaction with the last subcategory selection element. The use of keyboard keys when selecting subject (such as tab, arrow, space bar and enter keys), as well as mouse clicks, were included in Click Rate. Clicks on the orange triangle needed to reveal subcategories in the procedurally inconsistent web sites were intrinsic to the experimental manipulation and were consequently not in-cluded in Click Rate, because it would have increased the click rate beyond that needed for the other experimental manipulations. The minimum Click Rate to select a subject was 6 clicks for all eight web sites (W1-8).
2.5.2 User Error
The number of errors a participant made between subject selection checkpoints were recorded. User Error was measured as the sum of three types of errors: (1) Click error — One click error was recorded for each element the
parti-cipant clicked between subject selection checkpoints that was not associ-ated with choosing the subcategories.
(2) Alert error — One alert error was recorded for each time the participant received an alert dialogue informing the participant that one of the sub-categories was missing.
(3) Selection error — One selection error was recorded, on contact form sub-mittal, for each faulty subcategory the participant had selected.
2.5.3 User Satisfaction
User satisfaction was measured as SUS Score by self reported metrics through an adaptation of Brooke’s (1996) System Usability Scale (SUS). The SUS con-sists of 10 statements to which users score their degree of agreement on a 5-point category scale (Disagree-Agree). The 10 original SUS statements were modified to fit the current study (see Table 2.1). The wordings of the statements are altered between positive and negative. To calculate the SUS Score, each pos-itively worded statement is given a score of its scale value minus 1, and each negatively worded statement is given a score of 5 minus its scale value. The sum of these scores is then multiplied by 2.5 to give a total percentage score between 0 and 100, where 100 represents complete satisfaction.
It should be pointed out that users were asked to rate the whole web shop experience, not just their interaction with the contact form (where the manipu-lation of the independent variables lies). The rationale behind this decision was twofold: (1) not to hint to users that the contact form was different in any way between the separate versions of the web shop, thereby avoiding any priming effects, and (2) to find out whether inconsistency in a small part of a web site could affect the whole user experience.
Table 2.1: The 10 SUS statements used for user satisfaction measurements. Adapted from Brooke (1996).
Statement Wording
1 I think that I would like to use this web site frequently Positive 2 I found the web site unnecessarily complex Negative 3 I thought the web site was easy to use Positive 4 I think I would need the support of a technical person to
be able to use this web site
Negative 5 I found that the various functions in the web site were well
integrated
Positive 6 I thought this web site was too inconsistent Negative 7 I would imagine that most people would learn to use this
web site very quickly
Positive 8 I found the web site very cumbersome to use Negative 9 I felt very confident carrying out the task using this web site Positive 10 I needed to learn a lot of things before I could get going
with this web site
Negative
3
Results
3.1
Sample
Data obtained from 16 of the 21 participants were used in the analyses. This corresponds to the first two complete basic design matrices (see Section 2.3). Two participants were excluded due to technical errors at data collection, and their unique treatments were reassigned to two new participants in order to maintain the design matrices to which they belonged. Data obtained from another three participants were left out of the analyses because they belonged to a third, incomplete basic design matrix.
3.2
Handling Covariance
Screening of the data revealed statistically significant Pearson coefficient of cor-relations between User Error and Time-On-Task, as well as between User Error and Click Rate (Table 3.1). The Pearson coefficient of correlations between SUS Score and the other dependent variables, as well as between Time-On-Task and Click Rate were not statistically different from zero. Because of this pattern of correlations, four separate multivariate analyses of covariance (MANCOVA) for repeated measures were conducted in a step-down analysis (cf. Roy-Bargmann step-down analysis; Tabachnick & Fidell, 2007; see also Finch, 2007). All of these analyses were conducted using the MANOVA syntax command in SPSS 20 for Mac OS X.
Because SUS Score was largely independent of the other three dependent variables, there was no need to subject this variable to a step-down analysis. Nevertheless, in order to minimise the noise in the data, the first MANCOVA for repeated measures reported below used SUS Score as dependent variable and User Error, Click Rate, and Time-On-Task as covariates.
The correlations between User Error and Click Rate on the one hand, and Time-On-Task on the other, indicate that the more errors the participants made, the more clicks and the more time they needed to complete the contact form. Thus, the question is whether or not inconsistency in the web page design had any effect on Click Rate and Time-On-Task over and above the effect of User Error. To investigate this, a step-down analysis was employed, where User Error, Click Rate, and Time-On-Task were entered in this order, corresponding to their theoretical importance. In all these analyses SUS Score was included as covariate to minimise the noise in the data. Thus the second MANCOVA reported below used User Error as dependent variable and SUS Score as covariate. The third MANCOVA used Click Rate as dependent variable and User Error and SUS Score as covariates. The forth MANCOVA used Time-On-Task as dependent variable and Click Rate, User Error and SUS Score as covariates.
Because there were correlations between the dependent variables, and that four separate MANCOVA were conducted, it was motivated to apply a Bonfer-roni correction to minimise the risks of committing Type I errors (Tabachnick & Fidell, 2007; see also Perneger, 1998). This resulted in the need for analysis of statistical significance at the 0.01 level (Equation 3.1).
Table 3.1: Pearson’s coefficient of correlations between dependent variables: SUS Score, User Error, Click Rate, and Time-On-Task.
SUS Score User Error Click Rate
User Error -.029
Click Rate .079 .187∗
Time-On-Task .016 .227∗ .026
∗
p < 0.05 (two-tailed).
Table 3.2: F-statistics of 2 (Perceptual inconsistency) × 2 (Semantic inconsistency) × 2 (Procedural inconsistency) repeated measures MANCOVA for SUS Score, User Error, Click Rate, and Time-On-Task.
Sus Scorea User Errorb Click Ratec Time-On-Taskd Factor F1,12 p F1,14 p F1,13 p F1,12 p PERceptual 4.51 0.055 0.11 0.744 0.88 0.364 10.28∗ 0.008 SEMantic 0.57 0.466 0.22 0.648 7.70 0.016 0.16 0.694 PROcedural 3.61 0.082 31.70∗ <0.001 2.20 0.162 1.27 0.282 PER*SEM 0.01 0.931 2.50 0.136 1.53 0.238 0.50 0.493 PER*PRO 1.40 0.260 0.21 0.651 6.59 0.023 0.04 0.843 SEM*PRO 5.28 0.040 0.03 0.875 0.05 0.829 0.96 0.347 PER*SEM*PRO 0.84 0.377 4.90 0.044 1.35 0.265 0.68 0.424 ∗ p < 0.01. a
SUS Score with User Error, Click Rate and Time-On-Task as covariates.
bUser Error with SUS Score as covariate. c
Click Rate with User Error and SUS Score as covariates.
d
3.3
User Satisfaction
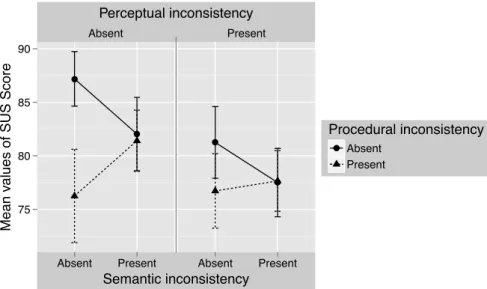
Figure 3.1 presents a factor plot for SUS Score, using the observed mean values, divided on the three independent variables: Perceptual, Semantic and Proced-ural inconsistency.
The plot indicates that SUS Score decreases when any of the three incon-sistencies are introduced alone. However, there is a tendency that Semantic inconsistency inhibits Procedural inconsistency, which creates an interaction ef-fect.
Table 3.2 presents F-statistics for the four individual MANCOVA analyses. The results for SUS Score confirm most of the tendencies indicated in the factor plot in Figure 3.1, particularly the interaction between Semantic and Procedural inconsistency. However, none of the effects are statistically significant at the 0.01 level. Absent Present 75 80 85 90
Absent Present Absent Present
Semantic inconsistency
Mean
values of SUS Score
Procedural inconsistency
Absent Present
Perceptual inconsistency
Figure 3.1: Observed mean values of SUS Score divided on the three factors Percep-tual, Semantic, and Procedural inconsistency. Each factor has two levels: absence or presence. Error bars represents standard errors of the mean values (± 1 SE).
3.4
User Error
Figure 3.2 presents a factor plot for User Error, using the observed mean frequencies, divided on the three independent variables: Perceptual, Semantic and Procedural inconsistency.
The plot indicates that User Error increases when Procedural inconsistency is introduced. The MANCOVA confirms this main effect, which is statistically significant at the 0.01 level (Table 3.2).
Perceptual and Semantic inconsistency shows little to no effect on User Er-ror when introduced alone. However, there is a tendency towards a complex three-way interaction effect between the three inconsistencies. Both Perceptual and Semantic inconsistency tends to inhibit the negative effect of Procedural inconsistency on User Error. On the other hand, Perceptual and Semantic incon-sistency also tends to cancel each other out. Thus, when all three inconsistencies are introduced together, Procedural inconsistency is as influential as when in-troduced alone. However, the three-way-interaction effect is not statistically significant at the 0.01 level (Table 3.2).
Absent Present 0.0 0.5 1.0 1.5 2.0 2.5 3.0
Absent Present Absent Present
Semantic inconsistency
Mean frequencies of User Error
Procedural inconsistency
Absent Present
Perceptual inconsistency
Figure 3.2: Observed mean frequencies of User Error divided on the three factors Per-ceptual, Semantic, and Procedural inconsistency. Each factor has two levels: absence or presence. Error bars represents standard errors of the mean frequencies (± 1 SE).
3.5
User Efficiency
3.5.1 Click Rate
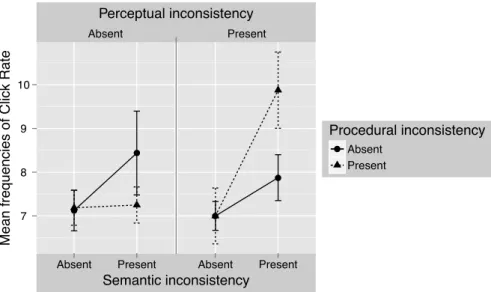
Figure 3.3 presents a factor plot for Click Rate, using the observed mean fre-quencies, divided on the three independent variables: Perceptual, Semantic and Procedural inconsistency.
The plot indicates that Click Rate increases when Semantic inconsistency is introduced. This tendency, although not statistically significant at the 0.01 level, is apparent in Table 3.2.
Neither Perceptual nor Procedural inconsistency has any effect on Click Rate alone but both separately tends to inhibit the negative effect of Semantic in-consistency on Click Rate. When combined they boost the effect of Semantic inconsistency, resulting in a peak value of Click Rate when all inconsistencies are present. However, both these effects disappear once User Error and SUS Score are controlled for as shown in Table 3.2. A tendency towards a two-way in-teraction effect between Perceptual and Procedural inconsistency also becomes evident once these factors are controlled for, which is not as clear in the observed means in the plot.
Absent Present
7 8 9 10
Absent Present Absent Present
Semantic inconsistency
Mean frequencies of Click Rate
Procedural inconsistency
Absent Present
Perceptual inconsistency
Figure 3.3: Observed mean frequencies of Click Rate divided on the three factors Per-ceptual, Semantic, and Procedural inconsistency. Each factor has two levels: absence or presence. Error bars represents standard errors of the mean frequencies (± 1 SE).
3.5.2 Time-On-Task
Figure 3.4 presents a factor plot for Time-On-Task, using the observed mean durations (s), divided on the three independent variables: Perceptual, Semantic and Procedural inconsistency.
The plot indicates that each of the three inconsistencies alone has an effect, resulting in an increase in Time-On-Task.
Semantic inconsistency tends to inhibit the effect of Procedural inconsist-ency, whereas Perceptual inconsistency only has a small effect on the other two inconsistencies. However, when all three inconsistencies are combined, the effect is cumulative and results in the longest completion time. Table 3.2 shows that after controlling for the effect of Click Rate, User Error and SUS Score only the main effect of Perceptual inconsistency reaches statistical significance at the 0.01 level. Absent Present 90 100 110 120 130
Absent Present Absent Present
Semantic inconsistency Mean du rations of Time−On− Task (s) Procedural inconsistency Absent Present Perceptual inconsistency
Figure 3.4: Observed mean durations of Time-On-Task divided on the three factors Perceptual, Semantic, and Procedural inconsistency. Each factor has two levels: ab-sence or preab-sence. Error bars represents standard errors of the mean durations (± 1 SE).
4
Discussion
The present experiment resulted in statistically significant main effects (p < 0.01) of both Perceptual and Procedural inconsistencies on user performance (i.e., User Error, Click Rate, or Time-On-Task). Procedural inconsistency res-ulted in more errors being made, whereas Perceptual inconsistency prolonged task completion time independently of the number of errors made (Table 3.2). Semantic inconsistency, on the other hand, tended to increase the number of clicks necessary to select a subject on the contact page (p= 0.016).
The inconsistencies in the contact form had only weak effects on the users’ satisfaction (i.e., SUS Score) of the web shop as a whole. The effects were not statistically significant (Table 3.2), and overall the users gave the web shop a high SUS Score (see Figure 3.1; according to Tullis & Albert, 2008, 80 is a fairly good score).
To our knowledge, the present study is the first in examining full factorial interaction effects of inconsistencies from a user’s perspective. A few interest-ing, and unexpected, interaction effects were indicated, even though none were statistically significant at the 0.01 level. Based on previous research, it was spec-ulated that any interaction effects should be cumulative. However, the present results indicate that Semantic, as well as, Perceptual inconsistency inhibited the effects caused by Procedural consistency. Semantic consistency tended to protect against the negative influence Procedural consistency had on user sat-isfaction, whilst both Semantic and Perceptual consistency tended to suppress the number of errors made in Procedural inconsistent versions of the web shop. That Perceptual inconsistency had negative impact on user performance coincide with the findings of Adamson (1996), Ozok and Salvendy (2000), and AlTaboli and Abou-Zeid (2007) on physical inconsistency. However, they found evidence that it increased errors made by users, whereas the present study found that it prolonged task completion time.
The results that Procedural inconsistency increased errors made by users agrees with the findings of Adamson (1996) with regard to communicational inconsistency.
Kellogg’s (1987) manipulation of conceptual consistency was close to the definition of Semantic consistency of the present thesis. Although the present study lacked statistically significant results for the effects of Semantic consist-ency, it did show tendencies to correspond with the findings of Kellogg (1987) that it may affect user performance.
4.1
Implications
The present experiment shows that graphical designers should avoid designing inconsistent procedures within web sites from a user’s point of view. Inconsist-ency in procedure may lead to users making more errors. To achieve proced-urally consistent web design, developers must analyse the procedures from the user’s perspective.
The present experiment also indicates that Semantic inconsistency may pro-tect against Procedural inconsistency’s negative impact on user satisfaction. This could be that once one changes the appearance or placement of an object, it indicates to the user that a different procedure is necessary. This potential in-teraction effect indicates that users may regard an object, which has more than
one inconsistency in relation to another object, as a completely new object, and therefore judge it differently.
An interesting result from the present experiment is that Perceptual incon-sistency affects Time-On-Task independently of the number of errors, and the number of clicks a user made. This suggests that the prolonged completion time was due to cognitive load of the inconsistency. This implies that change in visual appearance makes users think more about their actions.
Taken together, the results show that inconsistencies might be used to sig-nal change. However, designers should be sure to sigsig-nal this with perceivable changes in order to minimise the risks of errors being made.
4.2
Limitations
Apart from the two statistically significant main effects of Perceptual and Pro-cedural inconsistencies on user performance, some additional but weak effects were found. That only two effects were statistically significant at the 0.01 level may be due to at least three factors: (1) the experimental manipulation was faulty, (2) the experimental manipulation was to weak, or (3) the sample size was too small.
4.2.1 Faulty Manipulation
The definitions of the three categories of consistency proposed in Section 1.2.3, were strictly adhered to in designing the eight versions of the web shop (W1-8). Therefore there should be no question that the manipulation of Perceptual, Semantic, and Procedural inconsistency was true to the proposed definitions. 4.2.2 Weak Experimental Manipulation
As explained in Section 2.5.3, users evaluated their experience with the whole web shop. This is possibly the reason why there were no strong results on the effects of user satisfaction. More powerful inconsistencies might have to be introduced in order to affect user satisfaction when only a part of a web site is manipulated. Naturally, the evaluation could have been on just the contact form to achieve stronger results. However, as elaborated earlier, this could have had a priming effect on the participants in the experiment.
No significant results were found for Semantic consistency. It can be argued that the manipulation of Semantic consistency was too simple to affect on the user experience. The question arises whether the interchange of visual appear-ance (see Figure B.3) really made a semantic difference to the user. However, the effects on Click Rate are close to being statistically significant, with regard to Semantic inconsistency, and the notion that it affected user performance can therefore not be rejected.
4.2.3 Too Small Sample
The most probable cause for the few statistically significant effects is that too few participants were used. A couple of the values presented in Table 3.2 are
approaching statistical significance (i.e., Semantic inconsistency’s effect on Click Rate, and the two-way-interaction effect between Perceptual and Procedural consistency on Click Rate). This indicates that using a larger sample may yield stronger results.
4.3
Further Research
Computer science, and thereby user interface design, will likely keep on expand-ing into unknown territories. Studies on the impact of consistency can therefore help us predict, and counteract, future usability issues.
Previous research and the present experiment makes it evident that incon-sistency does affect user performance. It also shows that inconincon-sistency can have an effect on user satisfaction, although, the present study did not find statistic-ally significant evidence for this.
An in-depth analysis of the manipulations carried out in all studies on con-sistency within HCI could help to home in on the essence of concon-sistency. This could help to understand how these manipulations of consistency lead to such different results. One probable reason might be that there is another level to consistency than just categories. For example, it would be interesting to com-bine an experiment such as ours along with Norman’s (2001) seven stages of action (Figure 4.1), which suggests that a user goes through seven stages of action when interacting with, for instance, a web site. This would be a use-ful approach in order to see in what stage of interaction any of the proposed consistencies would affect user performance and satisfaction.
It would also be useful to carry out separate experiments on each of the three proposed consistencies and thereby test several different manipulations of each consistency.
4.4
Conclusions
1. Inconsistent web design results in more user errors being made and in longer task completion times.
2. Viewing the system from a user’s perspective aids developers and designers to build consistent web applications.
3. The results of the present thesis indicate that there are interaction ef-fects between different types of inconsistency, which needs to be further explored.
Acknowledgements
Special thanks go to Dr. Östen Axelsson, Department of Psychology, Stockholm University, for advices on research methods, statistics and scientific writing, as well as valuable comments on the text.
Special thanks also go to Mette Clausen-Bruun for proof reading and valu-able comments on the text.
Special thanks is also directed towards Dr. F. Layne Wallace, Department of Computer and Information Sciences, University of Northern Florida, for finding and forwarding a copy of Adamson (1996).
Special thanks also go to the 21 persons who volunteered to participate in the present experiment.
References
37signals. (2006). Getting real. Chicago, IL: 37signals.
Adamson, P. J. (1996). A comparison between consistent and inconsistent graph-ical user interfaces. Unpublished master’s thesis, University of Northern Florida.
AlTaboli, A. & Abou-Zeid, M. R. (2007). Effect of physical consistency of web interface design on users’ performance and satisfaction. In J. A. Jacko (Ed.), HCI’07 proceedings of the 12th international conference on human-computer interaction: applications and services (pp. 849–858). Berlin: Springer-Verlag.
Barnard, P. J., Hammond, N. V., Morton, J., Long, J. B. & Clark, I. A. (1981). Consistency and compatibility in human-computer dialogue. Applied Psy-chology , 15 , 87–134.
Barnett, S. M. & Ceci, S. J. (2002). When and where do we apply what we learn? a taxonomy for far transfer. Psychological Bulletin(128), 612–637. Blake, T. (1986). Introduction to the art and science of user interface design.
Chatsworth, CA: Intuitive Software and Interactive Systems.
Brooke, J. (1996). SUS: A quick and dirty usability scale. In P. W. Jordan, B. Thomas, B. A. Weerdmeester & I. L. McClelland (Eds.), Usability evaluation in industry (pp. 189–194). London, UK: Taylor Francis. Constantine, L. L. & Lockwood, L. A. D. (1999). Software for use: A practical
guide to the models and methods of usage-centered design. Reading, MA: ACM Press.
Encyclopedia Britannica. (2012). consistent. Retrieved July, 30, 2012, from: http://www.britannica.com/bps/dictionary?query=consistent.
Finch, W. H. (2007). Performance of the Roy-Bargmann stepdown procedure as a follow up to a significant MANOVA. Multiple Linear Regression Viewpoints, 33 (1), 12–22.
Foley, J. & van Dam, A. (1982). Fundamentals of interactive computer graphics. Reading, MA: Addison-Wesley.
Grudin, J. (1989). The case against user interface consistency. Communications of the ACM , 32 (10), 1164–1173.
Hurst, M. (2004). The page paradigm. Retrieved March, 20, 2012, from: http://goodexperience.com/2004/02/the-page-paradigm.php.
Kanizsa, G. (1979). Organization in vision: essays on gestalt perception. New York, NY: Barnes Noble.
Kellogg, W. A. (1987). Conceptual consistency in the user interface: effects on human performance. In H.-J. Bullinger & B. Shackel (Eds.), Human-computer interaction -INTERACT’87 (pp. 389–394). Amsterdam, Hol-land: North-Holland.
Kellogg, W. A. (1989). The dimensions of consistency. In J. Nielsen (Ed.), Coordinating user interfaces for consistency (pp. 9–20). San Fransico, CA: Morgan Kauffman Publishers.
Klein, G. (1999). Sources of power. Cambridge, MA: The MIT Press.
Mayhew, D. J. (1992). Principles and guidelines in software user interface design. Eaglewood Cliffs, NJ: Prentice Hall.
Mendel, J. & Pak, R. (2009). The effect of interface consistency and cognitive load on user performance in an information search task. Proceedings of the Human Factors and Ergonomics Society Annual Meeting, 53 (22), 1684–
1688.
Moran, T. P. (1981). The command language grammar: a representation for the user interface of interactive computer systems. International Journal of Man-Machine Studies, 15 , 2–50.
Nielsen, J. (1989). Coordinating user interfaces for consistency. ACM SIGCHI Bulletin, 20 (3), 15–16.
Norman, D. A. (2001). The design of everyday things. Cambridge, MA: MIT Press.
Ozok, A. A. & Salvendy, G. (2000). Measuring consistency of web page design and its effects on performance and satisfaction. Ergonomics, 43 (4), 443– 460.
Payne, S. J. & Green, T. R. G. (1986). Task-action grammars: A model of the mental representation of task languages. Human-computer interaction, 2 , 99–133.
Perneger, T. V. (1998). What’s wrong with bonferroni adjustments. British Medical Journal , 316 , 1236–1238.
Reisner, P. (1981). Formal grammar and human factors design of an interactive graphics system. IEEE Transactions on Software Engineering , SE-7 (2), 229–240.
Satzinger, J. W. (1998). The effects of conceptual consistency on the end user’s mental models of multiple applications. Journal of Organizational and End User Computing , 10 (3), 3–14.
Shermer, M. (2011). The believing brain. New York, NY: Times Books. Shneiderman, B. (1992). Designing the user interface: Strategies for effective
human-computer interaction (2nd ed.). Reading, MA: Addison-Wesley Publishing Company, Inc.
Smith, D. C., Irby, C., Kimball, R., Verplank, W. L. & Harslem, E. (1982). Designing the star user interface. Byte, 4 , 242–282.
Somberg, B. L. (2000). Procedural consistency in the user interface. Proceedings of the Human Factors and Ergonomics Society Annual Meeting , 44 (2), 307–310.
Tabachnick, B. G. & Fidell, L. S. (2007). Using multivariate statistics (5th ed.). Boston, MA: Pearson Education Inc.
Tanaka, T., Eberts, R. E. & Salvendy, G. (1991). Consistency of human-computer interface design: Quantification and validation. Human Factors: The Journal , 33 (6), 653–676.
The Free Dictionary. (2012). consistent. Retrieved March, 19, 2012, from: http://www.thefreedictionary.com/consistent.
Tullis, T. & Albert, B. (2008). Measuring the user experience. Burlington, MA: Morgan Kauffman Publishers.
Wiecha, C., Bennett, W., Boies, S. & Gould, J. (1990). ITS: a tool for rapidly developing interactive applications. ACM Transactions on Information Systems, 8 (3), 204–236.
Wolf, R. (1989). Consistency as process. In J. Nielsen (Ed.), Coordinating user interfaces for consistency (pp. 89–92). San Fransico, CA: Morgan Kauffman Publishers.
A
Baseline Choice Selections
Figure A.1: Newsletter choice at customer registration.
B
Variations of Inconsistency in Subject System
Figure B.1: Choice selection fully consistent with the baseline newsletter and expiry date selections (W1).
Figure B.2: Perceptually inconsistent choice selection (W2).
Figure B.4: Procedurally inconsistent choice selection (W4).
Figure B.5: Perceptually and Semantically inconsistent choice selection (W5).
Figure B.6: Semantically and Procedurally inconsistent choice selection (W6).
Figure B.8: Perceptually, Semantically, and Procedurally inconsistent choice selection (W8).
Teknik och Samh¨alle Datavetenskap
Experiment i anv¨andbarhet
CBG: 0
ID: 123456782
Anton Axelsson m09p0891@student.mah.seIntroduktion
Detta ¨ar ett experiment om anv¨andbarhet p˚a webben. Syftet ¨ar att testa en webbapplikations funktionalitet i ˚atta olika utformningar. Din uppgift ¨ar att hj¨alpa ˚atta personer att inhandla produkter fr˚an f¨oretaget Web-shoppen, samt hj¨alpa dem kontakta Webshoppen via webbsidans kontak-tformul¨ar.
Detta kompendium best˚ar av ett f¨ors¨attsblad, denna introduktion, samt ˚atta uppgiftssidor med den information, samt de instruktioner du beh¨over
f¨or att genomf¨ora experimentet.
Varje uppgift (1-8) best˚ar av f¨oljande delmoment och skall utf¨oras i an-given ordning:
1. Hitta och l¨agga de 3 angivna produkterna i varukorgen (observera att s¨okfunktionen f¨or produkter ¨ar avst¨angd).
2. Registrera konto via kassan med • angivna kontaktuppgifter. • angivet ¨onskat nyhetsbrev. • angivet ¨onskat l¨osenord.
3. Ange kortuppgifterna och slutf¨or k¨opet.
4. Skicka meddelande till Webshoppen med angiven f¨orfr˚agan via webb-platsens kontaktformul¨ar.
N¨ar meddelandet har skickats kommer du att omdirigeras till en sida d¨ar du ombeds utv¨ardera din upplevelse av den senast anv¨anda webbapplika-tionen. N¨ar du sparat dina svar kommer du att omdirigeras till Webshop-pen igen och du p˚ab¨orjar d˚a uppgiften p˚a n¨asta blad.
N¨ar du genomf¨ort samtliga ˚atta uppgifter ber vi dig kalla p˚a experimen-tledaren som kommer att ge dig ett medgivandeformul¨ar f¨or din under-skrift.
Speciellt viktigt att komma ih˚ag under experimentet ¨ar:
• Den tid du tar p˚a dig samt de fel du g¨or kommer att m¨atas. D¨arf¨or ¨ar det viktigt att du h˚aller dig till uppgiften och f¨ors¨oker utf¨ora de ˚atta uppgifterna s˚a fort du kan men med s˚a f˚a fel som m¨ojligt. • Inga m¨atningar g¨ors under utv¨arderingarna mellan uppgifterna, du
har d˚a m¨ojlighet att ta en paus om du s˚a ¨onskar.
• Vissa uppgifter kan upplevas vara sv˚ara, men de g˚ar att l¨osa s˚atappa inte modet.
• Detta ¨ar INTE ett test av dig och dina kunskaper eller f¨aridgheter, utan ett test av hur v¨al de olika utformningarna av webbapplikation fungerar.
Om tekniska problem uppst˚ar eller om du undrar ¨over n˚agot s˚a kontakta experimentledaren. N¨ar du k¨anner dig redo kan du p˚ab¨orja experimentet genom att ange ditt niosiffriga ID. Ditt ID finner du p˚a f¨ors¨attsbladet. Ex-perimentet b¨orjar med ett mindre fr˚ageformul¨ar d¨ar du anger f¨odelse˚ar, k¨on och datorvana.
Uppgift 1
Kontaktuppgifter
Alfred G¨oransson
Tallgatan 11 C
523 35 ULRICEHAMN
alfred.goransson@skatteverket.se
073 - 159 595 55
¨Onskat l¨osenord: letmein
Kortuppgifter
Korttyp:
MasterCard
Kortnummer:
5454 9963 1215 9875
Giltigt tom:
09 / 2012
S¨akerhetskod: 951
Instruktioner
Genomf¨or k¨op
Alfred ber dig k¨opa f¨oljande produkter:
• Boken ’Version Control with Git: Powerful Techniques for Certralized and Distributed Project Management’ (Data & IT)
• Filmen ’The Big Lebowski - Special Edition’ (Komedi) • CD-skivan ’Free The Bees’ (Alternativt & Indie)
Nyhetsbrev
Alfred vill ha nyheter g¨allande alla produkter.
Skicka kontaktmeddelande
Efter att du genomf¨ort k¨opet vill Alfred att du kontaktar Webshoppen f¨or att ber¨omma dem f¨or snabb leverans, men inte f¨or n˚agon s¨arskild produkt. G˚a till kontaktsidan och fyll i formul¨aret. Ange f¨oljande meddelande:
Jag fattar inte hur ni lyckas! Jag best¨allde mina produkter ig˚ar och idag ¨ar de redan h¨ar. M˚aste s¨aga att ni g¨or ett fantastiskt jobb. Keep up the good work!
Uppgift 2
Kontaktuppgifter
Lisa St˚ahlski¨old
Expressv¨agen 55
168 53 BROMMA
lisa stahlis@hotmail.com
070 - 961 963 91
¨Onskat l¨osenord: tellno1
Kortuppgifter
Korttyp:
VISA
Kortnummer:
4646 8366 9991 0105
Giltigt tom:
01 / 2013
S¨akerhetskod: 883
Instruktioner
Genomf¨or k¨op
Lisa ber dig k¨opa f¨oljande produkter:
• Filmen ’Eyes Wide Shut’ (Thriller & Skr¨ack) • CD-skivan ’We Sweat Blood’ (Rock)
• CD-skivan ’Cosmo’s Factory’ (Rock)
Nyhetsbrev
Lisa vill ha samtliga nyhetsbrev g¨allande musik.
Skicka kontaktmeddelande
Efter att du genomf¨ort k¨opet vill Lisa att du kontaktar Webshoppen f¨or att kontrollera status p˚a en musikorder hon lagt tidigare i ˚ar. G˚a till kontaktsidan och fyll i formul¨aret. Ange f¨oljande meddelande:
F¨or drygt en m˚anad sedan lade jag en order (nummer 9152138) hos er p˚a fler-talet CD-skivor, vissa skivor var d˚a sluts˚alda. N¨ar kan jag f¨orv¨antas f˚a denna order?
Uppgift 3
Kontaktuppgifter
Eva Strandsj¨o
Storgatan 114
214 22 MALM¨O
eva@live4film.se
070 - 193 124 25
¨Onskat l¨osenord: password12
Kortuppgifter
Korttyp:
MasterCard
Kortnummer:
5655 9984 1211 3754
Giltigt tom:
12 / 2016
S¨akerhetskod: 112
Instruktioner
Genomf¨or k¨op
Eva ber dig k¨opa f¨oljande produkter: • Boken ’Truth’ (Filosofi)
• Filmen ’Inception’ (Action & ¨Aventyr)
• Filmen ’Scarface (Blu-ray)’ (Action & ¨Aventyr)
Nyhetsbrev
Eva vill ha erbjudanden g¨allande filmer.
Skicka kontaktmeddelande
Efter att du genomf¨ort k¨opet vill Eva att du kontaktar Webshoppen f¨or att beg¨ara en retur av tidigare best¨allda filmer som hon ˚angrar att hon k¨opt. G˚a till kontaktsidan och fyll i formul¨aret. Ange f¨oljande meddelande:
Hej, idag fick jag en leverans av filmer fr˚an ett k¨op som jag inte trodde hade g˚att igenom, d¨arf¨or har jag redan inhandlat dem p˚a annat s¨att. Hur g¨or jag nu?
Uppgift 4
Kontaktuppgifter
Abir Sahlir
Bj¨orkgatan 13 D
571 95 N¨ASSJ¨O
abir.sahlir@help-it.se
070 - 987 537 12
¨Onskat l¨osenord: 789secret
Kortuppgifter
Korttyp:
VISA
Kortnummer:
4041 4456 1441 3451
Giltigt tom:
08 / 2013
S¨akerhetskod: 415
Instruktioner
Genomf¨or k¨op
Abir ber dig k¨opa f¨oljande produkter: • Boken ’Design Patterns’ (Data & IT) • Boken ’Information Retrieval’ (Data & IT) • Filmen ’Taxi’ (Action & ¨Aventyr)
Nyhetsbrev
Abir vill ha erbjudanden g¨allande b¨ocker.
Skicka kontaktmeddelande
Efter att du genomf¨ort k¨opet vill Abir att du kontaktar Webshoppen f¨or att klaga p˚a produktavdelningen f¨or deras begr¨ansade utbud p˚a b¨ocker. G˚a till kontaktsidan och fyll i formul¨aret. Ange f¨oljande meddelande:
Jag har flertalet g˚anger kontaktat er i detta ¨arende och jag f˚ar aldrig n˚agot ordentligt svar p˚a varf¨or ni aldrig kan ta in n˚agra vettiga b¨ocker om HTML5!