This is the published version of a paper published in .
Citation for the original published paper (version of record):
Adane, T F., Bianchi, M F., Archenti, A., Nicolescu, M. (2015)
Performance evaluation of machining strategy for engine-block manufacturing
Performance evaluation of machining strategy for engine-block manufacturing,
15(4): 81-102
Access to the published version may require subscription. N.B. When citing this work, cite the original published paper.
Permanent link to this version:
Received: 24 September 2015 / Accepted: 13 October 2015 / Published online: 10 November 2015
process modelling, machining strategies, engine-block manufacturing, dynamic modelling Adane F. TIGIST 1* Maria F. BIANCHI1 Andreas ARCHENTI1 Mihai NICOLESCU1
PERFORMANCE EVALUATION OF MACHINING STRATEGY FOR ENGINE-BLOCK MANUFACTURING
This paper will introduce a novel methodology for the performance evaluation of machining strategies of engine-block manufacturing. The manufacturing of engine components is vital to the automotive and vehicle manufacturing industries. Machining are a critical processes in the production of these parts. To survive and excel in the competitive manufacturing environment, companies need to improve as well as update their machining processes and evaluate the performance of their machining lines. Moreover, the lines and processes have to be robust in handling different sources of variation over time that include such examples as demand fluctuations, work-piece materials or even any changes in design specifications. A system dynamics modelling and simulation approach has been deployed to develop a methodology that captures how machining system parameters from the machining process are interacted with each other, how these connections drive performance and how new targets affect process and machine tool parameters through time. The developed model could provide an insight of how to select the crucial machining system parameters and to identify the effect of those parameters on the output of the system. In response to such an analysis, this paper provides (offers) a framework to examine machining strategies and has presented model that is useful as a decision support system for the evaluation and selection of machining strategies. Here a system dynamics methodology for modelling is applied to the milling operation and the model is based on an actual case study from the engine-block manufacturing industry.
1. INTRODUCTION
Nowadays, the automotive industry faces a complex and highly competitive environment. In this sector, the precision manufacturing of engine components, such as cylinder-heads and cylinder-blocks, is vital. These parts have very tight design specifications, which requiring high geometrical accuracy and surface finishing [14]. Manufacturing systems used for the production of these components have to deliver high performance in terms of e.g. productivity and cost.
This is particularly relevant in conjunction to the lean paradigm for contributing to enhance performance targets and the concept of mass customization implies the need ________________________
1 KTH Royal Institute of Technology, Department of Production Engineering, Stockholm, Sweden * E-mail: tigist@kth.se
of a larger number of product variants and hence increased flexibility in production [13],[26]. Furthermore, advanced research in new materials is carried out aiming to improve a component’s physical properties. High flexibility of the manufacturing systems is the main source of variation in the component manufacturing. For example, the change in the part machinability due to new materials, new design specifications for finished parts and variation in customer demand.
In [12] the description of the general functions of manufacturing performance evaluation includes: controlling and monitoring operational efficiency, an evaluation of the current and future state of the manufacturing situation and effective decision making. From this context and in order to fulfil such quality requirements for machining operations, there are vital steps in the production of these parts that have to be selected accurately and process parameters must be optimized. Also here, it is essential to choose machine tools that can deliver optimal productivity and cost performance.
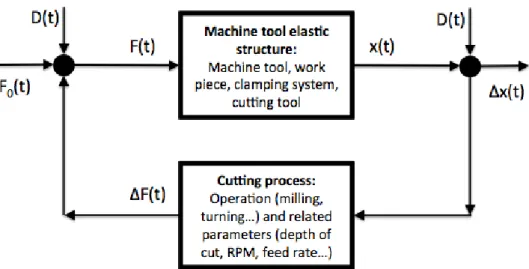
A machining system can be represented by a closed-loop system comprising a machine tool elastic structure and a cutting process, as shown in Fig. 1. These two elements are interrelated and interacted with each other. The machine tool elastic structure includes machine tool, cutting tool, workpiece, and work holding fixture (clamping system) whereby the cutting process is defined by the parameters such as cutting parameters (depth of cut, feed rate, cutting speed, spindle speed, etc.), tool material, cutting operation (milling, turning, drilling, etc.) and cutting tool geometry.
Fig. 1. Machining system represented and described as a closed loop system
During manufacturing operations, machine tools and cutting processes are constantly interacting with one another to produce the desired part features [4],[5] and to achieve the intended performance criteria. Therefore, it is appropriate to discuss the interaction between the two subsystems of the machining system, machine tool mechanical structure and the cutting process [19] and the chosen performance criteria. As a consequence, the quality of the machined parts is determined by the performance of the machining system rather than simply being a separate contribution in the machine tooling or process.
The chosen machining system performance indicators can then be defined as [8]: The machining and process capability is the capacity of the machining system to
produce components that meet the design specifications.
The productivity of the machining system is determined by the number of parts the machine tool, within certain process condition range, is able to produce in a given period of time and by the effects determined by control decisions used to manage the machining system that influence productivity, e.g. downtime or scrap rate.
The cost for operation of the machining system, which does include all the costs directly or indirectly derived from all the decisions used to control the machining system.
The manufacturing of a component is always carried out as a sequence of operations where the raw material is progressively converted into finished parts. The final and intermediate part properties are the result of the aggregate contribution of the previous individual processing steps participating in the creation of a specific feature. As a consequence, a manufacturing system is organized as a chain of several interconnected machining system units while the performance of the whole chain is determined by the performance of each machining system unit and their combination.
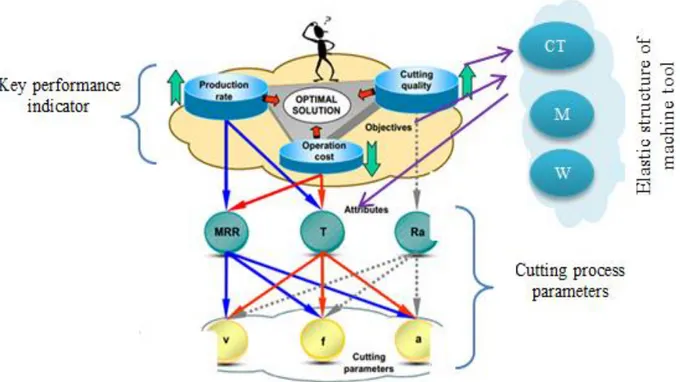
Here it is necessary to consider both the machining system and its performance indicators to make decisions that will lead to the optimal solution. Thus, an adequate set of decisions needs to be implied to both design and implementation of an appropriate machining strategy. Machining strategies can be referred as the machining system procedures (conditions) determined by all the decisions taken with the objective of optimizing the machining system with respect to pre-selected performance criteria and related targets. This concept is further explained in Fig. 2.
Nevertheless, in current practice there is no defined machining strategies evaluation technique available that takes into account the holistic view of the machining system behaviour and its performance. This paper addresses this gap by providing a framework to establish machining strategies, with a holistic approach that considers machine tool, machining process and machining system performance. Also, a decision support method for the evaluation of machining strategies in the context of a face milling for a cylinder-block is proposed. The chosen modelling methodology is implemented in system dynamics simulation and modelling of the environment.
The objectives of this paper are:
To develop a simulation model for the evaluation of machining strategies that considers machining system parameters, the performance criteria chosen and their interaction
To validate the system dynamics as a simulation tool of the machining system
This paper constitutes six sections including introduction. The second section describes the approach on manufacturing process modelling and the expected outcome from the model. In section 3 the proposed methodology, system dynamics, is described. Section 4, explicitly describes the case study conducted. Section 5 briefly explains the result obtained from the case study and also presents the policy proposed for the evaluation of machining strategy. Finally section 6, concludes and recommends the work presented in this paper.
2. MANUFACTURING PROCESSES MODELLING
Currently there are several methods available to analyse machining strategies and to evaluate performance in manufacturing lines. Many companies have been using simulation as an aid in their evaluation and decision making process. Simulation of the manufacturing system can be carried out with discrete event simulation or continuous state simulation. Discrete event simulation is one of the most used methodologies to reproduce the flow of material in a line, to evaluate its effectiveness and to measure cost and productivity performance [1]. For quality performance and designing machining strategies companies usually use analytical methods, statistical methods and simulation using CAM and CAPP or FEM.
Kibara et al. [15] state that typically DES is done to address a particular set of problems, and it does some “what if” analyses. It focuses on streamlining and validating processes, reducing costs, and meeting schedules; not the identification and evaluation of environmentally friendly alternatives [23]. Therefore, it seldom addresses sustainability issues in manufacturing. Unlike DES, SD is often used for strategic and policy related applications [10]. This is because of the high abstraction level of the models and the longer simulation time horizon used to reveal the dynamic behaviour [17],[18],[25]. A SD is useful in illustrating how the actual system behaves and to understand the consequence if some of the parameter in the model that will be changed over a period of time. Varying the value of parameter in SD does not mean considering only one factor at a time nor does it mean changing one parameter and freezing the other ones. Since a change in one would results in
other parameter levels and a change in the output of the system since the parameters are already linked and interrelated.
Tako and Robinson [24] summarised the literature that has been completed regarding the comparison of DES and SD modelling in Table 1 [1].
Table 1. Comparison between SD and DES modelling [1]
Author(s) Aspect compared SD DES
Sweetser (1999), and Lane (2000)
Nature of problems
modelled Strategic Tactical/operational.
Coyle (1985), Sweetser (1999), and Brailsford and Hilton (2001)
Feedback effects Models causal relationships and feedback effects.
Models open loop
structures-less interested in feedback
Baines et al. (1998) and Lane
(2000) System representation Holistic view Analytic view
Lane (2000) Complexity Wider focus, general and
abstract systems
Narrow focus with
great complexity and detail
Sweetser (1999) and
Brailsford and Hilton (2001) Data inputs
Quantitative and qualitative, use of anecdotal data
Quantitative based on concrete processes
Meadows (1980) and Mak
(1993) Model results
Provides a full picture (qualitative and quantitative) of system performance
Provides statistically valid estimates of system performance
A number of studies have investigated the optimization of machining parameters when considering the constraint to produce within the intended performance criteria such as, quality of parts, productivity and cost [2],[3],[21]. Evaluation of manufacturing performance by considering the entire machining system implies taking into account several process parameters, machine tool variables and performance indicators. Furthermore it is necessary to understand just how these systems evolve over time and will predict the feasibility of different solutions that have a positive long-term effect to achieve high machining system performance.
By taking into account the nature of the problems modelled using SD and the features of the system comprising the machining system and its performance indicators, SD has been chosen as a suitable methodology.
3. SYSTEM DYNAMICS (SD)
System Dynamics (SD) SD is a powerful methodology and computer simulation modelling technique for framing, understanding, and discussing complex issues and problems. It is a methodological approach used in order to design effective policies for management of complex system [23]. It was originally developed in the mid-1950s by
Professor Jay W. Forrester at the Massachusetts Institute of Technology to help corporate managers improve their understanding of industrial processes [11].
System thinking is a method to study complex systems as a whole rather than breaking the system down into smaller problem areas [6],[7]. This allows for better understanding of the system structure and is able to detect the causal relationships among the variables. These non-linear relationships usually form intricate feedback loops with accumulation processes.
As has been clearly stated from numerous authors is that the manufacturing system is a complex system comprises of different entities [16],[20],[22]. SD uses this system thinking approach to model and simulate the behaviour of complex, dynamic systems with the aid of computer programming [9]. Dynamic systems and processes are customarily very difficult to be analysed because: (1) they are characterized by non-linear causal relationships that usually form internal feedback loops with accumulation processes (2) relationships between process variables are affected by time delays. This implies that, if a change in the process arises, its effect will be delayed in time, thus making it more difficult to understand the causes behind such system behaviour. In addition, not only the number of process variables to be studied is greater as well as often being of a different nature ― some will be qualitative and others will be quantitative.
To model these systems, SD used two different support tools: Causal Loop Diagrams (CLDs) and Stock and Flow diagrams (S&F). CLD shows the causal relationships of the main variables of the system and the main feedbacks that determine its behaviour. S&F will help to study these systems since it allows to model feedback loops, accumulation processes, time delays and different types of variables. It also does permit an understanding of how the system structure will influence its behaviour.
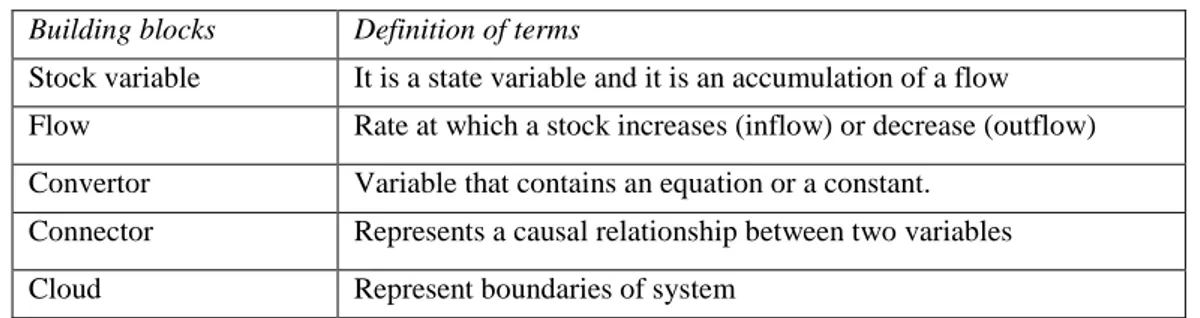
S&F uses building blocks to represent the main variables and relationships and uses numerical equations to represent the quantitative and qualitative relationship. The main building blocks used in this modelling process along with their own definition are shown in Table 2. The general structure of the modelling of a stock and flow diagram is illustrated in Fig. 3.
Table 2. Main building blocks of SD and its definition
Building blocks Definition of terms
Stock variable It is a state variable and it is an accumulation of a flow Flow Rate at which a stock increases (inflow) or decrease (outflow)
Convertor Variable that contains an equation or a constant. Connector Represents a causal relationship between two variables
Cloud Represent boundaries of system
The mathematical relationship between a stock and a flow is the following: 𝑆𝑡𝑜𝑐𝑘(𝑡) = ∫ [𝐼𝑛𝑓𝑙𝑜𝑤(𝑠) − 𝑂𝑢𝑡𝑓𝑙𝑜𝑤(𝑠)]𝑑𝑠 + 𝑆𝑡𝑜𝑐𝑘(𝑡0),
𝑡 𝑡0
between the initial time to and current time t respectively.
Fig. 2. General structure of stock and flow diagram
SD modelling technique also allows one to explicate and evaluate different policies, as the decisions to improve system behaviour will come from changing its structure [23]. It permits a test procedure to see if a policy will give the expected results or not and which possible decisions could actually improve the system behaviour.
3.1. BENEFITS OF SYSTEM DYNAMIC MODELLING
The system dynamics model helps:
To analyse the feasibility at early stage, e.g. avoiding the decisions that will bring unexpected outcomes in the future – the analysis is done based on the historical data from the company
To take strategy decision
To find out the relationships between critical parameters
To develop a predictive capability of machining performance in order to facilitate effective planning of machining operations to achieve optimum productivity, quality, cost, etc.
3.2. RESEARCH METHOD
The approach followed to conduct this case study and to collect data for input to the SD modelling and simulation includes:
Understanding of the current applied methodology
Describe the problem with the current methodology gap of the company: - identify, define the problem and understand the process, understand the current available methodology gap.
The company production line of machining process is studied for both flexible and transfer lines: - the stations in each production line is identified and studied thoroughly, the critical machines are chosen followed by identification of critical features, operations and machining system parameters etc.
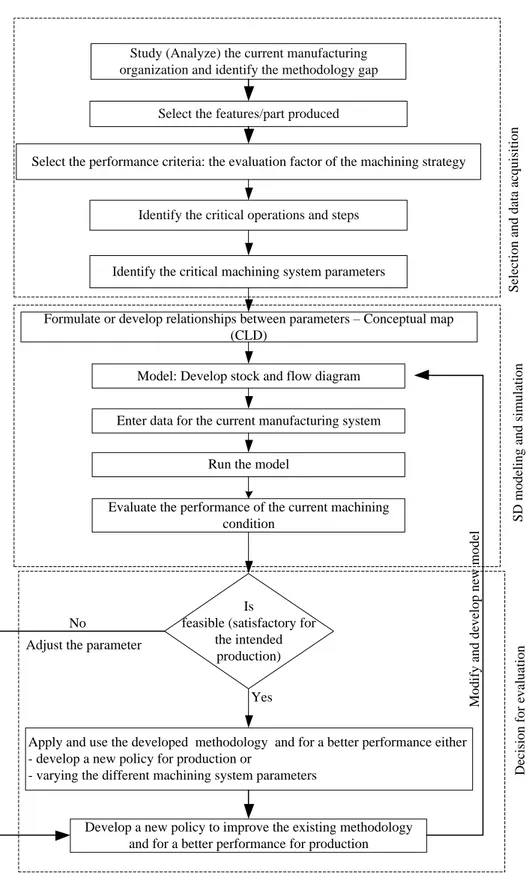
Study (Analyze) the current manufacturing organization and identify the methodology gap
Select the performance criteria: the evaluation factor of the machining strategy
Identify the critical operations and steps
Identify the critical machining system parameters
Formulate or develop relationships between parameters – Conceptual map (CLD)
Model: Develop stock and flow diagram
Enter data for the current manufacturing system
Run the model
Is
feasible (satisfactory for the intended
production)
Apply and use the developed methodology and for a better performance either - develop a new policy for production or
- varying the different machining system parameters
Develop a new policy to improve the existing methodology and for a better performance for production
Yes No
Adjust the parameter
S el ec ti o n a n d d at a ac q u is it io n S D m o d el in g a n d s im u la ti o n D ec is io n f o r ev al u at io n
Select the features/part produced
Evaluate the performance of the current machining condition M o d if y a n d d ev el o p n ew m o d el
The performance parameters used for decision criteria are selected
Questionnaires are distributed:- some of the questionnaires includes historical data and information on different machining system parameters value, capability of the machine tool, total production time, maintenance activity conducted, throughput for production time, production volume, different maintenance activities, etc.
Interviews are made and discussion with the respected expertise, experienced operator, historical data and ideas from experience are collected
Some data are directly measured during production:- some of the data measured are cutting time, set up time, idle time, tool changing time, takt time
Finally, all information incorporated during study of the machining process has been organized and used in analysing model result for the machining process of each machine tool type.
In summary the step-by-step approach for the performance evaluation of the flexible machine tool machining strategy is shown in Fig. 4. The structure followed for modelling of the cases studies conducted in this paper is shown in Fig. 5.
Comprehend the structure of the system Derive the dynamics of the system structure Model and simulate the system
Design policy and strategy recommendations
Fig. 4. Approach for building the SD model of the given machining process
4. CASE STUDY
As a case study, one truck manufacturing company that produces cylinder-block with two machining process line is to be examined. The company manufactures different variants of cylinder-blocks. The variant object of this case study is produced in grey iron, and is a straight cylinder-block with six cylinders. It is manufactured in two autonomous lines a transfer line and a flexible machining line. Currently, the company does not have a defined method to evaluate the machining system strategies, to study its machining system, its performance and how the machining system parameters and key performance variables are interrelated with one another.
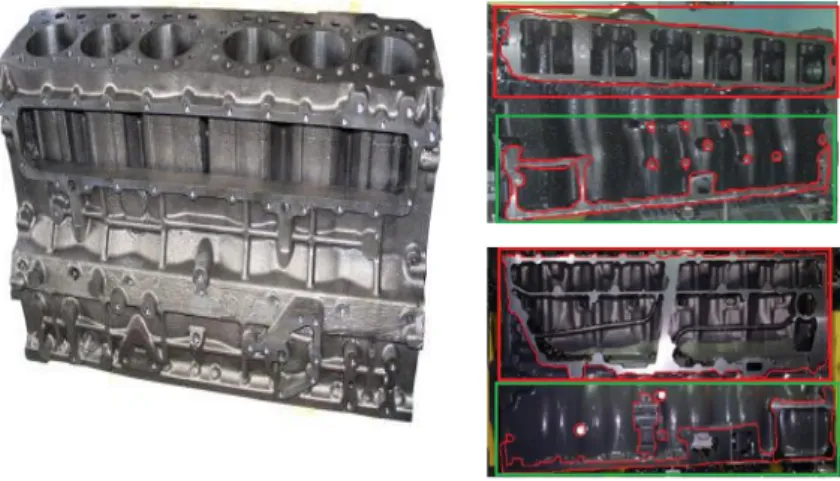
This case study aims to develop a method to evaluate the performance of the machining system of flexible/multi-purpose machine tool in terms of the chosen performance criteria. In this paper the face milling of the lateral sides of the cylinder-block is the main consideration of this model. Each side has two features that are machined in two steps: roughing and finishing. The dimension of the milling cutter (inserts) for roughing and
finishing operation is provided in the model. The schematic of cylinder block and the sides machined are shown in Fig. 5.
Fig. 5. Left: Cylinder block, Right: The lateral features of parts machined
In addition, it is of importance to analyse how the intricate interactions between the different machining system’s parameters will affect machining system behaviour.
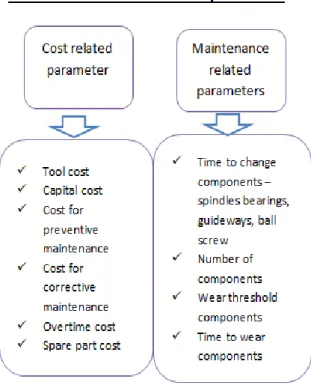
The main parameters included in this paper comprise the following classes or categories and also shown in Fig. 7:
Machining system parameters - cutting process parameters (feed rate, RPM, Cutting speed, etc) are considered as variable parameters, while the machine tool elastic structure parameters are considered as fixed;
Fig. 6. Some of the parameters used in the model
Operational parameters - cycle time, backlog, throughput rate, uptime, downtime, capacity, etc.;
Cost related parameters - tool cost, capital cost, spare part cost, cost for corrective and preventive maintenance;
Maintenance related parameters - number and type of main machine tool components, time to change worn out components, wear threshold and time to wear components.;
Others - some variables are considered as input to the system such as order rate, number of machines, the time dedicated to preventive maintenance, etc. The takt time is considered as an input only in one scenario that is accounted for this model which will be explained later on.
4.1. PERFORMANCE INDICATOR
The key performance indicators selected and the framework for this case study are depicted in Fig. 8. Productivity, cost and quality are the main performance criteria chosen in this paper.
The figure explicitly describes the main aspects considered and highlighted the delimitations. The order rate (that is the demand of the part from customers) is taken as an input and based on the demand the machining system is organized to produce the desired throughput. The throughput (production rate) is the total quantity of parts to be produced with the given period of time. The machining system is designed to fulfil the quality
requirements of the part and hence the quality depends on the machining system’s capability. In turn, the machining system set up is influenced by the quality requirements. The machining system capability with the desired quality will provide the required productivity performance. Actual cost is an output dependent on productivity and quality results.
Fig. 7. Framework for the case study considered in this paper
The analysis considers the outcomes in terms of the key performance criteria: cost and productivity. Since quality is an essential requirement it is set as a constraint to the model parameters. This means that when optimization is required the variation of the parameters should be within the limit of the design specification in order to produce the quality requirement of the part.
4.2. MACHINE TOOL ELEMENTS AND MACHINING STEPS
A machine tool structure consists of different mechanical elements that may have different performances and costs. The crucial machine tool elements in terms of machine system capability considered in this paper are spindle (with ball screw and ball bearings), ball screw and linear guide-ways which constitutes 1, 3, and 3 number of components per each machine tool respectively.
Machining steps for face milling of the sides of the cylinder block passes through rough milling and finish milling of each feature separately.
4.3. CAUSAL LOOP DIAGRAM
Fig. 9 shows the causal interaction and influence between the main machining system parameters and related parameters. The + and - signs in the figure are representing the relationships between respective connected parameters either they have direct or inverse proportionality, respectively. For instance, this is shown when one considers the loop between takt time and total production time. An increase in total production time than the current time leads to an increase in takt time. The increase in takt time will in turn increase production time which closes the loop (called balancing loop).
Fig. 8. Causal loop diagram of the flexible machine tool model
4.4. STOCK AND FLOW DIAGRAM
A stock and flow model for base scenario and policy analysis has been created using the SD modelling environment.
Scenario 1- Model for Base Scenario
The base scenario shows the structure of the current machining condition of the actual system. The system modelled with this scenario includes machining system parameters, key performance indicators and all related parameters. The structure of the model is based on machining process of the four features that produce within a pre-set takt time. Hence, there will be a delivery of an output at every takt time value at the end of the machining line for achieving the required productivity level. In this specific case, the production time is adjusted to meet the demand variation: if the demand grows the machine will produce for longer time, if the demand drops the machine will be used for shorter time.
For this scenario, there is no feedback loop that limits the reduction of cost in the system structure. Therefore, in order to improve cost without compromising quality and productivity a new policy analysis is to be proposed.
Scenario 2- Model for policy analysis
A policy design is a proposed methodology for the company by changing the current strategies on how decisions that regulate machining process are made, by changing parameters and modifying the existing structure of feedback loops. In this paper a policy with one scenario is developed and described that has aimed at improving the system behaviour.
As it has been explained in the aforementioned base scenario, the current situation is targeted to achieve the fixed takt time regardless of the order rate. However, in the proposed policy if there is variation of demand in the system the takt time is varied rather than being kept constant. The decrease in order rate than usual will increase the cost per part and hence there is no feedback loop in the model of the current situation that reduces it. Therefore, to alleviate this situation it is required to develop a policy that changes the existing machining strategy.
5. RESULT AND DISCUSSION
The stock and flow diagram allows for the modelling the system structure and to simulate and analyse its own consequential behaviour. The parameters relationships are inserted in the model as formulas or as graphical function. During this section, the simulation results for the base scenario and proposed policy models are analysed with the specification (condition) shown in Table 3. The schematic representation of the scenarios considered and the variation of the parameters are shown in Fig. 10. The order rate (demand) varies between the interval of 2000 – 5000 pieces/month as a function of time that varies between 0 and 180 months. Here the green bar in this figure shows the parameters are variable and active in the (during) simulation.
Results are obtained from initialising the simulation model variables and running the simulation with given process input/output data from the company. Except demand (order rate) which is considered as a source of variation in the process, since sample order rates are taken to simulate the system behaviour. The model in both scenarios is run with an increase and decrease in demand that vary between 2000 and 5000 pieces per month.
Table 3. The scenarios considered in the analysis
Fig. 9. Graphical representation of demand (order rate) variation for actual situation and policy analysis
The simulation is run for 180 months, considering the machining systems have been capitalized over the lifespan of the systems which is estimated to be 15 years.
Scenario 1- Actual situation
Considering both demand cases (case 1a and case 1b), with two different trends varying between 2000 and 5000 pieces per month, having a fixed takt time and therefore fixed cutting parameters, Fig. 11 illustrates how the demand could be fulfilled within the given range.
Through an increase in demand (as in case 1a) there is a reduction in cost per part, while an opposite situation is verified with a decreasing demand (case 1b). In fact, even though the desired production rate to fulfil the orders is reached and the overtime cost is insignificant, the other sources of costs are not reduced and the number of parts produced monthly decreased.
Here it is worthwhile to point out that the peaks showing drops of productivity in Fig. 11 are not straight lines as the highlighted image shows; since SD did not model discrete events simulation for this modelling. The peaks were due to the fault components replacements are also simulated in the model. Certainly, while the corrective maintenance or component overhaul is on-going, the throughput will be dropped and the cost for spare parts
Scenario Case Demand
(piece/month)
Takt time (min)
Total production time (min) Actual situation Case 1a Case 1b Increasing: 2000-5000 Decreasing: 5000-2000 Fixed Fixed Variable Variable Policy analysis Case 2a Increasing: 2000-5000 Variable Fixed
Case 2b Decreasing: 5000-2000 Variable fixed
Case 1a Case 1b
and for maintenance will be very high. As a consequence, the throughput rate (pcs/month) will tend to zero and the cost per part amount will also be very high.
a)
b)
Fig. 10. The performance analysis for actual scenarios: a) Increasing demand, b) Decreasing demand
Scenario 2- Policy analysis
While in the case of increasing demand (Case 2a), the demand could be fulfilled within the range 2000 to 5000 pcs/month; in the meantime there is a lower limit of order rate that could be fulfilled without adjusting the production time. In the case of a decrease in demand (Case 2b), at first the throughput rate is lower than the demand due to the maximum limit of demand to be fulfilled. However, it will be higher afterwards until production can catch
6k
5k
4k
3k
up and the backlog is reduced. Then the throughput rate becomes equal to the order rate. Such a behaviour is shown in Fig. 12.
a)
b)
Fig. 11. The performance analysis for policy scenarios: a) Increasing demand, b) Decreasing demand
As earlier discussed, a change of some parameter in the SD model does not mean considering only one factor at a time nor does it mean changing one parameter and then freezing the others. Hence as the order rate varies the parameters interconnected are also varied due to the input variation of order rate as the parameters are already linked and interrelated with one another.
In order to maintain the desired quality level, the cutting process parameters for the roughing operation can only be changed within a certain specified limits. The upper and lower bounds of the feed rate (mm/min) and the cutting speed (m/min) are given in this model; the upper bounds are the currently used values, thus they can be reduced to slow down the process yet they cannot be increased above these values.
a)
b)
Fig. 12. Comparison of Feed rate with respect to actual condition and proposed policy: a) Increasing demand, b) Decreasing demand
When there is lower demand than is customary, this policy will bring an advantage in terms of cost reduction by increasing the tact time rather than keeping it as a constant.
Consequently, when takt time is prolonged, the process can be slowed down; hence the feed rate and cutting speed will be reduced accordingly, as shown in Fig. 13 and Fig. 14, respectively. Accordingly, tool wear will be decreased, an eventual reduction in total tool cost and thus results in limiting any additional tool cost per part.
a)
b)
Fig. 13. Cutting speed comparison for the actual condition and policy proposed: a) Increasing demand, b) Decreasing demand
These variation of cutting process parameters will benefit for cost performance. The improvement in the cost per part is shown in Fig. 15, where the blue curve is representing the actual situation and the red curve is the proposed policy which is developed for the evaluation of machining strategies when the demand is lower than usual.
a)
b)
Fig. 14. Cost per part comparison with respect to the actual condition and policy proposed: a) Increasing demand, b) Decreasing demand
6. CONCLUSION AND RECOMMENDATION
This methodology was proposed for the evaluation of machining strategies that considers the machining system, its performance indicators, related parameters and their
inter-relationships. The system behaviour is simulated to evaluate various machining strategies and to analyse machining system performance. Also, it enables an understanding of the variation effect of one parameter on the other inter-connected parameters and on the overall machining system behaviour.
System dynamics is a suitable methodology to model complex machining systems that comprise the machining system capability and its related parameters. In general, it can be used to analyse system behaviour rather than exact numerical values, since qualitative elements are also incorporated in the system.
The results from the base scenarios and policy analysis show that adapting machining strategies to working conditions could enhance machining system performance. The policy developed was useful to improve cost performance by adjusting the takt time and process conditions without decreasing productivity. From the proposed policy scenario there is a maximum improvement of cost by 6.27% per machined part.
Of importance here is this case study model’s own limitation because only demand fluctuations were considered as a source of variation, excluding other situations, such as a change in workpiece material or design specifications. Nevertheless, this methodology allows to easily modify the model and to include other aspects that can be taken into account. In fact, the major advantage of this method is the possibility to re-use blocks or parts for other conditions that will be considered later in the model. As a matter in fact, the major advantage of this method is the possibility to re-use blocks or parts in other circumstances, which will be considered later on in the model.
ACKNOWLEDGEMENTS
This research work is funded by VINNOVA (The Swedish Governmental Agency for Innovation Systems) through the Sustainable Manufacture of Future Engine Components project grant 2012-00933.
REFERENCES
[1] ADANE T.F., NICOLESCU M., 2014, System dynamics analysis of energy usage: case studies in automotive
manufacturing, Int. J. Manufacturing Research, 9/2, 131-156.
[2] ADEEL H.S., ISMAIL N., WONG S.V., JALIL N.A A., 2010, Optimization of cutting parameters based on
surface roughness and assistance of workpiece surface temperature in turning process, American J.
of Engineering and Applied Sciences 3/1, 102-108.
[3] ALWAISE A. M.A., USUBAMATOV R., ZAIN Z.M., SAIFULDDIN A., BHUVENESH R., 2011,
Optimisation of machining parameters by criterion of maximum productivity rate, Australian Journal of Basic
and Applied Sciences, 5/11, 543-548.
[4] ARCHENTI A., 2014, Prediction of machined part accuracy from machining system capability. CIRP Annals - Manufacturing Technology, 63, 505-508.
[5] ARCHENTI A., NICOLESCU C.M., 2013, Accuracy analysis of machine tools using elastically linked systems, CIRP Annals – Manufacturing Technology, 62, 503-506.
[6] ARONSON D., 1996, Overview of system thinking [online].
[7] URLhttp://www.thinking.net/Systems_Thinking/OverviewSTarticle.pdf (Accessed March 2014).
[8] BIANCHI M.F., 2014, Evaluation of machining strategies in cylinder-block manufacturing – dynamic modelling, Master’s thesis, Royal Institute of Technology Stockholm, Sweden.
[9] BLUMBERGA A., BLUMBERGA D., et al., 2011, System Dynamics for Environmental, Engineering Students, 351, ID: 9980. Riga: Rigas Tehniskas universitates Vides aizsardzibas un siltuma sistemu instituts.
[10] CRESPO-MARQUEZ, A., USANO, R.R., AZNAR R.D., 1993, Continuous and discrete simulation in
a production planning system: a comparative study, Proceedings of International System Dynamics Conference,
Cancun, Mexico, The System Dynamics Society, 58.
[11] FORRESTER J.W., 1997, Industrial dynamics. Journal of the Operational Research Society 48 (10), 1037-1041. [12] HON K.K.B., 2005, Performance and evaluation of manufacturing systems, CIRP Annals - Manufacturing
Technology, 54, 139-154.
[13] HU S.J., ZHU X., WANG H., KOREN Y., 2008, Product variety and manufacturing complexity in assembly
systems and supply chains, CIRP Annals - Manufacturing Technology, 57, 45-48.
[14] JAWAHIR I.S., BRINKSMEIER E.M., SAOUBI R., et al., 2011, Surface integrity in material removal
processes: Recent advances, CIRP Annals - Manufacturing Technology, 60, 603-626.
[15] KIBIRA D., SHAO G., LEE Y.T., 2009, Modeling and simulation analysis types for sustainable manufacturing, Proceedings of the 10th Performance Metrics for Intelligent Systems Workshop, MD, USA, September 2010, 69-76.
[16] KIM C., LEE T., 2013, Modelling and simulation of automated manufacturing systems for evaluation of complex
schedules, International Journal of Production Research, 51/12, 3734-3747.
[17] LIN C., BAINES T.S., O’KANE J., LINK D., 1998, A generic methodology that aids the application of system
dynamics to manufacturing system modeling, International Conference on SIMULATION, IEE, Staffordshire
University, UK.
[18] MAANI K.M., CAVANA R.Y., 2007, System Thinking, System Dynamics: Managing Changes and Complexity, 2nd ed., Pearson Education, Canada.
[19] NICOLESCU C. M., 1991, Analysis, identification and prediction of chatter in turning, Ph.D. thesis, KTH Royal Institute of Technology Stockholm, Sweden.
[20] PAPAKOSTAS N., EFTHYMIOU K., MOURTZIS D., CHRYSSOLOURIS G., 2009, Modelling the complexity
of manufacturing systems using nonlinear dynamics approaches, CIRP Annals – Manufacturing Technology,
58/1, 437-440.
[21] ROHIT R.H., YUNG, C.S., 2011, Robust optimisation of machining conditions with tool life and surface
roughness uncertainties, International Journal of Production Research, 49/13, 3963-3978.
[22] SMART J., CALINESCU A., HUATUCO L.H., 2013, Extending the information-theoretic measures of the
dynamic complexity of manufacturing systems, International Journal of Production Research, 51/2, 362-379.
[23] STERMAN J., 2000, Business dynamics: System Thinking and Modeling for a Complex World, McGraw-Hill. [24] TAKO A.A., ROBINSON S., 2009, Comparing model development in discrete event simulation and system
dynamics, Proceedings of the 2009 Winter Simulation Conference, 979-991.
[25] TESFAMARIAM D., LINDBERG B., 2005, Aggregate analysis of manufacturing systems using system
dynamics and ANP, Computers & Industrial Engineering, 49/1, 98-117.
[26] XUEHONG D., JIANXIN J., TSENG M., 2006, Understanding customer satisfaction in product customization, International Journal of Advanced Manufacturing Technology, 31/3-4, 396-406.
![Table 1. Comparison between SD and DES modelling [1]](https://thumb-eu.123doks.com/thumbv2/5dokorg/4585592.117638/6.892.81.809.286.624/table-comparison-sd-des-modelling.webp)