V¨
aster˚
as, Sweden
Thesis for the Degree of Master of Science (120 credits) in Computer
Science, with specialization in Software Engineering - 30.0 credits
PREDICTING AND ESTIMATING
EXECUTION TIME OF MANUAL
TEST CASES - A CASE STUDY IN
RAILWAY DOMAIN
Sharvathul Hasan Ameerjan
san15014@student.mdh.se
Examiner: Daniel Sundmark
M¨
alardalen University, V¨
aster˚
as, Sweden
Supervisor: Wasif Afzal
M¨
alardalen University, V¨
aster˚
as, Sweden
Company supervisors: Mehrdad Saadatmand, Sahar Tahvili
RISE SICS V¨
aster˚
as, Sweden
Abstract
Testing plays a vital role in the software development life cycle by verifying and validating the software’s quality. Since software testing is considered as an expensive activity and due to the limitations of budget and resources, it is necessary to know the execution time of the test cases for an efficient planning of test-related activities such as test scheduling, prioritizing test cases and monitoring the test progress. In this thesis, an approach is proposed to predict and estimate the execution time of manual test cases written in English natural language. The method uses test specifications and historical data that are available from previously executed test cases. Our approach works by obtaining timing information from each and every step of previously executed test cases. The collected data is used to estimate the execution time for non-executed test cases by mapping them using text from their test specifications. Using natural language processing, texts are extracted from the test specification document and mapped with the obtained timing informa-tion. After estimating the time from this mapping, a linear regression analysis is used to predict the execution time of non-executed test cases. A case study has been conducted in Bombardier Transportation (BT) where the proposed method is implemented and the results are validated. The obtained results show that the predicted execution time of studied test cases are close to their actual execution time.
Index Terms : Software Testing, Prediction, Estimation, Manual testing, Execution time, NLP, Linear Regression, Test Specification, Optimization, Priortization.
Acknowledgements
My greatest gratitude goes to my academic supervisor, Wasif Afzal and indutrial supervisors, Sa-har Tahvili and Mehrdad Saadatmand. I convey my heartful thanks for their continuous support, patience, guidance and encouragement. A special thanks goes to my examiner Daniel Sundmark for his support and contribution in this master thesis work. I also wish to thank Markus Bohlin in RISE SICS V¨aster˚as for giving me a wonderful opportunity to work on this project. I also extend my thanks to Markus Einarson, Ola Sellin and Athanasios Stratis at Bombardier Transportation, V¨aster˚as, Sweden who rendered a faithful collaboration throughout my case study in their organi-zation. Last but not least, I would also like to thank my parents and my family for their innermost support despite distance.
Table of Contents
1 Introduction 7 1.1 Background . . . 8 1.2 Problem Statement . . . 9 1.3 Research Objectives . . . 9 1.4 Context . . . 91.5 Structure of the report . . . 10
2 Research Methodology 11 2.1 Literature Review . . . 11
2.1.1 Related Work . . . 11
2.2 Case Study Design . . . 13
2.2.1 Research Questions . . . 14
2.2.2 Case and Subject Selection . . . 14
2.2.3 Data Collection Procedures . . . 14
2.2.4 Analysis Procedures . . . 14
2.2.5 Validity Procedures . . . 14
3 System Architecture and Implementation 15 3.1 Database Creation . . . 15
3.1.1 Test Specification . . . 15
3.1.2 Log File . . . 16
3.1.3 Script Editor Tool . . . 17
3.2 Algorithm Implementation . . . 19
3.2.1 Parsing a New Test Case . . . 19
3.2.2 Prediction and Estimation algorithm . . . 20
3.2.3 Linear Regression Method . . . 21
4 Results and Evaluation 22 4.1 Estimating Execution Time . . . 22
4.2 Predicting Execution Time . . . 22
5 Discussions and Limitations 29
6 Conclusions and Future work 31
List of Tables
1 A test case example at BT. . . 16 2 Parsed test case - Half/full-beam head lights & decorative lights (single train) . . . 23 3 The parsed test steps of test cases with its Maximum Time (MT) and Waiting
Time (WT) of C30 project . . . 24 4 Input for the regression analysis. . . 24 5 Predicted execution times using regression analysis . . . 27 6 Comparison of obtained predicted time and actual execution time for 8 executions
of C30 project . . . 28 7 Comparison of actual and predicted times . . . 28
List of Figures
1 Flow chart showing the process followed for literature review. . . 12
2 Overall architecture of the proposed system . . . 15
3 A sample log file of executed test case (test result). . . 17
4 A test script example at BT. . . 18
5 Verbargument table for ExtLights008 test case. . . 19
6 Test case table from our database. . . 19
7 Step to find Analysis Toolpak in Excel. . . 25
8 Step to add Analysis Toolpak in Excel. . . 25
9 Step to check the addition of Data analysis. . . 26
10 Step to select regression method for data analysis. . . 26
11 Step to provide input for the regression analysis. . . 26
List of abbreviations
AT Actual Time
BT Bombardier Transportation CBR Case-Based Reasoning CNL Controlled Natural Language
DOORS Dynamic Object Oriented Requirements System FP Function Point
FPA Function Point Analysis FPE Function Points Estimation LOC Lines Of Code
MT Maximum Time
NLP Natural Language Processing NLTK Natural Language Tool Kit POS Part-of-Speech
RQ Research Question
SDLC Software Development Life Cycle SRS Software Requirement Specification SUT System Under Test
TPA Test Point Analysis UCP Use Case Point WT Waiting Time
1
Introduction
The usage of software systems keeps on increasing in our daily life. Hence, there is a necessity to evaluate and confirm the quality of a software system before being used by customers [1]. And also it is necessary to ensure that the software meets the customers’ expectation and works according to given customer requirements. To achieve this goal, software has to be tested before it is delivered to the customers. Informally, testing of a software is executing the code with a given set of inputs to measure the quality of software and also to identify the potential issues in it. Through a series of tests, we can increase our confidence with respect to quality of the delivered software product [2]. In practice, software testing faces limitations of time and budget [3]. There are only limited resources (such as time, budget, testers, etc.) available to perform testing. In such a case, if all the available test cases are considered for execution, it may lead to the over usage of resources. On the other hand, executing less number of test cases may lead to some unidentified faults in the system.
Due to resource limitations on software testing, it is cost-effective to identify a good subset of test cases from those available that can fit in the available resources [4]. Considering a real scenario in industry, a test suite consists of many test cases. Hence, it seems beneficial to identify an approach to select appropriate test cases for execution from a set of test cases in a test suite. There can be several criteria to select from when identifying a good subset of test cases [5]. Some examples of such criteria includes execution time, cost, requirement coverage and dependency between test cases. One can argue that execution time is one important criterion of the multi-criteria decision making problem [1]. If execution time can be predicted and estimated before executing the test cases, it will help testers to plan the execution of test cases well in advance.
Furthermore,the scope of this thesis work is restricted to prediction and estimation of the execution time of a “manually-written” test case. And it is limited to predicting and estimating one of the different criteria for a future multi-criteria decision support system for test case selection, i.e., the execution time of a test case. Estimating the execution time is the estimation of maximum time bound that the test case is allowed for its execution. Predicting the execution time is the prediction of the actual time that the system takes to perform execution in the considered test system. Furthermore, a prototype version is implemented and evaluated in a case study within Bombardier Transportation in V¨aster˚as, Sweden.
Typically organizations allocate teams (testers) to perform testing-related activities. In such a situation, test teams are required to estimate the effort required to perform testing activities. Such planning will help them to make schedule for testing and helps them to request for more resources or to argue upon deadlines if necessary [6]. For example, inaccurate estimation of execution time may delay the product delivery and/or compromise the reliability of software product. Therefore, in addition to being an important criterion for a multi-criteria decision support system for test selection, this prediction and estimation of execution time of test cases has advantages in accurate planning of testing activities in general.
There exist several models in the literature that estimates the effort required to define, develop and execute test cases [6]. Their estimates are based on t he Lines Of Code (LOC). When the test execution are measured using LOC, it is difficult to plan the test execution in the early stages of software development. Because they have to wait until the LOC is readily available. Therefore, we propose a method that uses test specification to predict and estimate the execution time of manual test cases written in natural language.
Typically, it is expected that the manual test cases are written in a Controlled Natural Language (CNL); this may help us to have a better prediction and estimation of execution time. Due to the usage of CNL, the problems of using different lexicons for the same word can be minimized [6]. CNL is a subset of natural language where there are restricted grammar and lexicon, which leads to a standard way of writing a sentence. Such a restriction reduces the number of possible ways to describe an action, event and an object. This thesis assumes that the test cases are written using a CNL. We further assume that the test cases are written in the following structure: one main verb, zero or more arguments. The verb in a test step of a test case provides necessary detail of action of test step and arguments provides additional information about the action performed by the verb. For example, the test step “Wait for 20 minutes” has verb wait, which describes the action of system and the argument 20 minutes, provides additional information about the verb
(how long the system has to wait).
1.1
Background
Software testing is the most important activity [7] for both the developers and the software users. It is a process in which a software product is being analyzed to find the difference between expected and actual outcomes. In other words, it is a process of identifying faults in the software. It is also used to check the quality of software product. Software testing ensures the reliability of the product. In order to ensure the maximum reliability of working software, researchers have identified several techniques at different levels of testing namely unit, integration and system testing . A software is composed of several modules and such modules are separately tested in Unit testing. It requires deep knowledge about the modules and it can be done in the early stages of software development. Only 65 % of errors can be detected in this level of testing [8]. The next level of testing is the integration testing. It is also known as integration and test (I&T). In this testing level, different modules are integrated and tested for errors. It aims at testing the variable exchange between the modules and inter-module communication [9]. In System testing, complete working of the software is tested for the user-specified requirements. Also, it is tested whether the software is acceptable in the market, which is also termed as Acceptance testing. This research work will focus on the test cases from integration testing.
In the Software Development Life Cycle (SDLC) process, software testing is an important phase [10]. It is considered as an expensive and time consuming activity which requires more than 50% of software development cost. This percentage will be higher in safety critical applications.
A software is composed of several units called as modules or components. After the individual units are tested separately, it is necessary to combine them and see how they interact with each other to form a complete system. If system still has defects, then the severity of the defect decide whether to proceed onto the integration phase or to run both the unit testing and integration testing in parallel. For example, there may exist some error like “404: Page not found”, which makes the system incomplete and leads to integration issues. During integration testing, hardware integration with the software is also tested. This is to test how the hardware behaves on the software under test. The test plan for the integration testing will be written before performing integration testing. One of the part of integration testing is interface testing which is used to test the interface between components or modules in a system [11].
A test specification consists of number of test cases. A manual test case has several test steps which are written in natural language. The test steps consists of actions, input data and expected output from the system. These actions are the activities conducted on the system under test. It is to ensure that the expected behavior of the system is same as the actual behavior.
Natural Language Processing (NLP) is a process in which computers can analyze, understand and deduce information from texts, written in the natural language [12]. In other words, it is defined as the interaction between computers and human or natural language in which computers extracts meaning from the input [13]. This input is either from human or natural language. NLP is a growing research field where many libraries and toolkits have been developed in recent days [14]. These components are reusable. One such component used in our project is Natural Language Tool Kit (NLTK). It can be used with Python programming for natural language processing such as tokenizing, stemming, parsing and so on. Tokenizing is the process of breaking a sequence of strings into words or sentences. Stemming is a process of linguistic normalization in which different forms of a word can be reduced to a normal form1. For example, stemming of the words, “wrote, write, writing, written” is “write”. Parsing is a process in which a sentence is analysed by considering each and every words in it and determining its structure from its constituent parts2. NLTK uses another technique called Universal Part-of-Speech (POS) Tagset to identify word classes such as nouns, verbs, adjectives and adverbs. We simply use POS tagset such that we do not need its technical details.
1https://xapian.org/docs/stemming.html
1.2
Problem Statement
Software testing is considered as one of the most expensive process [15] in the SDLC. It is also a time consuming process [15]. Therefore, industrial software testing faces lots of restrictions with respect to time and budget [3]. It is difficult to predict the cost required and/or time needed to test a software system. Testing involves various activities such as planning the test, test case preparation, test case execution and producing the results of execution. Among all these activities, test execution time is a contributing factor in making testing an expensive activity. This thesis work will focus only on the test execution part of the testing activity. It focuses on predicting and estimating the execution time, which in turn help the testers and/or managers to plan the test execution well in advance. Based on this predicted data, test cases can be prioritized before execution according to the limitations of time and budget.The necessity to define and prioritize those test cases is that all the test cases from a test suite cannot be executed due to time and budget constraints [3]. Predicting and estimating the execution time of test cases will help in the efficient usage of time, which in turn could reduce the cost of overall testing process. Most of the existing methods in this area uses requirements (functional and non-functional), use cases and so on for prediction and estimation of test case execution time. These methods uses LOC from development to predict the execution time of test cases. In this case, we need the code from the development phase to predict execution time. Hence, the test plan cannot be made well in advance without the LOC. Therefore, we need a method that uses test specification to predict and estimate the execution time, by which the testing can be planned in advance with respect to their restrictions. Such planning will help test team managers to assign the required resource, schedule the test execution better and monitor test-related activities such as test planning, execution and reporting.
1.3
Research Objectives
The research objective of this thesis is as follows:
• To propose and evaluate a new approach to predict and estimate the execution time of manual test cases.
1.4
Context
During this thesis work, a literature review on methods to predict and estimate the execution time of test cases have been studied. Prediction and estimation of test case execution time relates to the problem of multi-criteria test case priortization problem where execution time is one of the many possible criteria. The test case priortization techniques from the literature does not take into account actual test execution effort. Instead, it relies on the LOC for predicting execution time. In this scenario, test case priortization cannot be done at the early stage of SDLC. Instead, we need to wait until the LOC are available. The main objective of our thesis work is to predict and estimate the time required to execute the manual test cases in the early stages of SDLC. This, in turn, help the testers to plan their test execution in a given limited time and budget. Hence this thesis will provide a method to predict the execution time of given test cases without executing them. Our method uses test specification for prediction instead of using LOC. Our method makes use of CNL with which each and every step from a test case are encountered and considered for prediction and estimation. The high level approach of our prediction algorithm works as follows:
1. Test specification document is considered as an input for prediction and estimation algorithm. 2. Each and every test step inside a test case is parsed using NLP.
3. For each and every test step, the time required to execute them are calculated based on the data collected in a database.
4. Finally the predicted and estimated execution time of a test case is provided as a result. This thesis work will use two terminologies namely actual time and maximum time. The actual time will be used in the prediction algorithm and maximum time will be used in the estimation
algorithm. Prediction algorithm is used to predict the actual time that is required to perform test execution of the examined test cases on underlying system. Estimation algorithm is used to estimate the maximum time bound that the system takes to perform the execution of given test cases.
A MT is the maximum time limit to successfully execute a test step. If a system takes more than the predefined MT for testing, then the system terminates the testing operation and fails the test step. It is independent of system properties i.e., the MT is fixed for every action in the test steps. In our case organization, testers always used to fix the upper boundary time as MT for test actions.
An Actual Time (AT) is the real time a test step takes for execution. It is dependent on the system properties under which the test execution is performed, e.g., test execution platform. Our work considers that the AT is always lesser than or equal to MT.
1.5
Structure of the report
The structure of this thesis report is as follows,
• Chapter 2 presents the methodology used for the thesis. It also focus on the literature study in the area of software effort estimation and drawbacks of the methods identified from the literature. Another methodology used for this thesis is case study. An overview and design of the case study is also defined in this section.
• Chapter 3 describes the architecture of the implemented system to predict and estimate the execution time of test cases. It focuses on the creation of a database and the source from which the data are extracted to build our database. Implementation of the proposed algorithm is also explained in this section.
• Chapter 4 presents the input test cases used to test our implemented algorithm and the obtained result. The results are evaluated and presented in this section.
• Chapter 5 discusses the challenges faced during the implementation, limitations of the pro-posed approach and some of the techniques used to overcome the limitations.
2
Research Methodology
The first phase in this thesis work is the literature review of existing studies conducted in the area of test effort estimation followed by an industrial case study.
2.1
Literature Review
One of the research methods used in this thesis was the literature review, to identify the related work and existing approaches used to predict and estimate the execution time of test cases. This review helped in finding a suitable method to predict and estimate the execution time from manual test cases written in English natural language.
The databases used for the literature review are as following: • Scopus
• IEEE Xplore • Google Scholar
In this process, we started with Scopus followed by IEEE Xplore and Google Scholar to find relevant literature. The selection of these sources is motivated by its extensive coverage of different types of academic sources such as scientific journals, books, conference papers and so on. The queries used for searching are as following:
• (((Prediction) OR (Estimation)) AND (Time) AND (Test))
• (((Prediction) OR (Estimation)) AND ((Time) OR (Effort)) AND (Test)) • (((Prediction) OR (Estimation) OR (Guess)) AND (Time) AND (Test)) • (((Prediction) OR (Estimation)) AND (Time) AND ((Test) OR (Execution)))
• (((Prediction) OR (Estimation)) AND (Time) AND ((Test) OR (Execution) OR (Execute))) • (((Prediction) OR (Estimation)) AND ((Time) OR (Effort)) AND ((Test) OR (Cases))) • (((Prediction) OR (Estimation)) AND (Time) AND (Test) AND (Manual))
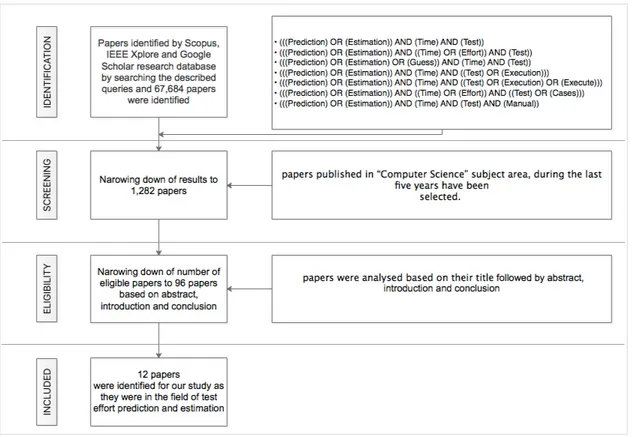
These search queries have resulted in 67,684 papers. To narrow down the search, the papers which were published in “Computer Science” subject area and during the last five years have been selected. This reduced the sample size to 1,282 papers.
From the obtained results, each and every papers was analysed based on the title. If the title is related to our search, then in order to obtain more information, the abstract, introduction and conclusion of the documents were carefully read. By the process, relevant papers in the related field of test effort prediction or estimation were identified.
When a paper in the field of our study is obtained from Scopus, the citations to that paper have been found using Google Scholar. The papers relevant to our search is obtained using “cited by” feature of Google Scholar. 96 relevant papers were gathered and analysed. Among them, 12 were identified for our study as they were in the field of test effort prediction and estimation. The overall process followed for the literature review is depicted in Figure 1.
2.1.1 Related Work
In [16], Nageswaran et al., proposed a method called Use Case Point (UCP). In this method, use cases are considered for estimating the test execution time. Initially, the number of actors and use cases are identified for this approach. In addition to that, software requirements, technical and environmental factors are also used to estimate the test execution time. Using this technique, the test effort estimation can be done in the early stages of software development itself because it does not depend on LOC. This UCP method is used to estimate the test effort as a whole which includes test plan, design, execution, monitoring and reporting. However, this method is not used to capture each and every instance of test activity such as one test case execution [17].
Figure 1: Flow chart showing the process followed for literature review.
In [18], an approach similar to UCP [16] has been proposed which is called as cuckoo search method. This method also uses use cases to estimate the effort for testing. The main difference be-tween cuckoo search method and UCP method is that the UCP assigns a fixed value (or weightage) to their parameters such as actors or use cases, whereas cuckoo search assigns a range of values for each and every parameters. This range of values assigned on the parameters can be either static (fixed) on dynamic (changing). It depends on the target system in which the estimation is done. This approach also take into account of the expertise of development and testing team. Based on all these parameters, test effort is estimated. In order to apply this method for estimating the effort of a new project, we need historical data from at least one project. Since the data is required from both the developers and testers, it relies on human for effort estimation. This is considered as one of the drawback of this approach.
Another method has been introduced in [19] called as Accumulated Efficiency Method which also uses use case for estimation. This method is used to estimate the execution effort for testing based on the efficiency of the team. Along with the use cases, LOC is also used for software test estimation. This approach is applicable only for manually executed tests and do not apply for automated test execution. Usually small test teams prefer manual testing rather than the automated testing because of budget restrictions. The method does not require any information from historical data. Also, it does not use any natural language processing for estimation. However, estimation cannot be done in the early stages of software development, because it uses LOC as one of the input. This method is also used to estimate the whole testing effort instead of estimating effort for individual test case execution.
In order to minimize the usage of use cases for estimating the test execution effort, Nageswaran et al., proposed another method in [16] called as Function Points Estimation (FPE) method. This approach uses function points to estimate the execution effort for software testing. It requires some factors like transaction and person-hours to estimate the effort. These values are obtained from the previously executed projects of the same domain. These details are not easy to collect. Therefore, it suffers adaptive problems [17]. And also it is costly to implement. Therefore, this method is not widely used for estimation of software testing effort.
Another direction for estimating test execution is carried out in [20] called as Case-Based Reasoning (CBR). This approach used data mining techniques to classify the data. It is a reasoning approach in which previous cases are considered and reused to solve the problem of test effort estimation. This method uses data from similar cases (or situations) and hence it is difficult to identify or solve a problem if new case arrives. In such scenario, there won’t be any data to be reused to solve the problem. Even if the case is same, adopting same solution for similar problem may not yield the same result. Due to such limitations, this approach can be used only in small projects.
In [21], Sharma et al., proposed the Software Requirement Specification (SRS) method. It uses SRS document to estimate the execution effort. Since this approach uses SRS document, the estimation can be done in the early stage of software development. This method works in such a way that requirements are extracted from SRS document and complexities are assigned to them based on their level. With the help of the weightage assigned to the requirements based on complexity, test effort is estimated. This method uses requirement specification instead of test specification. Therefore, it lacks clarity over test specifications.
In [22], Aranha et al., overcome the above problem by using test specification instead of using requirement specification. They created an estimation model that estimates the software test execution effort based on the test specifications. This method extracts test steps of test cases from the test specification document. It uses size and execution points for estimation the test execution effort. The execution points are fixed based on the historical data which stores data of previously executed test cases. For this method, test specifications should be written in a CNL. CNL is similar to that of natural language. The only difference is that the test specifications written in a CNL uses standard format (some restrictions in the usage of lexicon and grammar). Therefore, there is no possibility of writing an action in many different ways. This approach identifies that each and every test step has one main verb and zero or many arguments supporting the main verb. Each and every verb identifies in a test step represents the action and arguments adds more information to the action.
The entire process of this model to estimate the test execution time is given by,
• Once the test specification file is obtained, each and very line is parsed for verb and supporting arguments
• An execution point (measure of size and execution complexity) is assigned to each and every step
• Add all the execution points obtained from the previous step • Estimate the test execution time of the test cases in man-hours
When using this method for effort estimation, test cases should be readily available. Also, this method uses test steps for execution time estimation. Therefore, the cost of estimation is high. Each time, the relation between test execution time and execution points have to be proven.
In our approach, we also use test specifications to estimate the execution time, without using execution points as in above method. In addition to the size of the test cases, we consider the waiting time of the test steps for test effort estimation. We also build a database that consists of historical data of previously executed test cases. Another difference with above model is that we use MT to estimate the execution time. The MT of test cases comes from a tool called Script Editor (Section 3.1.3), where testers of BT fix an upper bound of time within which the test cases have to be executed. Along with the MT, we use log files from previous execution to predict AT.
2.2
Case Study Design
In addition to the literature review, a case study was also used as our research method. We com-municated with BT testers personally and required data were collected from them. The collected data includes test execution logs. Such data are used to find the execution time of previously executed test cases. Based on the obtained data and the method identified from the literature review, an algorithm/prototype is developed to predict and estimate the execution time of manual test cases.
2.2.1 Research Questions
The objective of this case study is refined into a set of following research questions. These questions will be answered through our case study analysis.
RQ1: How can the execution time of test cases, written in natural language, be estimated and predicted in an industrial domain?
RQ2: How to implement and validate the execution time prediction and estimation algorithm in an industrial domain?
2.2.2 Case and Subject Selection
This case study targets at finding a method to predict and estimate execution time based on the test cases that have been executed before in BT. C30 project from BT is considered as a case for our study. C30 is the underground subway train used as public transportation in Stockholm, Sweden. This project is called as MOVIA C30 metro. The new fleet is running on the Red Line from north-eastern Stockholm to the sub-urban part of south-west, crossing the city centre. These vehicles have driver’s cab in both sides of train and also built with driver-less functionality. It satisfies environmental standards such as efficient energy usage and built using recyclable materials [23]. The test cases and test specifications obtained from this project are used as the input for our case study.
2.2.3 Data Collection Procedures
The data collection involves the use of direct method [24] i.e., personal communication (informal interviews) with BT employees. In other words, the subjects are contacted directly and the real test cases are collected. This collected data acts as the input/starting point of the case study. 2.2.4 Analysis Procedures
The time mentioned in the Script Editor tool (Section 3.1.3) and log files are the main source for our analysis procedure. The test case also contains time such as WT. These times are utilized for our algorithm. MT, WT plays a major role in the execution time estimation. There are the cases where the test case does not contain specific times. Such cases will use our database. The database is searched across the ‘verb’ and ‘arguments’ for the execution time (Section 3.1.3). 2.2.5 Validity Procedures
The validity of collected data is verified throughout the phases of case study. The collected data is analyzed to define a prototype/algorithm to predict and estimate the execution time. Once it has been done, the data is validated in the implemented prototype. The execution time from the algorithm is validated with the actual execution time of the selected test cases.
3
System Architecture and Implementation
The overall architecture of the system is given in Figure 2.
Figure 2: Overall architecture of the proposed system The implementation of the system involves two phases namely,
1. Database creation and 2. Algorithm implementation.
In phase 1, historical data is collected from different sources. The sources are detailed in Section 3.1. A database is created from the collected data which stores the information of previously executed test cases. In phase 2, two algorithms namely prediction and estimation algorithms are implemented. The algorithms work in such a way that it requires a text file as an input. This file consists of a new test case for which we are going to predict and estimate the execution time. The implementation and working of algorithms are presented in Section 3.2.
3.1
Database Creation
The first step involves collection of data from three different sources namely, • Test specification.
• Log file.
• Script Editor tool. 3.1.1 Test Specification
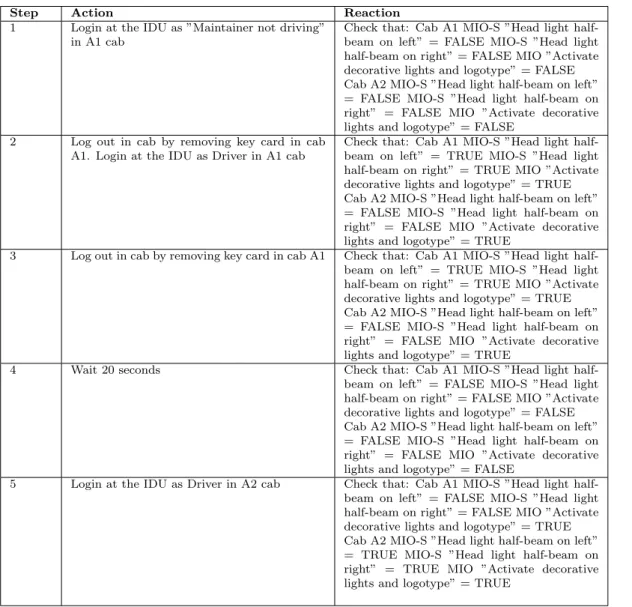
Test Specification document consists of one or more test cases. Each and every test case consists of number of test steps. Test steps mainly consists of actions and their expected reactions. These actions are captured in our database. The test specifications are written in natural language (mostly in English language). The actions are plain sentences. It is assumed that mostly the test actions are imperative sentences. Therefore, the sentences starts with verbs. In this case, sentences begin with the main verb followed by supporting arguments, which adds more information to the main verb. Each and every action is captured by making entry of main verb under Verb column in the database and remaining sentences under arguments column in database. A sample test specification document containing test steps are shown in the Table 1.
Step Action Reaction 1 Login at the IDU as ”Maintainer not driving”
in A1 cab
Check that: Cab A1 MIO-S ”Head light half-beam on left” = FALSE MIO-S ”Head light half-beam on right” = FALSE MIO ”Activate decorative lights and logotype” = FALSE Cab A2 MIO-S ”Head light half-beam on left” = FALSE MIO-S ”Head light half-beam on right” = FALSE MIO ”Activate decorative lights and logotype” = FALSE
2 Log out in cab by removing key card in cab A1. Login at the IDU as Driver in A1 cab
Check that: Cab A1 MIO-S ”Head light half-beam on left” = TRUE MIO-S ”Head light half-beam on right” = TRUE MIO ”Activate decorative lights and logotype” = TRUE Cab A2 MIO-S ”Head light half-beam on left” = FALSE MIO-S ”Head light half-beam on right” = FALSE MIO ”Activate decorative lights and logotype” = TRUE
3 Log out in cab by removing key card in cab A1 Check that: Cab A1 MIO-S ”Head light half-beam on left” = TRUE MIO-S ”Head light half-beam on right” = TRUE MIO ”Activate decorative lights and logotype” = TRUE Cab A2 MIO-S ”Head light half-beam on left” = FALSE MIO-S ”Head light half-beam on right” = FALSE MIO ”Activate decorative lights and logotype” = TRUE
4 Wait 20 seconds Check that: Cab A1 MIO-S ”Head light half-beam on left” = FALSE MIO-S ”Head light half-beam on right” = FALSE MIO ”Activate decorative lights and logotype” = FALSE Cab A2 MIO-S ”Head light half-beam on left” = FALSE MIO-S ”Head light half-beam on right” = FALSE MIO ”Activate decorative lights and logotype” = FALSE
5 Login at the IDU as Driver in A2 cab Check that: Cab A1 MIO-S ”Head light half-beam on left” = FALSE MIO-S ”Head light half-beam on right” = FALSE MIO ”Activate decorative lights and logotype” = TRUE Cab A2 MIO-S ”Head light half-beam on left” = TRUE MIO-S ”Head light half-beam on right” = TRUE MIO ”Activate decorative lights and logotype” = TRUE
Table 1: A test case example at BT.
3.1.2 Log File
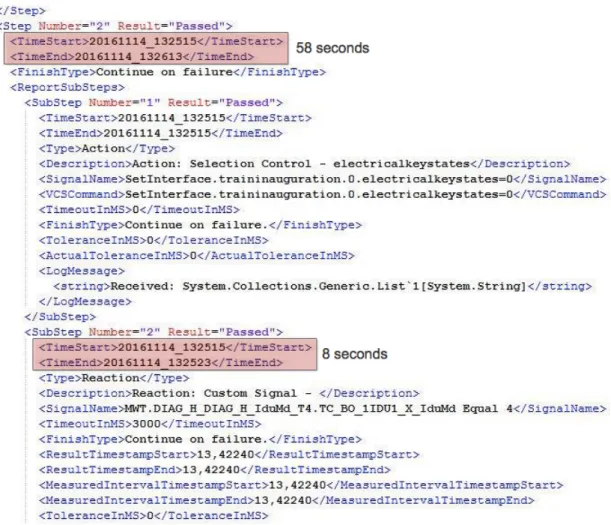
Another source for our database requires log file of previously executed manual test cases. Log files are Extensible Markup Language (XML) files in our case. These files were collected from the employees of BT as a result of informal queries. It helps us to find the AT in real scenarios. This log file consists of start time and end time of each and every test steps. Therefore, AT required to execute a test step can be figured out by subtracting end time from start time. The obtained AT are mapped to their respective test actions and they are entered under time column in our database. Since this thesis work is concerned with integration testing, the logs from the integration tests are collected. A sample log file of previously executed test case of C30 project is shown in Figure 3. As we see from the Figure 3, the AT for the Step 1 is calculated by subtracting ‘TimeEnd’ from ‘TimeStart’ which is ‘58 seconds’. Similarly, the AT calculated for Step 2 is ‘8 seconds’.
Figure 3: A sample log file of executed test case (test result).
3.1.3 Script Editor Tool
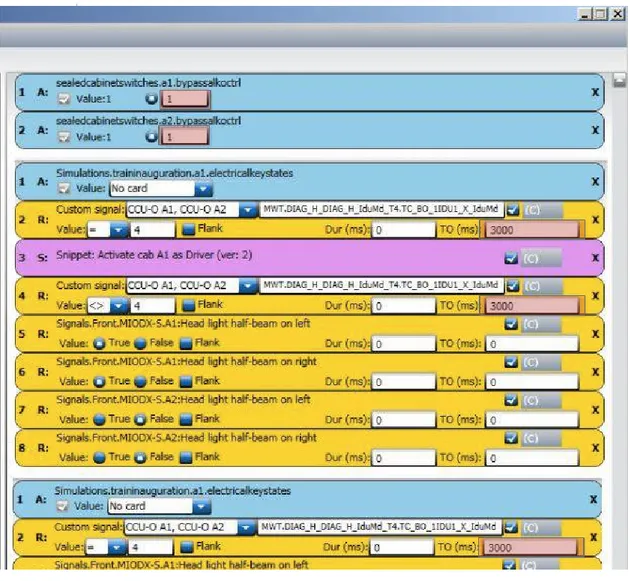
Test Script from the Script Editor is considered as another input for data collection. It is a tool used by the BT testers to fix MT required to execute each and every test actions. If an action or reaction takes more than the specified time, then the operation will be automatically terminated and failed. Using this tool, a MT is set for the action, reactions and snippets. A snippet is a block of test steps which can be reused for other test cases. For our database, the actions for respective test steps are identified and its identified MT from Script Editor is made as an entry in the database under maxtime column. The obtained information from the Script Editor has been used in our algorithm to estimate the MT of test cases. Figure 4 shows screen shot of a test case that actions, reactions, snippets with their assigned maximum time.
The color code in the figure represents the type of test activity. Blue color represents actions, yellow represents the reactions, pink represents the snippet and grey represents waiting time.
The Log files provide the actual time that a test step takes to perform its execution whereas the MT from Script Editor provides a maximum time bound at which the test steps should be executed. Therefore, for each and every step identified from a test specification document of previously executed test cases, we have the scripted version which provide MT and XML file that provides AT.
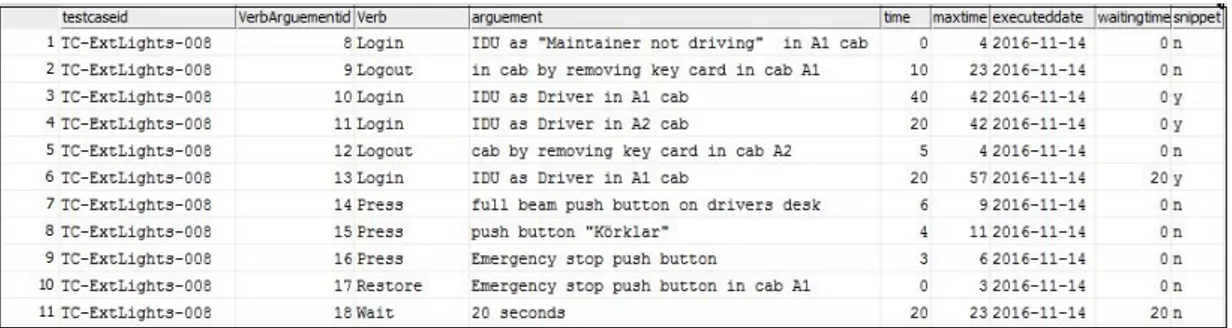
All the above Figures namely 3, 4, and Table 1 represents the data from TC-ExtLights008 test case of C30 project from BT. Therefore, one entry (a row) in database consist of data from test specification, Script Editor and XML log file. Figure 5 represents entries for test steps in “VerbArgument” table of our database for TC-ExtLights008 test case. The tables consists of 9 columns namely verbargumentid, testcaseid, verb, argument, time, maxtime, waiting time,
Figure 4: A test script example at BT.
executeddate and snippet. Verbargumentid is the primary key of the table, which is auto increment for every new record. Testcaseid is the foreign key that refers to another table called “Test case” which is shown in Figure 6. This column represents test case id which is unique for each and every test cases. The verb, argument column consists of main verb and arguments supporting the main verb respectively from the test specifications. time column represents the AT from log files and maxtime column represents the MT from Script Editor. Snippet columns shows whether the test step is a snippet. The date at which the entry has been made is captured in executeddate column of the table. One entry in Verbargument table represents data from test specifications, log file and also Script Editor.
In addition to the above table, we also have another table in our database to store the infor-mation about test cases. This table is called as “Test case” and has 4 columns namely testcaseid, test case name, realtime and maxtime. This table is shown in Figure 6. In this table, testcaseid column is the primary key and holds the identifier of the test case.testcasename column represents the name of the test case. realtime, maxtime column represents the AT and MT of the test case respectively. One entry in the test case table has one or more entries in the Verbargument table.
Figure 5: Verbargument table for ExtLights008 test case.
Figure 6: Test case table from our database.
3.2
Algorithm Implementation
Our approach or the proposed algorithm involves two major steps, which are as following: • Parsing a new test case.
• Prediction and Estimation algorithm. 3.2.1 Parsing a New Test Case
A new test case is a test case which has not been executed before. In this context, a new test case resides in a test specification document. Therefore, an MS Word file written in English natural language is considered as an input for our algorithm. When a new test case arrives, our parsing algorithm reads the file line by line. As per our assumption, the Word file has test cases written in a table format. The table has three columns namely test step number, actions and reactions (refer Table 1). Our algorithm reads the second column which describes actions. The test steps (actions here) are split into sentences. Each and every sentence is then identified for verb and supporting arguments. Since it is studied that the test steps are written using imperative sentences, first word in the sentence is identified as verb and the remaining part of sentence is then fed into NLTK parser. NLTK is an inbuilt parser provided by Python scripting language which is used for NLP3.
When parsing the sentence, the nouns from the sentence are captured. As a result, verb and nouns from a sentence has been identified using Python programming language. This will be provided as
input for next step. We identified that the reactions in test steps do not follow the verb, argument pattern in most of the studied test specifications. In our data collection phase, the MT from Script Editor and AT from log files are mapped to the actions from test specifications. Therefore we consider only actions from a new test in our algorithm and ignore the reactions.
3.2.2 Prediction and Estimation algorithm
Once the verb and arguments (nouns in this context) are identified from the sentence, verb from the sentence (a test step) is searched across the verb column in the database and nouns are searched across the argument column in the database. When there is a match, the actual time and maximum time of the test step are obtained. These values are used for both the prediction and estimation algorithm separately. Estimation algorithm uses the obtained MT from the database. If match not found, then baseline value is considered for estimation. A baseline value is the system baseline time, which a system takes to respond to the given input. Testers from BT were consulted for fixing the baseline value for a new test step. Baseline values are 2 seconds for actions and 3 seconds for reactions. Once the maximum values are obtained for each and every test steps, they are summed up and the result is given as the maximum time (i.e., estimated time) to execute the given test case.
Data: New test case
Result: Maximum Time of the test case initialization;
if input file is a Word document then while not at end of the document do
read line by line;
identify tables from the document; if table found then
read action column of test step from the table; take first word of sentence as verb;
feed the remaining sentence into parser and identify nouns; search for identified verb, argument in the database; if match found then
assign the value as maximum time for the current step; else
take baseline value as maximum time; end
sum all the maximum time and store as result; return result; else terminate parsing; end end else
Look for another Word file end
Algorithm 1: Estimation Algorithm.
Using Algorithm 1, we can estimate the MT required to execute the test cases. As mentioned earlier, AT depends on the system under test. In other words, AT is a machine-dependent time. Our studies show, the actual execution time for test cases change per execution even on the same machine. Since, AT is a variable time, we need to predict it on various machine. As we explained in Section 3.1.3 , MT is a fixed time which is greater than or equal to AT. In the following section, through utilizing MT, we propose a method for predicting AT on the different machines using linear regression.
3.2.3 Linear Regression Method
In statistical modeling, linear regression is a method used for modeling the relationship between a dependent variable and one or more independent variables. It plots the coordinates in a graph using the both dependent and independent variables and finds a linear function using simple line in a graph. With this function (or graph), the values of dependent variable can be found as the function of independent variable. If the model uses only one independent variable, then it is called as simple linear regression.
To utilize linear regression for predicting AT, n ≥ 3, where n is the number of test steps. Since, in the linear regression method, we are trying to find the best line which has a minimum distance to all points, we need to have a set of points. As we know, an infinite number of lines pass through a single point and also there is only one line can pass through two points, we need to have at least three points [25]. In fact, for using linear regression method to predict the AT, the test case should have at least 3 steps. Also from the database, we will get the actual time required to execute the test steps which are executed before. By using these two values, AT required to execute a new test step (previously non-executed) can be predicted using regression analysis. Consider t’
1,t’2,...t’n be
the actual execution times and t1,t2,...tn be the maximum execution times for the test steps in
a test case. Here t1 is the MT of first test step and tn is the MT of last test step. The actual
execution time (T’n) of a test case using linear regression analysis is given by the formula [26],
Tn0 =
n
X
n=1
t0n (1)
Consider (t1,t’1), (t2,t’2)...(tn,t’n) represents (MT,AT) of previously executed test steps of a test
case. For any test case containing more than 3 test steps, the AT(t0) of a test step is calculated by Equation 2 having the value of MT(t). In this regression analysis, AT is considered as a dependent variable and MT is considered as an independent variable [26].
t0 = mt + h (2)
where m is the slope of regression line. Slope of the regression line represents the rate of change of AT as MT changes. Since AT is the dependent variable, the slope m relates the predicted values of AT given MT. The value of m is calculated using the formula [26],
m = n Pn i=1tit 0 i− ( Pn i=1ti)(P n i=1t 0 i) nPn i=1t 2 i − ( Pn i=1ti)2 (3) and h is the t-intercept. The t-intercept points the position where an axis is intersected. The values of h and is calculated by [26],
h = ( Pn i=1t 2 i)( Pn i=1t 0 i) − ( Pn i=1ti)(P n i=1tit 0 i) nPn i=1t 2 i − ( Pn i=1ti)2 (4)
4
Results and Evaluation
The result section has been divided into two parts for two algorithms namely Estimation algorithm and Prediction algorithm. To verify the algorithm, test cases have been taken from Dynamic Object Oriented Requirements System (DOORS) database of BT. We need the input files (Test specifications in our case) for the algorithm in Microsoft Word format. So the test specifications from the DOORS database have been exported to Microsoft Word format. Those test specifications are taken from the C30 project of BT. C30 is an underground train (Metro train) developed by BT which is used as public transportation in Stockholm, Sweden.
4.1
Estimating Execution Time
In order to evaluate the estimation algorithm, Half/full-beam head lights & decorative lights (single train) from TC-ExtLights008 test case of C30 project has been provided as an input.
When the test case is given as an input to our estimation algorithm, it parsed each and every actions of test steps into verbs and arguments. After parsing, the verb and arguments were searched in database. When a match found, it fetched the MT values. When the match was not found, it used baseline time as the MT (3 seconds). In both the cases, our algorithm tries to search for the records in the database but not making any new records in it. In the end, all the obtained MT values are summed up and the result is provided as the total MT required to execute the studied test case. The results after parsing each and every test steps, extracting verb and arguments, its corresponding MT and the total MT for the test case are presented in the Table 2. For instance, consider Step 2 from the Table 2. The action is parsed and got ‘Set’ as verb and ‘Master, CC, ATP’ as arguments. The obtained verb and argument are searched in the database across the verb and argument column respectively. The search resulted in a value ‘1’ for MT. Consider the Step 1 from the same test case as in Table 2. After parsing the action into verb and arguments, they are searched in the database. The search did not find any match records. Therefore, we used baseline value as MT for this step which is ‘3’. This process is done for all the 12 steps for the studied test case. In the end, all the obtained MT for each steps are summed up and the MT required to execute the considered test case is given as 98 seconds.
As a result, the above test case provided 98 seconds as the maximum time required to execute it. This considered test case has been recently written. Therefore, we can not find its execution logs from the C30 project of BT to validate the result. The result can be validated in future when it gets executed. But this result helps us to show that we can find the maximum time of a new test case before its execution.
In the further section of this report, we have considered some test cases, estimated its maximum time and validated them after the execution.
4.2
Predicting Execution Time
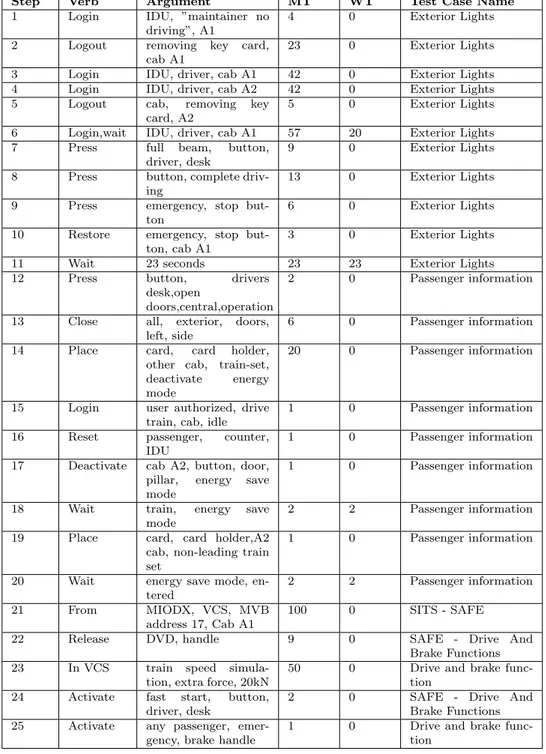
In this section, some manual test cases from BT have been taken and the execution time required to execute those have been predicted using our prediction algorithm. These test cases were taken from the C30 project. The Table 3 represents the test cases considered, its parsed elements using our NLP parsing algorithm, its MT and WT for every test step. We have so far analyzed 5 test cases from the C30 project. To validate the results, we have considered only those test steps that have the scripted version in the Script Editor and are executed in the System Under Test (SUT). Our estimation algorithm search for the ‘verb’ and ‘argument’ from the database and maps the MT and WT as in Table 3. In some cases, we do not find the MT and WT in our database where baseline time will be used. For instance, Step 10 in Table 3 does not have a matched entry in the database. In that case, baseline value of 3 seconds is considered for that step. This baseline value is fixed after consulting with the testers from BT.
With this estimated time, we are going to predict the AT for these test steps. This AT is system dependent. Hence, we refer to the log files of those test cases which are already executed in the SUT. These log files are XML files. In order to predict the AT required to execute the test cases, a linear regression analysis is done using ‘Excel data analysis’. To use ‘Data analysis’ in ‘Microsoft Excel’, we need to add an ‘Add-Ins’ called ‘Analysis Toolpak’. It is found in the Excel
Step Action Verb Argument MT 1 Set from ATP
Ready to run for A1 cab
Set ATP, Ready, A1, cab
3
2 Set ”Master CC” from ATP
Set Master, CC, ATP 1 3 Set direction of
train from ATP (NSS Direction 1 = TRUE, NSSS Direction 2 = FALSE)
Set direction, train, ATP, NSS, Di-rection, TRUE, NSSS, Direction, FALSE 8 4 Remove Ready to run from ATP for cab A1
Remove ATP, cab, A1 5
5 Wait 20 seconds Wait 20, seconds 23 6 Set from ATP
Ready to run for A2 cab
Set ATP, Ready, A2, cab
3
7 Remove Ready to run from ATP for cab A2
Remove ATP, cab, A2 3
8 Set Ready to run from ATP for A1 cab (within 20 sec-onds)
Set ATP, A1, cab, sec-onds
20
9 Press full beam push button on drivers desk
Press beam, push, but-ton, drivers
9
10 Press full beam push button on drivers desk
Press beam, push, but-ton, drivers
9
11 Press full beam push button on drivers desk
Press beam, push, but-ton, drivers
9
12 Remove Ready to run from ATP for A1 cab
Remove ATP, A1, cab 5
Total MT 98
Table 2: Parsed test case - Half/full-beam head lights & decorative lights (single train)
under ‘options’ of ‘File’ menu (Figure 7). The ‘Add-In’ is added to the Excel as per Figure 8. Once the ‘Analysis Toolpak’ is added to the Excel, It can be found under ‘Data’ menu as in Figure 9. A regression analysis is done by selecting ‘Regression’ option from ‘Data Analysis’ menu (Figure 10). After choosing the regression method, input values of X and Y-axis are given as in Figure 11. During the regression analysis, AT of test steps are considered as a dependent variable and MT of the test steps are considered as independent variable. A graph is plotted using the first 6 values of AT and MT. Those input values (plots for the graph) are shown in Table 4. The values for AT has been taken from one of the recent executions dated ‘02-May-2017’ (Table 6). The graph (Figure 12) has only 5 plots (coordinates) instead of 6. It is because the graph has the coordinate (40,42) repeated twice which lead to overfitting (Section 5).
The input to the graph has been cross validated with the logs to ensure the correctness of the data. The obtained regression curve having the plots and regression equation are represented
Step Verb Argument MT WT Test Case Name 1 Login IDU, ”maintainer no
driving”, A1
4 0 Exterior Lights 2 Logout removing key card,
cab A1
23 0 Exterior Lights 3 Login IDU, driver, cab A1 42 0 Exterior Lights 4 Login IDU, driver, cab A2 42 0 Exterior Lights 5 Logout cab, removing key
card, A2
5 0 Exterior Lights 6 Login,wait IDU, driver, cab A1 57 20 Exterior Lights 7 Press full beam, button,
driver, desk
9 0 Exterior Lights 8 Press button, complete
driv-ing
13 0 Exterior Lights 9 Press emergency, stop
but-ton
6 0 Exterior Lights 10 Restore emergency, stop
but-ton, cab A1
3 0 Exterior Lights 11 Wait 23 seconds 23 23 Exterior Lights 12 Press button, drivers
desk,open
doors,central,operation
2 0 Passenger information
13 Close all, exterior, doors, left, side
6 0 Passenger information 14 Place card, card holder,
other cab, train-set, deactivate energy mode
20 0 Passenger information
15 Login user authorized, drive train, cab, idle
1 0 Passenger information 16 Reset passenger, counter,
IDU
1 0 Passenger information 17 Deactivate cab A2, button, door,
pillar, energy save mode
1 0 Passenger information
18 Wait train, energy save mode
2 2 Passenger information 19 Place card, card holder,A2
cab, non-leading train set
1 0 Passenger information
20 Wait energy save mode, en-tered
2 2 Passenger information 21 From MIODX, VCS, MVB
address 17, Cab A1
100 0 SITS - SAFE 22 Release DVD, handle 9 0 SAFE - Drive And
Brake Functions 23 In VCS train speed
simula-tion, extra force, 20kN
50 0 Drive and brake func-tion
24 Activate fast start, button, driver, desk
2 0 SAFE - Drive And Brake Functions 25 Activate any passenger,
emer-gency, brake handle
1 0 Drive and brake func-tion
Table 3: The parsed test steps of test cases with its MT and WT of C30 project AT MT 2 4 22 23 40 42 40 42 3 5 40 57
Figure 7: Step to find Analysis Toolpak in Excel.
Figure 8: Step to add Analysis Toolpak in Excel.
in Figure 12. With the help of obtained regression line (y = 1,2432x + 2,7252) from the graph (Figure 12), the remaining values of AT are predicted and the results are displayed in Table 5
Figure 9: Step to check the addition of Data analysis.
Figure 10: Step to select regression method for data analysis.
Figure 11: Step to provide input for the regression analysis.
without rounding off to the decimal points.
To validate our obtained AT, 8 test executions on the same SUT are monitored and the log files for the same have been analysed. Those analysed execution times from the log file are compared with the predicted times resulted from our algorithm. The comparison is presented in Table 6. In this Table 6, the predicted values from Table 5 are rounded off to their decimal points.
We analysed the log files from 8 different executions and found that the execution time of the same step varies in same system. It is evident that the real execution and our predicted time is always lesser than or equal to the MT.
A comparison of an average of AT (after rounding off of decimal points) from 8 executions and predicted execution times from our prediction algorithm are presented in Table 7. The “+” and “-” signs in Table 7 specify that the predicted time is greater and lesser than the AT respectively.
Figure 12: Regression Analysis for the sample input. MT AT Predicted Time 4 2 2,68961883 23 22 19,3767785 42 40 36,06393817 42 40 36,06393817 5 3 3,567890392 57 40 49,23801159 9 NA 7,080976638 13 NA 10,59406288 6 NA 4,446161953 3 NA 1,811347269 23 NA 19,3767785 2 NA 0,933075707 6 NA 4,446161953 20 NA 16,74196382 1 NA 0,054804145 1 NA 0,054804145 1 NA 0,054804145 2 NA 0,933075707 1 NA 0,054804145 2 NA 0,933075707 100 NA 87,00368874 9 NA 7,080976638 50 NA 43,09011066 2 NA 0,933075707 1 NA 0,054804145
Table 5: Predicted execution times using regression analysis
From the Table 7, it is evident that the predicted execution time is close to the actual time. But in some cases like step 21, 23 it is not so close. It is because of the input values (MT). For instance, consider Step 21. As we see from different executions (Table 6), the values of AT are not greater than ‘29’. The MT assigned by the testers for this the scripted version of Step 21 is not correct. It
Test step Exe 1 on 02-05-’17 Exe 2 on 24-01-’17 Exe 3 on 23-01-’17 Exe 4 on 13-10-’16 Exe 5 on 27-09-’16 Exe 6 on 20-09-’16 Exe 7 on 25-08-’16 Exe 8 on 17-08-’16 Predicted time 1 2 0 1 1 1 1 0 0 2 2 22 20 20 21 20 20 20 20 19 3 40 41 40 41 40 40 40 41 36 4 40 29 29 29 29 29 29 29 36 5 3 5 5 5 5 5 5 5 3 6 40 31 31 29 29 29 31 31 49 7 6 6 6 6 5 5 5 5 7 8 10 10 10 9 9 9 10 10 10 9 4 4 4 5 5 5 4 4 5 10 3 3 3 3 3 3 3 3 2 11 23 22 23 23 23 23 22 23 20 12 0 0 0 0 0 0 0 0 1 13 6 6 6 5 5 5 6 5 5 14 6 6 6 6 6 6 6 6 17 15 0 0 0 0 0 0 0 0 0 16 0 0 0 0 0 0 0 0 0 17 0 0 0 0 0 0 0 0 0 18 2 2 2 2 2 2 2 2 1 19 0 0 0 1 1 1 0 0 0 20 0 0 1 2 2 2 1 1 1 21 27 28 28 28 28 28 29 29 87 22 6 6 6 6 6 6 6 6 7 23 25 25 25 27 27 27 25 25 43 24 0 0 0 1 1 1 0 0 1 25 0 0 0 0 0 0 0 0 0
Table 6: Comparison of obtained predicted time and actual execution time for 8 executions of C30 project
Step Average actual time from 8 executions
Predicted time Difference between actual and pre-dicted time 1 1 2 +1 2 21 19 -2 3 41 36 -5 4 30 36 +6 5 5 3 -2 6 31 49 +18 7 6 7 +1 8 10 10 0 9 5 5 0 10 3 2 -1 11 23 20 -3 12 0 1 +1 13 5 5 0 14 6 17 +11 15 0 0 0 16 0 0 0 17 0 0 0 18 2 1 -1 19 0 0 0 20 1 1 0 21 29 87 +58 22 6 7 +1 23 27 43 +16 24 1 1 0 25 0 0 0
Table 7: Comparison of actual and predicted times
may be due to the lack of knowledge of the testers or wrong assumptions. Due to the wrong input for MT, our linear regression model resulted in a value which is not close to the AT.
5
Discussions and Limitations
The limitations of the work, along with a short discussion are listed as following:
• One of the limitations faced while using the NLTK is that we are not able to parse all the characters in a sentence correctly. For instance, some verbs in the sentences are identified as nouns. When a sentence starts with a verb, the parser identifies it as a noun. For example, in the test step ‘Wait for 23 seconds’, Wait is identified as a noun which is not correct. Therefore, our parsing algorithm is modified in such a way that the first character of a sentence will be considered as a verb and the remaining sentence will be sent to the parser to identify nouns. The obtained nouns are then used as arguments which support the main verb.
• Another limitation with NLTK is its slow performance when a large set of data is processed. There are demerits in the available tools for NLP. Among them, NLTK is comparatively better in processing and parsing natural language. One of the advantages of using NLTK is that it supports parsing multiple languages.
• We use linear regression method to predict the actual execution time of test cases by having MT. Initially, we planned to use Lagrange interpolation method. Lagrange method does not provide correct values when the intervals are unequal. But the linear regression method provides easy to calculate and predictable values close to the nodes in the graph. Therefore, we used linear regression method for predicting the actual execution time.
• One common problem encountered using regression analysis method is overfitting. In a statistical model, overfitting occurs when the model identifies noise in the training data. This will negatively impact the model for new data [27]. It normally occurs when the model has too many parameters close to our observations. Such problem will result in the poor performance towards data prediction. Because the model may over reacts even for the minor changes in the training data.
• The linear regression has five common assumptions4 such as,
– There should be a linear relationship between dependent and independent variables. – There should be no or less multicollinearity in the data used. Multicollinearity is a
condition that occurs when independent variables used in the model are not independent with each other.
– All the variables used in the linear regression analysis are expected to be multivariate normal. When the data is not normally distributed in the model, it leads to multi-collinearity.
– There should be little or no autocorrelation in the data being used for the model. Autocorrelation is a condition when the remaining data used in the linear regression analysis are not independent with each other.
– The variance around the regression line should remain same for all the values of depen-dent variable.
If the above assumptions are not satisfied, then the model will become non-linear. The regression algorithm will fail to capture the trend mathematically and lead to inefficient model5.
• The algorithm has been developed in such a way that it can read only Microsoft Word files as an input for estimation and prediction. It is assumed that the test specifications are written in Microsoft Word format. We exported the test specifications from DOORS database of C30 project into word format during data collection phase.
4http://www.statisticssolutions.com/assumptions-of-linear-regression/
• To estimate the execution time of test cases, we need MT from the Script Editor tool. To evaluate our proposed algorithm, we require scripted version of the test case. We have only limited number of test cases that have a scripted version. So, we were limited with the test cases during our evaluation. We cannot verify and obtain results for a test case which has no scripted version.
• Another limitation of our approach is that we use only action from test steps. We ignored the reactions during our process. It is because the actions follow the verb, argument pattern whereas reactions do not. During our data collection, the timings related information such as MT and AT are mapped with the verb and argument of actions. Therefore, our algorithm process only actions from the test steps.
6
Conclusions and Future work
In this thesis work, we have introduced two algorithms. One is the estimation algorithm, which is used to estimate the maximum time a system takes to execute the test cases. The other one is the prediction algorithm. which is used to predict the actual time required to execute a test case with the help of its estimated maximum time. Using our proposed algorithms, we are able to predict and estimate the maximum and actual time required to execute the manual test case from integration testing, which are written in plain English language. We used Test specification document as an input for the algorithm. Initially we have created a database that has been captured from different sources namely Test specification, log files and Script Editor tool. The database is build for the previously executed test cases. By utilizing the database, our algorithm estimates the MT and predicts the AT. A case study has been conducted in BT where both the algorithms are implemented and verified. The results are validated with the logs from the system in which the test cases are executed.
As a future work, we propose that this approach has to be fine-tuned in such a way the predicted time should be close to the AT . This can be done by choosing appropriate values in the graph that fits for the regression curve without having noise or error in the regression model. We also propose the usage of other interpolation methods such as polynomial and spline interpolation for our prediction algorithm. Our method uses only test specifications to estimate and predict the execution time. In reality, execution time for manually executing the test cases are dependent on some other factors like characteristics of system, in which it is executed and also the skills of testers. In our results section, it has been already seen that the execution time varies within a system. With respect to the testers’ skills, an experienced tester will take less time to execute a test case when compared with an inexperienced tester. These factors should also be considered during prediction and estimation work in future. In our current work, we have designed and developed a database that consists of test cases from C30 project of BT. In future, the database can be enhanced by collecting data from multiple domains.
References
[1] S. Tahvili, M. Saadatmand, and M. Bohlin, “Multi-criteria test case prioritization using fuzzy analytic hierarchy process,” in The Tenth International Conference on Software Engineering Advances (ICSEA’15), November 2015. [Online]. Available:
http://www.es.mdh.se/publications/4014-[2] S. Tahvili, W. Afzal, M. Saadatmand, M. Bohlin, D. Sundmark, and S. Larsson, “Towards earlier fault detection by value-driven prioritization of test cases using fuzzy topsis,” in 13th International Conference on Information Technology : New Generations (ITNG’16), April 2016. [Online]. Available:
http://www.es.mdh.se/publications/4263-[3] S. Tahvili, “A decision support system for integration test selection,” October 2016. [Online]. Available:
http://www.es.mdh.se/publications/4537-[4] S. Tahvili, M. Bohlin, M. Saadatmand, S. Larsson, W. Afzal, and D. Sundmark, “Cost-benefit analysis of using dependency knowledge at integration testing,” in The 17th International Conference On Product-Focused Software Process Improvement (PROFES’16), November 2016. [Online]. Available:
http://www.es.mdh.se/publications/4438-[5] S. Tahvili, M. Saadatmand, S. Larsson, W. Afzal, M. Bohlin, and D. Sundmark, “Dynamic integration test selection based on test case dependencies,” in The 11th Workshop on Testing: Academia-Industry Collaboration, Practice and Research Techniques (TAICPART’16), April 2016. [Online]. Available:
http://www.es.mdh.se/publications/4298-[6] E. Aranha and P. Borba, “Test effort estimation models based on test specifications,” in Testing: Academic and Industrial Conference Practice and Research Techniques -MUTATION (TAICPART’07), September 2007. [Online]. Available: http://ieeexplore.ieee. org/document/4343738/
[7] M. Jamro, “Pou-oriented unit testing of iec 61131-3 control software.” IEEE Trans. Industrial Informatics, vol. 11, no. 5, pp. 1119–1129, 2015. [Online]. Available:
http://dblp.uni-trier.de/db/journals/tii/tii11.html#Jamro15
[8] M. Nouman, U. Pervez, O. Hasan, and K. Saghar, “Software testing: A survey and tutorial on white and black-box testing of c/c++ programs,” in Region 10 Symposium (TENSYMP’16), May 2016. [Online]. Available: http://ieeexplore.ieee.org/document/7519409/
[9] H. K. N. Leung and L. White, “A study of integration testing and software regression at the integration level,” in Proceedings. Conference on Software Maintenance’90, November 1990. [Online]. Available: http://ieeexplore.ieee.org/document/131377/
[10] M. Utting and B. Legeard, Practical Model-Based Testing: A Tools Approach. San Francisco, CA, USA: Morgan Kaufmann Publishers Inc., 2007.
[11] E. van Veenendaal, The Testing Practitioner. UTN Publishers, 2002. [Online]. Available:
https://books.google.se/books?id=CQHkAAAACAAJ
[12] D. Draskovic, V. Gencel, S. Zitnik, M. Bajec, and B. Nikolic, “A software agent for social networks using natural language processing techniques,” in 2016 24th Telecommunications Forum (TELFOR), November 2016, pp. 1–4.
[13] N. Phaiboon and P. Seresangtakul, “Isarn dharma alphabets lexicon for natural language pro-cessing,” in 2017 9th International Conference on Knowledge and Smart Technology (KST), February 2017, pp. 211–215.
[14] A. Agarwal, C. Baechle, R. Behara, and X. Zhu, “A natural language processing framework for assessing hospital readmissions for patients with copd,” IEEE Journal of Biomedical and Health Informatics, vol. PP, no. 99, pp. 1–1, 2017.