J
I
B
S
JÖNKÖPING UNIVERSITY
E n t r y i n t o t h e S w e d i s h W h o l e s a l e
E l e c t r i c i t y M a r k e t a n d t h e E l e c t r i c i t y
P r i c e
A Strategic Behavior Analysis
Paper within BACHELOR THESIS within ECONOMICS Authors: MARTINA BHATIA 871003-2940
MATILDA EVALDSSON 870716-0605 Tutors: PROFESSOR PER-OLOF BJUGGREN
Bachelor Thesis in Economics
Title: Entry into the Swedish Wholesale Electricity Market and the Elec-tricity Price – A Strategic Behavior Analysis
Author: Martina Bhatia 871003-2940 Matilda Evaldsson 870716-0605 Tutor: Professor Per-Olof Bjuggren
Ph. D Candidate Louise Nordström
Date: 2010-06-04
Subject terms: Strategic behavior, Herfindahl-Hirschman Index, Lerner Index,
Market power, Entry barriers
Abstract
The aim of this paper is to analyze the strategic behavior of the leading firms on the Swe-dish wholesale electricity market. This thesis wishes to address the competition situation on the market and how the firms can manipulate the price in order to maximize the profits. The Swedish electricity market was deregulated in 1996 and the predicted outcome was that the competition on the market would increase. However, today’s market is highly vertically integrated with three dominating firms; Vattenfall, E.ON, and Fortum. Moreover, the mar-ket has similar characteristics of an oligopoly with high entry barriers, limited room for product differentiation, and limited access of information.
The Herfindahl-Hirschman Index and the Lerner Index show that the wholesale electricity market is highly concentrated and that market power exists.
Besides external factors that affect the electricity price, such as emission trading and the amount of water in the reservoirs, the leading firms can with their market power manipu-late the price. This can be done by preventing new entrants to enter the market which has led to underinvestment in new capacity with lower production costs.
Kandidatuppsats inom Nationalekonomi
Titel: Inträde på den svenska grossistmarknaden för el och elpriset – En strategisk beteende analys
Författare: Martina Bhatia 871003-2940 Matilda Evaldsson 870716-0605 Handledare: Professor Per-Olof Bjuggren
Ph. D Candidate Louise Nordström
Datum: 2010-06-04
Ämnesord: Strategiskt beteende, Herfindahl-Hirschman Index, Lerner Index,
Marknadsmakt, Inträdeshinder
Sammanfattning
Syftet med denna uppsats är att analysera de ledande bolagen på den svenska grossistmark-naden för el och deras strategiska beteenden. Denna uppsats granskar konkurrenssituatio-nen på marknaden och hur bolagen kan manipulera priset för att maximera vinsterna. Den svenska elmarknaden avreglerades 1996 och det förutspådda resultatet var att konkur-rensen skulle öka. Trots detta är dagens marknad till stor utsträckning vertikalt integrerad med tre dominerande bolag; Vattenfall, E.ON och Fortum. Dessutom har marknaden lik-nande kännetecken som oligopol med höga inträdeshinder, begränsat utrymme för produkt differentiering och begränsad tillgång till information.
Herfindahl-Hirschman Index och Lerner Index visar på att grossistmarknaden för el är högt koncentrerad och att marknadsmakt existerar.
Förutom externa faktorer som påverkar elpriset, såsom utsläppshandel och nivån i vatten-reservoarerna, kan de ledande bolagen med sin marknadsstyrka manipulera piset. Detta kan göras genom att hindra inträde på marknaden vilket leder till att bolagen underinvesterar i ny kapacitet med lägre produktionskostnad.
Table of Contents
1
Introduction ... 1
1.1 Background ... 1
1.2 Purpose of the study ... 2
1.3 Method ... 3
1.4 Limitations ... 3
1.5 Previous Studies... 3
1.6 Outline of the thesis ... 4
2
The Swedish Wholesale Electricity Market ... 5
2.1 Participants on the market ... 5
2.1.1 Nord Pool ... 5 2.1.2 Producers ... 6 2.1.3 Suppliers ... 6 2.1.4 Network Owners ... 6 2.1.5 Consumers ... 6 2.2 Price Setting ... 7
2.2.1 Supply and Demand ... 7
2.3 Market Features ... 8
2.4 Emission Trading ... 9
2.5 Investment Opportunities and Future Production ... 10
2.6 Limitations in the Transmission System ... 11
3
Theoretical Framework ... 13
3.1 Marginal Cost Pricing Model ... 13
3.2 Strategic Behavior ... 14
3.2.1 Market Power ... 14
3.3 Determining Market Concentration and Market Power ... 15
3.3.1 Herfindahl-Hirschman Index ... 15
3.3.2 Lerner Index ... 16
3.4 Entry Barriers ... 16
3.4.1 Predatory Pricing ... 17
3.4.2 Limit Pricing ... 17
3.4.3 Investments to Lower Production Costs ... 17
3.5 Game Theory ... 18
3.6 Best-Practice Techniques ... 18
4
Empirical Results ... 20
4.1 Calculating Herfindahl-Hirschman Index ... 20
4.2 Estimating the Lerner Index ... 21
5
Critical Analysis ... 23
5.1 Dominance on the Electricity Market ... 23
5.2 High Degree of Vertical Integration ... 23
5.3 Underinvestment ... 24
5.4 Underuse Production with low Marginal cost ... 25
5.5 Entry into the Swedish Electricity Market ... 27
5.5.1 Game Theory on Entry ... 28
6
Concluding Remarks ... 34
References ... 37
Appendices ... 40
Appendix 1: Average Variable Cost per firm ... 40
Appendix 2: Market Shares ... 41
Appendix 3: Lerner Index ... 42
Graphs Graph 1 The Principle of Pricesetting on the Spot Market ...8
Graph 2 An Effective Market given no Market Power…...13
Graph 3 Best-practice Tecniques…...19
Graph 4 Underinvestment and the Supply curve...24
Graph 5 Strategic Hydroelectric Power Production...26
Graph 6 Profits and Emission Rights…...27
Graph 7 Investments and Strategic Behavior...32
Figures Figure1 The System Price of Electricity...1
Figure 2 Electricity Production in Sweden by Power Type...9
Figure 3 Incumbent vs. Entrant...29
Figure 4 Production Gap...31
Tables Table 1 Herfindahl-Hirschman Index...20
Table 2 Variable Production Cost by Power Type...21
Equations Equation 1...15
Equation 2...16
1
Introduction
“Leadership is a potent combination of stategy and character. But if you have to be without one, be without the strategy.”
Norman Schwarzkopf
1.1
Background
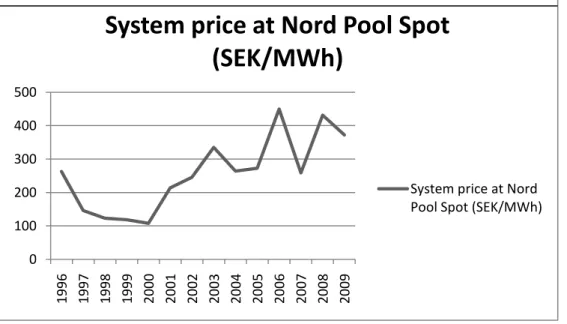
The Swedish electricity market was deregulated in January 1996. The idea behind the dere-gulation was to subject the market to competition. According to basic microeconomic theory, a market characterized by perfect competition will yield the highest welfare to the society with an effective production and the lowest possible price (Varian 2005). The out-come of the deregulation has not been as expected. Instead, the competition on the market has become weaker and the prices have risen. Between the years of 1996 and 2006 the market share for the three largest electricity producers increased from 82 percent to 87 per-cent (Energy Market Inspectorate 2007). Immediately after the deregulation, the electricity prices began to fall and kept falling until the year of 2000 where the trend reversed. How-ever, since then, the price has increased steadily with minor fluctuations, as can be seen in figure 1(Nord Pool Spot AS 2010).
Figure 1. The System Price of Electricity
Source: Data retrieved from Nord Pool 2010
0 100 200 300 400 500 1996 1997 1998 1999 2000 2001 2002 2003 2004 2005 2006 2007 2008 2009
System price at Nord Pool Spot
(SEK/MWh)
System price at Nord Pool Spot (SEK/MWh)
In the public debate, many explanations to the high electricity prices have been put for-ward. Besides external factors such as emission trading and the amount of water in the re-servoirs many argue that it is due to the market power the three electricity giants Vattenfall, E.ON, and Fortum possess. Together they stand for 79 percent of the total electricty pro-duction in Sweden (Swedenergy AB 2008). Previous studies, made by for example Fri-dolfsson and Tangerås 2009, have been made on the issue of whether the electricity giants practice market power, but no evidence have been found to support that claim. Neverthe-less, one cannot disregard the fact that there are few competitors on the market and high vertical integration. Because of the leading firms’ large market shares, they have the ability to act strategically in order to eliminate competition and increase the prices.
Some of the factors that affect the electricity price can be manipulated. Based on the degree of market power, the largest firms can; deter entry, push out small rivals, underuse the base electricity, underinvest in new capacity, and vertically integrate. All of which can lead to a higher market price. One main reason for the lack of competition on the market is the problem of entry. It is difficult for new firms to enter due to the advantages the incum-bents hold. Therefore, entry is associated with a high risk of a potential large loss.
According to a survey conducted by SEB, one fifth of the Swedish households are having difficulties paying their electricity bills because of the markets’ high prices (Dagens Industri 2010). During the harsh winter of 2009 the price of electricity increased from a normal lev-el in this period of 35 öre/kWh to 261 öre/kWh (Dagens Nyheter 2009). Are these recur-ring price fluctuations a sign of the ineffectiveness of the deregulated market? Or are there other explanations?
This thesis wishes to address these questions by looking closer at the competition situation on the Swedish electricity wholesale market. Is it possible and lucrative for firms to practice market power? Furthermore, what kind of strategic behavior can the firms exercise in order to manipulate the price?
1.2
Purpose of the study
The purpose of this thesis is divided into two parts;
The purpose is to analyze the strategic behavior of the largest wholesalers in the electricity market that can be used to manipulate the price.
The purpose is to analyze how the incumbent firms can deter entry in order to maximize the profits.
1.3
Method
This paper uses strategic behavior theory based on microeconomic principles as an analyti-cal framework. The data used in the analyti-calculations will be based on quantitative secondary data and is primarly collected from the Swedish Energy Agency, SCB, and Swedenergy. Moreover, the microeconomic theories will be retrieved from books on industrial organiza-tion and environmental economics.
The Herfindahl-Hirschman Index, measuring industry concentration, is calculated using data on installed electricity production capacity in Sweden. In addition, the degree of mar-ket power is calculated through the Lerner Index by comparing individual firms’ marginal cost with the market price.
1.4
Limitations
Our strategic behavior analysis covers the period after 1996 when the market was deregu-lated. The empirical calculations are based on data most up-to-date from 2009. The mar-ginal cost values are based on an estimation of the variable costs of production per power type. These values are used when calculating the Lerner Index and are only estimations, since the actual values are difficult to obtain.
1.5
Previous Studies
According to Fridolfsson and Tangerås (2009) there is no evidence of systematic exploita-tion of system level market power on NordPool. Local market power arising from trans-mission constraints seems to be more problematic. Hjalmarsson (1999) shows through an econometric analysis that no market power exist on Nord Pool. However, he claims that there might be some regional market power present but it is not detected in his study. Johnsen, Verma, and Wolfram (1999), show proof of regional market power in the Nor-weigan electricity market.
In contrast to previous studies made on market power on the Nordic electricity echange NordPool, this thesis will focus on the Swedish electricity wholesale market. Furthermore, this thesis will explore how firms may act to maximize their profits. Fridolfsson and Tan-gerås (2009) found that firms can affect the price without short term deviation from the
marginal cost price setting. However, they concluded that a more thorough analysis is re-quired in order to determine if the firms practice market power to affect the price setting.
1.6
Outline of the thesis
The following chapter will provide the reader with basic knowledge about the Swedish electricity market and its participants. Chapter 3 presents the theoretical background that is necessary for the empirical results and the critical analysis. Chapter 4 contains the empirical result from the calculations of the Herfindahl Index and the Lerner Index. The critical analysis in chapter 5 will examine the potential strategic behavior of firms connected to chapter 2 and 3. Lastly the study is summarized in the final chapter.
2
The Swedish Wholesale Electricity Market
This chapter aims to give basic knowledge about the Swedish electricity market and its structure.The infor-mation presented in this chapter provides the reader with the necessary facts about the market that is re-quired in order to understand the rest of the thesis.
Since the deregulation in 1996, the Swedish electricity market has experienced big changes. The market is now exposed to competition and the customers can choose freely between electricity suppliers. The Swedish market is integrated with the rest of the Nordic countries and is moreover becoming integrated with the rest of Europe, in particular with Poland and Germany. Trade with Finland, Russia, and the Baltic countries is already taking place. All the Nordic countries except Iceland participate in the trade at Nord Pool (Swedish Energy Agency 2006).
2.1
Participants on the market
An electricity producer produces electricity which they distribute through the electricity grid. An electricity producer owns the production facility and sells electricity to electricity firms, Nord Pool, or directly to final consumers. A significant feature of the Swedish elec-tricity market is that firms control several steps in the value chain. They can be elecelec-tricity producers, grid owners, and electricity suppliers. The price on electricity from the produc-ers is set on the Nordic electricity exchange Nord Pool.
2.1.1 Nord Pool
Sweden and Norway experienced a deregulation of their electricity markets in 1996 and created the common electricity market called Nord Pool. In 1998 Finland was integrated in the Nordic power exchange area followed by Denmark that was fully integrated in 2000. Nord Pool was the world's first multinational exchange for trading electric power. The ex-change has over 400 members which consist of producers, large electricity costumers, elec-tricity traders, and brokers (Nord Pool ASA 2010).
Nord Pool ASA is owned by the Norwegian system operator Statnett and Swedish opera-tor Svenska Kraftnät with 50 percent each. Nord Pool provides market places for trading in physical and financial electricity contracts in the Nordic countries. Furthermore, the ex-change also provides a carbon market which offers standardized contracts for emission al-lowances and carbon credits (Nord Pool ASA 2010).
The Nordic national grid firms own Nord Pool Spot ASA and its subsidiaries; Nord Pool Finland Oy and Nord Pool Spot AB. Svenska Kraftnät and Statnett own 30 percent each whereas Fingrid and Energinet.dk own 20 percent each. Nord Pool Spot ASA operates the physical market and the financial market (Nord Pool ASA 2010).
2.1.2 Producers
The three largest electricity producers in Sweden are Vattenfall, E.ON, and Fortum. To-gether they corresponded to 79 percent of the total production in 2009 which implies a high market concentration. In terms of market power these three are followed by Statkraft Sverige and Skellefteå Kraft (Swedenergy AB, 2009). Vattenfall is owned 100 percent of the Swedish government (Vattenfall AB 2010), the Finnish government owns 51 percent of Fortum (Pohjanpalo 2010), while E.ON is privately owned (E:ON 2010).
2.1.3 Suppliers
The electricity suppliers sell electricity to final consumers. 124 electricity firms were active during 2008. This number can be compared to 220 active firms in 1996. The reduction in firms on the market can be explained by mergers and takeovers of the small firms by the larger firms Vattenfall, E.ON, and Fortum. However, there are approximately 20 firms that are independent of the large energy corporate groups. Vattenfall holds almost 30 percent of the supplier market followed by E.ON with 12 percent and Fortum with 8 percent (Abra-hamsson et al. 2008).
2.1.4 Network Owners
The network owners are the participants that physically transfer the electrical energy from the production facilities to the consumer through a grid. This is achieved via the national grid, the regional networks and the local networks, which are all owned by different net-work firms. These can be viewed as natural monopolies since it does not make sense to have several power lines. Svenska Kraftnät owns the national grid whereas the largest elec-trical energy producers and municipalities mutually own the regional networks and the local networks (Svenska Kraftnät 2010).
2.1.5 Consumers
The final electricity consumers can consist of everything from industries to households. In order for the consumers to be able to buy electricity they must have an agreement with an
electricity supplier. Since the deregulation, consumers can choose freely between electricity suppliers (Svenska Kraftnät 2010).
2.2
Price Setting
2.2.1 Supply and Demand
The price on the Swedish electricity market is based on the balance between bids and offers from all market participants. Elspot is a physical market at Nord Pool which provides a place where hourly electricity contracts are traded daily for physical delivery in the next day’s 24 hour period. All participants on the spot market on Nord Pool specify how much electricity they want to purchase and sell depending on the price. An implicit auctioning takes place and the participants can employ three types of biding strategies; hourly bids, block bids, and flexible hourly, which all cover some or all of the 24 hours of the next day (Nord Pool Spot ASA 2010).
During a 24 hour period, the bids are aggregated and then converted into supply and de-mand curves. The dede-mand curve consists of the total selling bids of the participants at one specific price and quantity and the supply curve consists of the total buying bids. The equi-librium is where the values of price and quantity for which quantity supplied and quantity demanded are equal i.e. the intersection between the market’s supply curve and demand curve set the price, see graph 1 (Swedish Energy Agency 2006).
Graph 1. The Principle of Price Setting on the Spot Market
Source: Swedish Energy Agency 2006
The equilibrium price is set by the variable production cost for the most expensive produc-tion facility that is required in order to meet the demand. The short-run marginal cost of each plant must be covered. As shown in graph 1, the real marginal cost is lowest for wind power and thereafter for hydroelectric power. It is however important to note that the real marginal cost can during some periods exceed the direct variable cost. After hydroelectric power comes the slightly more costly nuclear power followed by combined power and heating. Power from coal and oil has very high variable costs. Moreover, power from gas turbines has the highest variable cost. The three most costly production methods are used as a reserve and are traded when the cheaper production methods are not able to cover the demand (Swedish Energy Agency 2006)
2.3
Market Features
A particular feature of the Swedish electricity market is that the production is to a large ex-tent based on hydroelectric power which implies that it is dependent on rainfall. The hy-droelectric power constitutes of 49 percent of the electricity production. Together with the nuclear power they account for almost 87 percent. The remaining 11 percent is produced
by thermal power. Moreover, only 2 percent is produced by wind power stations, see figure 2 (Swedenergy 2009).
Figure 2. Electricity Production in Sweden by Power Type 2009
Source: Data retrieved from Swedenergy 2009.
The dependence of the hydroelectric power makes the Swedish electricity market different from other electricity markets. The production is limited by the size of the hydroelectric power plants reservoirs, implying that it must be allocated evenly over time. The more the reservoirs are drained during the fall, the less electricity they can produce during the winter. During a dry year the hydroelectric power cannot meet the demand, therefore plants with higher marginal costs, such as coal power plants, must be used. The reservoirs have there-fore a large impact on the electricity prices, since a high water reserve can lower the price significantly (Energy Market Inspectorate 2007).
The electricity commodity and its price development differ from other commodities be-cause of its special features. One special feature is that electricity is a non-storable good that faces extreme capacity constraints. The water reservoir can, however, to some extent be adapted to the demand. Futhermore, electricity is a homogenous product with few di-rect substitutes (Energy Market Inspectorate 2007).
2.4
Emission Trading
Emission trading influences the electricity price considerably. One emission right gives the right to release 1 ton of carbon dioxide emissions into the atmosphere. Emission rights makes polluters face two alternatives. They can either buy more permits in order to keep on producing “dirty” electricity, or they can change to cleaner production methods to avoid
Hydroelectric Power Nuclear Power Other Thermal Power Wind Power
costs. Emission trading increases the marginal cost of combined heating and power plants based on fossil fuels and has a direct impact on high electricity prices (European Comission 2009).
Emission trading is an administrative approach used to control pollution by providing eco-nomic incentives to reduce emissions. In 1992, 150 countries signed the United Nations Framework Convention on Climate Change (UNFCCC). The main goal of the agreement is to reduce greenhouse gas emissions in the atmosphere. In order to achieve the goals stated in the UNFCCC, the Kyoto Protocol was created as an amendment. The Protocol was initially adopted on 11 December 1997 in Kyoto, Japan and came into force on 16 February 2005. The major features of the Kyoto Protocol is that it sets binding forces for 37 industrialized countries and the European Union to reduce their greenhouse gas emis-sions by 5,2 percent in average between the years of 2008-2012 from the 1990 level (UNFCCC 2008a).
The total reduction of emissions in the European Union is set to be 8 percent. Within this boundary, Sweden has been given the right to increase their emissions with 4 percent. Swe-den has however not chosen to take advantage of this opportunity and has adopted a cli-mate strategy that involves a reduction of the greenhouse gas emissions with at least 4 per-cent during the period 2008-2012 (European Comission 2009).
2.5
Investment Opportunities and Future Production
The European Union’s goals to reduce greenhouse gas emissions and to increase the ener-gy supply from renewable sources have affected the development on the Swedish electricity market. Most of the electricity that is produced today is environmental friendly. The in-vestments are directed to production in combined heating and power plants based on bio fuels and wind power stations. The hydroelectric power is estimated to expand with 10 TWh in the Nordic region, however only a fraction of this will be produced in Sweden. To expand the hydro power is economically attractive and possible; yet political decisions hinder this development. Expansion in nuclear power production can be an alternative to renewable energy sources since it is virtually free from carbon dioxide emissions. However, nuclear power is a disputable production method that has been subjected to many com-plaints because of its unsecure nature and its deadly nuclear waste. Consequently, political
has already closed down two nuclear power plants. Nevertheless, the centre-right alliance parties have made it possible to replace existing Swedish nuclear power with new nuclear power, according to the market’s condition, as a complement to renewable energy alterna-tives. Efforts will be made in making the power more effective and to increase the produc-tion in already existing plants. In addiproduc-tion, Finland is planning to build two more reactors that will produce electricity for all the Nordic countries (Elforsk 2009).
Since emission trading makes it unprofitable to invest in the expansion of gas turbines, only some of the industrial back pressure power based on coal or gas and combined heat and power based on coal will exist in the year of 2020. Furtermore, concentrated solar power is too expensive for conventional power production although it is a useful technique for pro-duction in places where it is too expensive to connect to a power grid. However, wave power looks as if it has great potential to become a competitive energy source in the future. It is a production method with a low production cost which will have a positive effect on the prices (Elforsk 2009).
2.6
Limitations in the Transmission System
The Swedish electricity market is well integrated with the other Nordic countries and is be-coming more integrated with the rest of Europe. In order for the electricity trade to be ef-fective, a well functioning transmission system, inside and between the countries, is in or-der. The amount of electricity transferred depends mostly on variations of the supply of water in the reservoirs and the price differences between the areas dominated by hydroelec-tric power and those by thermal power. Transmission capacity constraints “bottlenecks” emerge when the capacity does not meet the demand for the desired trade.
There are three different methods used to handle these recurring bottlenecks. Capacity constraints that can be foreseen in the planning phase can be dealt with by dividing the market into different price areas, implying that the price in a deficit area will be higher than in a surplus area. If the bottlenecks emerge during the production phase, Svenska Kraftnät orders an increase of production in the deficit areas and a decrease of production in a sur-plus area. Costs associated with this accrue the Svenska Kraftnät and sends signals that the power grid needs to be reinforced. Another method used to handle bottlenecks is to limit imports or exports. In order to keep Sweden as a single price area with a maintained bal-ance in the power grid, Svenska Kraftnät frequently limit the exports to Denmark and Germany (Energy Market Inspectorate 2009).
Investments to reinforce and expand the transmission system is limited since all interna-tional transmission capacity has to be partly government owned (Fridolfsson & Tangerås 2009).
3
Theoretical Framework
This theory chapter examines the relevant basic theoretical background that is required for the following analysis. The chapter will start by presenting the price setting mechanism on the market, which is followed by explaining strategic behavior and different ways of practicing it. The Herfindahl-Hirschman Index and the Lerner Index will also be presented. Furthermore, techniques to deter entry and theories about invest-ment decisions are explained.
3.1
Marginal Cost Pricing Model
On a free market with perfect competition price is regarded as given by customers and suppliers. Profit maximizing producers will choose to produce a quantity that equate price and marginal cost. The market price is established at the intersection of the aggregate de-mand and aggregate supply curve. The price reflects all information on the market and sends signals to producers and consumers about the production costs and how the con-sumers value the commodity. The production-, consumption-, and investment decisions are synchronized through the price. (ECON 2006).
Price
Quantity
Graph 2. An Effective Market Given no Market Power
Source: Nicholson 2005
Graph 2 illustrates an effective market with perfect competition. At the competitive equili-brium (Q*) the sum of the consumer surplus, the dotted area, and the producer surplus, the shaded area, are maximized. This competitive output will be achieved when price is at
G E D S F P1 A P* B Q1 Q* 0
the level P*. If the output is less than Q*, say Q1, there will be a deadweight loss of con-sumer and producer surplus given by the area FEG resulting in that the price will increase to P1. This deadweight loss is equivalent to the total welfare loss of society. The conclusion is that the competitive equilibrium gives the highest welfare to the society, without the presence of market power (Nicholson 2005).
3.2
Strategic Behavior
Strategic behavior is a set of actions a firm takes to increase its own profits by influencing the market environment. In particular in the early stages of liberalization, existing firms are more likely to set up barriers that make it difficult for new actors to enter the market. The equilibrium in strategic behavior depends on what one party believes the other party will do in a particular situation, same as in oligopoly. Strategic behavior can be divided into two different types; cooperative and non-cooperative. Cooperative strategic behavior implies that firms collaborate and coordinate their actions and limit their competitive responses. In non-cooperative strategic behavior there is no collaboration. Each firm choose a profit maximizing strategy being aware of interdependency. Two conditions must be met for a non-cooperative strategy to be successful:
1. The firm must have an advantage over the rivals in such a way that they can act be-fore their rivals can, a so called first mover advantage.
2. The firms must have a commitment to their behavior, meaning they have to follow their strategy regardless of their rivals.
(Carlton & Perloff 2005)
3.2.1 Market Power
If a firm holds market power and acts strategically it can set a price above the competitive level, control the total output, or exclude competitors from entering the market. All of which leads to a welfare loss by the society (Carlton & Perloff 2005).
On a well functioning market with perfect competition, the participants take the price for granted and assume that it reflects all relevant market information on the market. A pro-ducer therefore increase its production until the cost of producing one more unit, the mar-ginal cost, is equal to the price. However, a firm with market power takes into considera-tion that increased producconsidera-tion leads to a decreased price. This implies that the firm
increas-es its production until the marginal revenue is equal to the marginal cost. Since the firm now produces less than in a well functioning market, the market power results in that the price exceeds the marginal cost. The most common measurement of market power is therefore based on the difference between the price and the marginal cost. However, firms can affect the electricity price without short-term variations from the marginal cost pricing. The firms can underinvest in new capacity and thereby practice long run market power. The high degree of vertical integration on the Swedish electricity market can, in addition, give room to practice buying power. Finally, the largest electricity producers can find it profitable to underuse some of the production methods with low marginal costs, such as the nuclear power, in order to drive up the prices (Fridolfson & Tangerås 2009).
In the long run, one way to practice market power is to vertically integrate and thereby in-crease profits. However, vertical integration can also be to the consumers advantage since it may reduce the price steps from the first production phase to the final consumer. A verti-cally integrated firm is one that participates in more than one successive stage of the pro-duction or distribution of goods and services. For example, a sole supplier of a vital input may vertically integrate forward, buying the production firm, to increase its profits. Simi-larly, a firm may try to buy the sole supplier in order to receive combined profits. Vertical integration may result in elimination of competition and foreclosed entry (Carlton & Per-loff 2005).
3.3
Determining Market Concentration and Market Power
3.3.1 Herfindahl-Hirschman Index
The Herfindahl-Hirschman Index (HHI), is a measurement for determining market con-centration. The firms’ market shares are used to calculate the level of competition on the market. By summing the squares of the percentage market shares held by the firms, z in equation 1, an index is obtained. (Carlton & Perloff 2005).
(1)
The value of the index shows the concentration of the market. If the index is above 0,181
the market is highly concentrated, if the index ranges between 0,10 and 0,18 the market concentration is moderate, and if the value of the index is below 0,10 the market is not
1 According to the Horizontal Merger Guidelines developed by the US Department of Justice and the Federal
concentrated. A small index indicates that the industry is competitive and that there are no dominant players (Carlton & Perloff 2005).
3.3.2 Lerner Index
Lener Index is a tool to measure market power by calculating the relationship between the firm’s marginal cost and its price setting. Since it is hard to obtain the marginal cost for every firm due to their unwillingness to publish it, the Lerner Index is an alternative me-thod to appreciate the cost (Carlton & Perloff 2005).
(2)
Lerner Index is defined in equation (2), where P denotes the market price, and MC is the marginal cost of each firm. On a market with full competition, the Lerner Index is equal to zero. On the contrary, if the firm has monopolistic power the index will be positive (Carl-ton & Perloff 2005).
3.4
Entry Barriers
Entry barriers are defined as restrictions that allow the incumbents to raise the prices over the marginal cost of new capacity without the risk of new players establishing on the mar-ket. It can also be defined as the existing cost advantages that the already established firm has. The cost advantages can be for example experiences, strategic position, or patents. An entry barrier is present if the incumbent has a strategic head start because of its long active time on the market. For the entrepreneurs that want to enter the market this can imply a large sunk cost since they have to reach the establishment level of the incumbent. If large sunk costs are associated with entry and if entry is unsuccessful, the entrant’s losses are large. In a case with large sunk cost, threats of strategic behavior may prevent new entry (Carlton & Perloff 2005).
The most common strategic behavior that may affect a firm’s entry is a high degree of ver-tical integration on the market. Verver-tically integrated firms might refuse to deliver commodi-ties to other firms because of their obligation to deliver to firms within its own corporate group. Moreover, government restrictions can also pose a threat to entry. The government might demand a license, certificate, or product registration. These restrictions do not often imply a cost for the firm, they can, however, take a lot of time to obtain (Carlton & Perloff 2005).
3.4.1 Predatory Pricing
A firm engages in predatory pricing when the price setting of a larger firm pushes out the smaller rivals from the market. In order to do so, the larger firms first lowers their prices to drive their smaller competitors out of business and then raise the prices again when the competitors have left the market. The larger firms are in this case willing to obtain short-run losses to obtain long-short-run gains. The predatory pricing strategy can only be successful if the larger firm is able to survive low prices longer than their rivals. The strategy also has to be so convincing that the rivals believe that the larger firm actually has the ability to follow through with the strategy (Carlton & Perloff 2005).
For the strategy to be completely successful new entrants have to believe that it does not pay to enter the market at all, because of the incumbent pricing behavior. When this belief is reached by potential entrants, the larger firms can raise the prices again (Carlton & Per-loff 2005).
The electricity giants can practice predatory pricing by utilizing the cheapest methods of production such as wind-, hydro-, and nuclear power, at a maximum capacity. By doing so the market price will be lowered since the production methods with higher marginal costs are no longer used. The lower electricity price pushes out the smaller competitors, since they cannot compete with the low price.
3.4.2 Limit Pricing
While predatory pricing is used to push out existing rivals from the market, limit pricing is used to prevent rivals to even enter the market. A firm practice limit pricing if it sets its price and output so that there is not enough demand left for another firm to enter the mar-ket profitably. The limit price is the price that the entrant would face when entering the market. The price is often lower than the average cost of production, or just low enough to make the entry not profitable. The potential entrant believes that the incumbent firm will not change its output after new firms enter. Limit pricing is only effective under incom-plete information where the entrants believe that the action of the incumbent is credible (Carlton & Perloff 2005).
3.4.3 Investments to Lower Production Costs
In models of oligopoly behavior, the market outcome depends on the costs of the compet-ing firms. The costs of the individual firms are part of the environment that determines the
outcome of the competition among the firms. An incumbent firm can manipulate the mar-ket environment to its advantage. Firms with advantage can for example invest in R&D in the previous period to lower their costs in the later period, or they can lower the cost in a later period through learning by doing in a previous period. Since in oligopoly models a firm’s profit depends on its costs relative to the costs of its rivals, a firm can increase its own profits if it can raise the entrants’ costs, relative to its own. This kind of behavior re-quires market power (Carlton & Perloff 2005).
3.5
Game Theory
Any situation in which firms must take strategic choices, and in which the final outcome will depend on what each actor chooses to do, can be viewed as a game. Game theory can be used in models where there are few players with strategic issues. A game consist of play-ers, strategies, and payoffs. The games can be cooperative, where the players make binding agreements, or noncooperative. The players have a set of actions to choose from, where each action has a different outcome. The actions of the players are viewed as strategies, since the actions that are chosen are the ones with the most beneficial outcome to each in-dividual player. The payoffs that come from the strategies are the final returns to the play-ers. The payoffs will be different depending on what strategy that has been used (Nichol-son 2005).
3.6
Best-Practice Techniques
Salter (1966) introduced a theoretical framework referred to as the best-practice technique in order to analyze the relationship between productivity and technical change. Best-practice techniques are defined as “the technique at each date which employ the most re-cent technical advances, and are economically appropriate to current factor prices” (Salter 1966). The main idea is that the plants that are most up-to-date should be used in order for the market to experience the lowest cost and thus the lowest price.
Salter (1966) analyses the industry when the outmoded plants experience a higher operating cost due to age, leading to their costs exceeding the market price. This in turn makes the older plants no longer profitable and therefore they need to be scrapped. The production gap is then filled by new plants with a lower operating cost. This can be illustrated with graph 3.
Graph 3. Best-Practice Techniques
Source: Salter 1966
The current price (Pn) is composed of average variable cost (AC) and average fixed cost (CD) of best practice plants constructed in the period n. Plants built in period n-t have an average variable cost (BF) that is almost equal to the price. In this period the industry is in a momentary equilibrium, no further plants will be built and no further plants will be
scrapped. However, when capital equipment deteriorates the outmoded plants’ operating costs will rise above the price. In period n+1 a new best practice technique with average variable cost A1C1, will be constructed. Plants built with this technique will lower the price to Pn+1, where profits are normal. When this occurs the outmoded plants will be scrapped so that the industry output becomes A1B1.
This process can either come from new investment decisions or replacement decisions. En-trepreneurs can take advantage of this situation by building new plants which expand out-put, drive down the price, and thus force the outmoded plants to be replaced (Salter 1966). Price and costs D D1 C1 A1 A C B1 B Pn Pn+1
AVCn+1 AVCn AVCn-t
F
Output
ATCn+1
4
Empirical Results
This chapter is devoted to present the empirical results of the calculations of the Herfindahl-Hirschman In-dex and the Lerner InIn-dex in order to determine market power.
4.1
Calculating Herfindahl-Hirschman Index
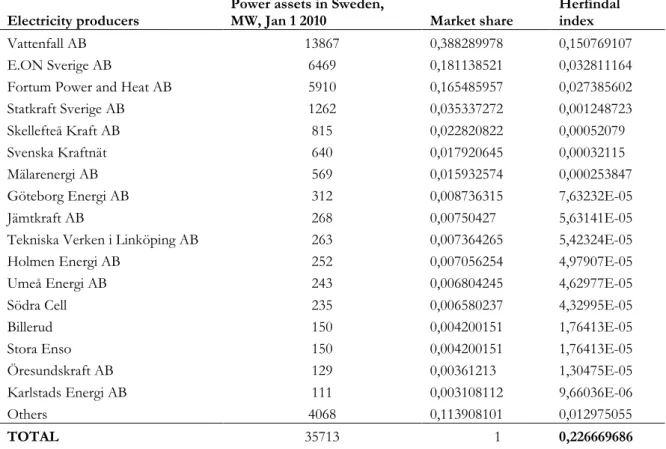
To calculate the Herfindahl-Hirschman Index, the market shares for the different electricity producers based on their production had to be found. The percentage share of the total power assets per firm was calculated and thereafter equation (1) was used to find the Her-findahl Index. The index obtained was 0,226669686 implying that the electricity market is highly concentrated since 0,226669686 > 0,18. As explained in section 3.3.1, an index above 0,18 denotes a concentrated market. A highly concentrated market implies that few participants hold large market shares. The obtained Herfindahl Index for the Swedish elec-tricity market can be found in table 1.
Electricity producers Power assets in Sweden, MW, Jan 1 2010 Market share Herfindal index
Vattenfall AB 13867 0,388289978 0,150769107 E.ON Sverige AB 6469 0,181138521 0,032811164 Fortum Power and Heat AB 5910 0,165485957 0,027385602 Statkraft Sverige AB 1262 0,035337272 0,001248723 Skellefteå Kraft AB 815 0,022820822 0,00052079 Svenska Kraftnät 640 0,017920645 0,00032115 Mälarenergi AB 569 0,015932574 0,000253847 Göteborg Energi AB 312 0,008736315 7,63232E-05 Jämtkraft AB 268 0,00750427 5,63141E-05 Tekniska Verken i Linköping AB 263 0,007364265 5,42324E-05 Holmen Energi AB 252 0,007056254 4,97907E-05 Umeå Energi AB 243 0,006804245 4,62977E-05 Södra Cell 235 0,006580237 4,32995E-05 Billerud 150 0,004200151 1,76413E-05 Stora Enso 150 0,004200151 1,76413E-05 Öresundskraft AB 129 0,00361213 1,30475E-05 Karlstads Energi AB 111 0,003108112 9,66036E-06 Others 4068 0,113908101 0,012975055
TOTAL 35713 1 0,226669686
Table 1. Herfindahl-Hirschman Index
4.2
Estimating the Lerner Index
The marginal cost is the cost of producing one extra unit of output, the production cost per kWh. Hence, we assume that the marginal cost is equal to the average variable cost. Furthermore, the cost is assumed to be constant. In the available data there is an electricity source referred to as “Other thermal power”. This category includes combined heating and power, cold condensing power based on coal and oil, and gas turbines. Due to lack of data, a mean value of the cost of fossil production methods has been calculated. The average va-riable production costs are approximated values and are presented in table 2.
Variable production cost by power type (öre/kWh)
Wind Power 7
Hydro electric power 10
Nuclear power 17
Other thermal power 82
Table 2. Variable production cost by power type
Source: Vattenfall 2009
The marginal cost function of each firm is very hard to acquire because of firms’ unwilling-ness to share the information. For that reason, to obtain the marginal cost for each firm several steps are required. Firstly, an estimation of the total variable cost per firm has been calculated based on the approximated variable production cost by power type, multiplied by each firms production by power type. Thereafter the total variable cost per firm was di-vided by the total production for each firm. From these calculations we obtained the aver-age variable cost per firm, see Appendix 1.
The Lerner index for the entire Swedish electricity market is based on the following equa-tion:
(3)
where w is the weight of production per firm of the total production in Sweden, hence the market shares, P is the market price, and MC is the marginal cost per firm. To proceed with the calculation of the Lerner Index, information on the electricity price had to be obtained. The price used is the system price for the year of 2009 namely 37,22 öre/kWh retrieved from Nord Pool (2010).
The calculated values of the Lerner Index can be seen in Appendix 3 and adds up to an overall market index of 0,214353348. From the Lerner index one can conclude that the firms on the market have the capability to practice market power since the obtained index is above 0, where 0 indicates no market power and 1 complete monopoly.
5
Critical Analysis
The theoretical background and the empirical result lead us to the critical analysis presented in this chapter. Here the strategic behavior of the firms are examined and presented in words and figures.
5.1
Dominance on the Electricity Market
The empirical results show that the Swedish electricity market has similar characteristics of an oligopoly. The market is highly concentrated, has high entry barriers, limited access of information, and limited room for product differentiation. In 2008, the three largest elec-tricity producers; Vattenfall, Fortum, and E.ON corresponded to approximately 79 percent of the total production (Swedenergy 2008). This implies that the dominating firms have the power to influence the price, meaning that the large firms can practice market power. The large profits of the leading firms on the Swedish electricity market indicates low com-petition. In 2009, Vattenfall showed a net turnover of 205 407 million SEK where 13 448 million was net profit. 5, 2 billion SEK was directly delivered to the owner, the government (Vattenfall AB 2009). To practice market power on the electricity market is easier than in many other markets since electricity is a homogenous product with few direct substitutes.
5.2
High Degree of Vertical Integration
A significant feature of the Swedish electricity market is that firm’s control several steps in the value chain. They can be electricity producers, grid owners, and electricity suppliers. The market share for the three largest electricity producers, in relation to the total amount of electricity production in Sweden, have between the years of 1996 to 2006 increased from 82 percent to 87 percent. In 2006, Vattenfall alone had 45 percent of the market shares in the electricity production market, whereas Fortum had 19 percent and E.ON 21 percent Since the deregulation, the number of electricity suppliers participating in the market has decreased by half the amount. In 2006, there were 130 electricity firms competing on the market, however, only approximately 20 of these were independent from Vattenfall, E.ON, and Fortum (Energy Market Inspectorate 2007).
A fundamental condition of an effective rivaling market is that it exists a reasonable degree of uncertainty with the producers regarding the supply and demand situation. However, there is cooperation between nuclear- and- hydro power producing firms which allows them to exchange sensitive information and thereby reduce the level of competition. Since the three major firms co-own many smaller firms, the uncertainty that is required is limited.
According to the European commission’s report on the Swedish electricity market, the co-operation between the dominating players on the market is the largest threat to the compe-tition and creates an incentive for the firms to act strategically (Swedish Compecompe-tition Au-thority 2009).
5.3
Underinvestment
Graph 4. Underinvestments
Source: Own work based on information from Vattenfall AB 2009
Graph 4 illustrates the situation where only one producer of nuclear power is active on the market. The producer faces a decision on whether to invest in new capacity or not. Consid-er the supply and demand situation of the Swedish electricity market. WhConsid-ere the demand curve, denoted D, intersects with the supply curve, denoted S, the market price P* is estab-lished. Suppose a nuclear power producer decides to expand its production capacity. The area between b and c is the producer’s initial capacity which has now expanded to bd. With constant marginal cost, this result is a rightward shift of the supply curve to S´. The dotted area corresponds to the producer’s surplus of the expanded capacity and is equal to the production times the profit marginal cd (P-a). The loss caused by the installed capacity is the wavy area and is equal to bc (P*-P). From this graph one can clearly see that the price is P* * P d c b Variable cost (SEK/TWh) Quantity (TWh) a S S´ D
5.4
Underuse Production with low Marginal cost
Since the price on the Swedish electricity market is based on the marginal cost of each of the production methods, it can be profitable for the firms to underuse some of the electric-ity with low marginal cost in order to increase the prices. Speculations have been made on whether the dominating market players underuse some of the base electricity, however no such evidence have been found. It is difficult to know whether a stop in a nuclear reactor is due to manipulation or a simple malfunction, therefore this kind of manipulation is rela-tively easy to hide.
In a well-functioning market with perfect competition, the cheaper methods of production will have the highest utilization rate as possible in order to keep the prices low. However, an EME-analysis from 2007 examined the Swedish nuclear market and compared it to Fin-land, who has the highest energy utilization rate of world’s nuclear nations, and found that this has not been the case. The report determined that Sweden’s best utilization years have been worse than all years in Finland since 1999. During the years between 1996 and 2007, the nuclear energy utilization rate in Sweden was 80,8 percent compared to Finland who had a rate of 93,8 percent. The 13 percent difference corresponded in 2007 to approx-imately 10 TWh which is equal to around 7 percent of the total electricity consumption in Sweden. In addition, the Swedish nuclear power plants are co-owned by the different tricity producers while the Finnish nuclear power plants are only owned partly by the elec-tricity producers and big industrial consumers. This makes it more tempting for the Swe-dish owners, than for the Finnish, to increase the market price with the nuclear power (EME Analysis 2007).
Furthermore, many accusations were directed to Vattenfall and their closed nuclear reac-tors Ringhals 1 and 2 during the winter of 2009/2010. Nuclear power plants’ reacreac-tors have to be closed down yearly for revision, an annual deregistration. During this period, the reactors go through a security check and a fuel change. Moreover, faults that has emerged during the operation season are corrected (Vattenfall AB 2010). The 2009 revision of Ringhals 1 and 2 that were supposed to take a few months took almost a year. The cold winter combined with two static nuclear power plants made the day price of electricity go up to 261 öre/kWh in 17 December 2009 when the normal price of this period is 35 öre/kWh (Dagens Nyheter 2009).
The electricity producers can not just control the output of the nuclear power plants, they can also decide how to allocate the hydroelectric power production to maximize profits. The production of hydro power is restricted to the power plants’ total reservoir capacity. The marginal cost, opportunity cost, of hydroelectric power consists of the value of post-poning the production. Assume a well-functioning market where the firms are price takers. The electricity is more expensive in the winter than in the summer implying that it would be profitable for the firms to move their production of hydro power to the winter. In the absence of bottlenecks, any fluctuations in demand will be handled by the hydro power, meaning that the price and the marginal cost will coincide in both periods. However in the presence of bottlenecks, the Nordic electricity market is divided into smaller regional price areas. These bottlenecks prevent complete price equalization and allow the leading firms to practice local market power.
If the producers act strategically, the hydro power production is moved to the summer from the winter.
Picture (a) Picture (b)
Graph 5. Strategic Hydroelectric Power Production
Source: Own work based on Fridolfsson & Tangerås 2009 and Vattenfall AB 2009
Assume the market consists of one single hydroelectric power producer. In picture (a) in graph 5, the hydro electric power producer acts strategically and produces a large part of the production during the summer. The market price will be set at P1* where the supply
(S1) and demand summer (DS1), intersects. If the firm would produce the large part of the production in the winter instead, the price would only rise marginally as can be seen in the Variable cost (SEK/TWh) S1 S 2 DS1 DW1 DS2 DW2 Quantity (TWh) P1* P1 P2 P2*
er acts strategically again and decides to produce the large part of the production during the summer and thus only a small part of the production occur during the winter. The supply curve has shifted leftwards compared to picture (a). When a small amount of hydro power is produced during the winter, the market price will be established at P2* where the demand of winter, DW2, intersects with the supply curve, S2. The price P2*, in picture (b), is now
much higher compared to what it would have been if the large part of the producer’s pro-duction was moved to the winter, P1 in picture (a). The summer price is not affected by the seasonal production allocation. However, by moving the larger part of the hydro power production to the summer, a higher equilibrium price is established for the yearly produc-tion since the winter price of electricity is rising.
5.5
Entry into the Swedish Electricity Market
The Swedish electricity market is characterized by many entry barriers. In a market that is protected from entry, price remains above the marginal cost because no more firms can en-ter the market and drive down the prices. There is also a risk that potential entrepreneurs will be pushed out from the market before they have a chance to establish themselves.
Graph 6. Profits and Emission Rights
Source: Own work based on information from Vattenfall AB 2010 Variable cost SEK/TWH) Quantity TWh Demand P* Supply
The dotted area in graph 6 shows the difference between the market price (P*) and the marginal costs for the different capacities, hence the profits in the industry. Since the equi-librium price corresponds to the variable production cost for the most expensive produc-tion facility that is required in order to meet the demand, the electricity market allows for very large profits for plants with low marginal costs. Furthermore, the emission permits make electricity from plants based on fossil fuels more expensive leading to even larger profits for firms that produce environmental friendly electricity with a low marginal cost, such as hydro- and nuclear power plants.
Generally industries that experience positive profits attract new firms. One would then ex-pect that firms will enter the market and start to produce new electricity and therefore the profits would begin to fall to normal levels (Brakman et al. 2009). However, the entry bar-riers hinder this natural development.
One significant entry barrier on the Swedish electricity market is the restriction to invest in new capacity. For the time being, no new nuclear power can be built and it is virtually im-possible to create hydro power (Swedish Competition Authority 2006). These circums-tances imply that the large profits generated in the market cannot be invested in new capac-ity of nuclear- and hydro power, which would lead to lower prices. Therefore, according to the Swedish Competition Authority (2007), the Swedish electricity market cannot be re-ferred to as a well-functioning market. They believe that the restrictions that exist for new investments are the biggest competition disturbance on the market.
5.5.1 Game Theory on Entry
In this section a game on entry is simulated, where a potential entrant to the Swedish elec-tricity market is considering whether to enter or not. Assume the following situation:
Two participants; one incumbent and one potential entrant
The incumbent acts first and the entrant makes its decision based upon the action of the incumbent.
Suppose that the incumbent has the possibility to increase its profits by raising its produc-tion capacity through an investment. If the potential entrant decides to enter the market and the incumbent decides to invest, an excess capacity will arise on the market.
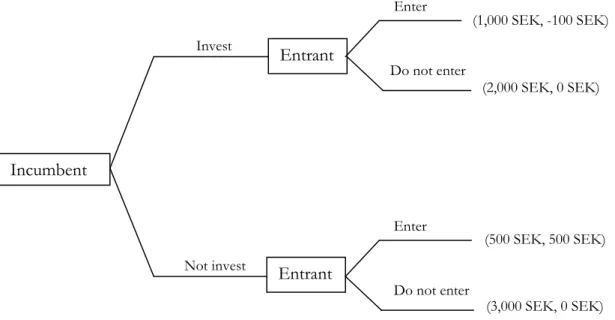
The incumbent makes a decision which the entrant observes and thereafter decides wheth-er or not to entwheth-er the market. If the incumbent decides to invest thwheth-ere are two possible outcomes depending on the entrants decision to enter. If the entrant decides to enter, he will make a loss of 100 SEK and the incumbent will make a profit of 1,000 SEK. However, if the entrant decides not to enter he will make a profit of 0 SEK while the incumbent will make a profit of 2,000 SEK.
If the incumbent decides not to invest there are two possible outcomes depending on how the entrant decides to act. If the entrant decides to enter there will be a split profit of 500 SEK each. However, if the entrant decides not to enter he will receive a profit of 0 SEK while the incumbent will make a large profit of 3,000 SEK.
Figure 3. Incumbent vs. Entrant
Source: Carlton & Perloff 2005
The incumbent has the first-mover advantage, meaning that the already established firm has an advantage over potential entrants. Advantages can be technological know-how or a strong brand that can give the incumbent the possibility to deter all entry. The game shows a clear example of the advantage the incumbent can have. If the incumbent acts strategical-ly and decides to invest, the entrant will never make a profit.
The entrant’s decision to enter the market is associated with a sunk cost. Sunk costs are in-curred once and exist even if no output is produced. Once the firm has invested it has
Invest Not invest Enter Enter Do not enter Incumbent Entrant Entrant Do not enter (1,000 SEK, -100 SEK) (2,000 SEK, 0 SEK) (500 SEK, 500 SEK) (3,000 SEK, 0 SEK)
made a commitment to the market which will affect its strategic behavior (Nicholson 2005). Whether the incumbent invests or not he will make a profit between 500 and 3000 SEK depending on the decision of the entrant. The entrant will only make a profit in one of the outcomes. The most profitable outcome for the entrant would be if the incumbent decides not to invest and the entrant enters the market. This however, is the least profitable outcome for the incumbent.
Even though the numbers in the game tree are fictitious it can provide a basic idea of how the market works. The Swedish electricity market is characterized by high risks and barriers to entry. It is difficult to enter and reach the point where the firm is integrated. However, once the firm is established on the market it can make large profits.
The relatively new established firms on the Swedish electricity market did not receive their large market shares through the traditional way of entering. Instead they engaged in mer-gers, acquisitions, and joint ventures (Swedish Energy Agency 2006).
5.6
Best-Practice techniques in the Swedish Electricity Market
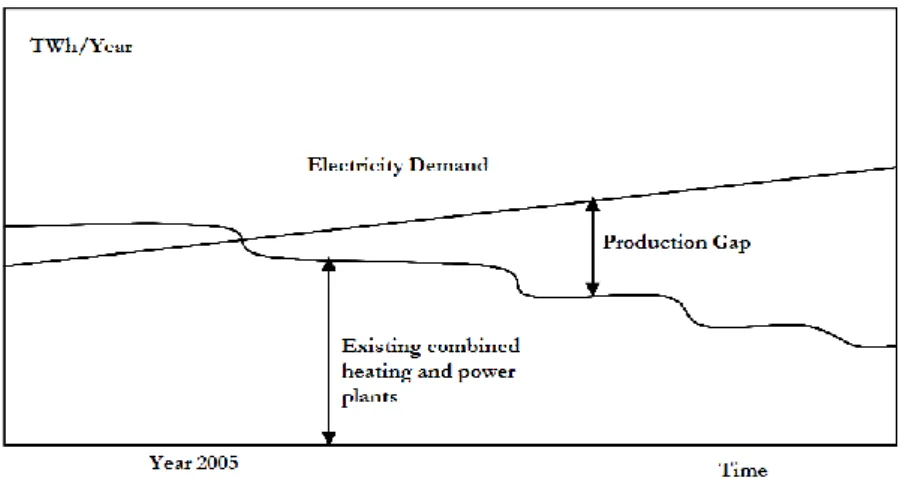
Sweden has the capacity to expand their electricity production. The change in yearly de-mand of electricity is met by increased or decreased use of older facilities run by coal cold condensing power, so called marginal power. This marginal power makes production from alternative energy sources more attractive as long as the excess production capacity on the market holds. The demand for power is continuously increasing while power plants in the Nordic countries and northern Europe have to be shut down due to their age. As this process is progressing, a production gap will arise which needs to be filled with new power plants, see figure 4. When there is a need for new electricity production, power plants are built according to an order of priority where plants with lowest production costs are at the top of the list (Elforsk 2007).
Figure 4. Production Gap
Source: Elforsk 2006
Without emission rights the most profitable solution will be to make the existing hydro- and nuclear power plants more effective. The second priority will be to make the existing combined heating and power plants based on natural gas and/or coal more effective. The-reafter, new coal-and natural gas fired power plants will be built. However, by introducing emission rights to the market, the extension plans of coal- and natural gas fired power plants will diminish and would instead create an incentive for firms to invest in more envi-ronmental friendly electricity (Elforsk 2006).
We have adapted Salter’s best-practice technique model to the Swedish electricity market. We thus analyze the investments’ effect on the supply curve and the incumbents’ potential stategic behavior to deter entry when emission trading is present.
D1
Graph 7. Investments and Strategic Behavior
Source: Own work based on Salter 1966 and Vattenfall AB 2009
Graph 7 examines the construction of modern plants and the scrapping of outmoded plants when emission trading takes place on the market. The shaded areas in the graph de-notes the emission rights’ effect on the plants’ variable costs. The price (Pn) is composed by the average variable costs (AC) and the average fixed costs (CD) of the best- practice plants in the current period n.
When the demand is high, for example during a harsh winter, the price will be Pn. CD represents the average fixed cost for wind power plants in period n. The price on the mar-ket in period n is equal to the variable cost of the most expensive plant in operation, that is, the plants built in period n-6 whose average variable cost are AVCn-6. Emission rights make it more lucrative for firms’ to invest in more CO2 –free electricity due to the high profits the market can offer. Furthermore, they make the firms face two alternatives; they can either buy a permit in order to keep on producing “dirty” electricity, or they can invest in cleaner production methods to avoid costs.
C AVCn+1 Price and costs Output D1 D A1 C1 A B1 B Pn Pn+1 AVCn AVCn-6 Pn+Limit Pricing
Lets assume that a firm now decides to invest in new capacity, say building a new wind power plant, since that virtually is the only possible investment to make. In period n+1 a new best-practice technique with lower average variable costs therefore becomes available. This will shift the output level from AB to A1B1 in the graph. Consequently, the invest-ment will reduce the price to Pn+1. According to Salter (1966) the plants with average va-riable costs AVCn-6 will therefore be scrapped since their costs have now risen above the market price. However, this is not a valid way of reasoning in the Swedish electricity mar-ket since these plants seem never to be scrapped. The plants with the highest variable cost are used under certain periods of the year when the demand is high. Nevertheless, if in-vestments are large enough to cover the demand these plants must eventually be scrapped, or at least be less utilized.
Investments in new power plants imply sunk costs. Sunk costs are costs associated with the investments required to enter a market. Because of these costs, the variable costs are the only interesting expenditure for decision making in the short run, hence the right side of the vertical axis. When new capacity is built it is important that the price (Pn+1), is high enough to cover the average total cost, A1D1. This implies that the average fixed costs C1D1, are of great importance to the investment decisions. The incumbents now have a possibility to act strategically. Threats of lowering the price, known as limit pricing, can de-ter new entrants from investing in new capacity. The incumbents can set a lower price, by utilizing the base electricity at full capacity, so that the market price does not cover the fixed costs of the new investment. This strategy results in a lower market price, Pn+ Limit Pricing, in graph 7. If the behavior of the incumbent is credible, new firms will not invest today even though today’s price is high. Through this behavior, the incumbent can make any investment unprofitable.
This framework is related to the game theory discussed in section 5.6. Figure 3: Incumbent vs. Entrant and graph 7: Best-Practice Techniques both illustate the potential strategic be-havior of the incumbent to deter entry on the electricity market. These sections show how difficult it is for new entrants to enter the Swedish wholesale electricity market when the existing firms act strategically.
6
Concluding Remarks
This chapter concludes our findings regarding strategic behavior and market power among wholesalers on the Swedish electricity market.
The Swedish electricity market has a history of being regulated. The market’s previous mo-nopolistic behavior has shaped today’s structure. 14 years after the deregulation, the market is still highly concentrated with few competing firms and increasing prices. Additionally, the leading firms hold a large part of the market shares which gives them the possibility to practice market power.
By calculating the Herfindahl-Hirschman Index based on the firms’ market shares, a high index of 0,23 was obtained indicating that the electricity wholesale market is highly concen-trated. According to our calculated Lerner Index of 0,21 the market has similar carachte-ristcs of an oligopoly with high entry barriers, limited room for product differentiation, and limited access of information.
From our empirical results we draw the conclusion that the leading firms; Vattenfall, E.ON, and Fortum have enough market power to act strategically to increase the market price and reduce competition. One of the main problems are the entry barriers that hinder new participants to enter the market. Electricity is a commodity with special features since it is a nonstorable good with limited capacity. Consequently, natural entry barriers are present in the form of limited expansion opportunities. However, due to the electricity giants’ market power, entry barriers can also be created. Incumbents can deter entrepre-neurs’ entry or push rivals out of the market by intentional strategic behavior. They can practice predatory pricing, limit pricing, or invest in order to lower production costs. Their strategic behavior is not only limited to deter entry, the incumbent firms can also increase the market price through underinvestment and to underuse production with low marginal cost. Furthermore, the high degree of vertical integration allow the dominating firms to cooperate and reduce the degree of uncertainty that is required for an effectively function-ing market.
The electricity market is capital intensive and is characterized by high risks associated with high costs. Therefore it is hard for new entrants to enter and survive on the market. In or-der for new entrants to decide to enter the electricity market, the profit must offset the sunk costs. As simulated in the game on entry, the incumbent has the first-mover