The Impact of Buyouts on Swedish
Portfolio Companies
A Quantitative Study on Performance 1998-2011
Master Thesis within International Finance
Authors: Daniel Mörk
Joel Pettersson
Tutors: Andreas Stephan
Louise Nordström
Acknowledgement
We would like to express our gratitude to our tutors Andreas Stephan and Louise Nordström for supporting and guiding us through problems during our research and mak-ing this master thesis possible.
We also would like to thank our fellow seminar students for their feedback and their help that have allowed us to improve this thesis.
………. ……….
Daniel Mörk Joel Pettersson
Master Thesis in International Finance
Title: The Impact of Buyouts on Swedish Portfolio Companies Author: Daniel Mörk & Joel Pettersson
Tutor: Andreas Stephan & Louise Nordström
Date: 2012-05-22
Subject terms: Private Equity, Buyouts, Sweden
Abstract
The private equity market has been a hot topic of debate since it first started to emerge. As it has become more frequently apparent in the Swedish economic and financial market, the debate regarding its impact in Sweden has also risen. The debate contains various opinions whether the private equity firms, through buyouts uses tax breaks or arbitrage opportuni-ties to “quick flip” the investments on the expense of workers and wages or if the PE firms create operational and economic value.
Previous studies regarding this topic have mostly been conducted in the U.S, Canada or to some extent in the U.K. This paper aims to, through a quantitative method, investigate and present whether the buyouts have an impact on Swedish portfolio companies or not, and if they do, what kind of impact the buyouts have. This will be done through an event study, based on data collection from portfolio companies that have experienced a buyout made by a private equity firm. The data will then be compared with data from peer groups and ana-lyzed through statistical methods in SPSS.
The main findings in this thesis suggest that buyouts do not have, neither a positive nor negative impact on the performance of portfolio companies in Sweden. The tests allow us to conclude that PE firms do not have market timing skills. Neither can we conclude that PE firms cause layoffs of workers or lowering of wages.
Definitions
BOC Buyout Companies
CMBOR Centre for Management Buyout Research
EBIT Earnings Before Interest and Taxes
EBITDA Earnings Before Interest, Taxes, Depreciation and Amortization
EVCA European Private Equity and Venture Capital Association
LBO Leverage Buyout
MBO Management Buyout
NVCA National Venture Capital Association
PE Private Equity
PG Peer Group
R&D Research and Development
ROA Return On Assets
Table of Contents
1
Introduction ... 1
1.1 Background ... 2 1.2 Problem Discussion ... 3 1.3 Research Questions ... 4 1.4 Purpose ... 4 1.5 Delimitations ... 4 1.6 Results ... 42
Frame of reference ... 5
2.1 Theory ... 5 2.1.1 Private Equity ... 5 2.1.1.1 Buyouts ...6 2.1.2 Capital Structure ... 7 2.1.3 Trade-Off Theory ... 72.1.4 Agency Conflicts and Reduction of Agency Costs ... 7
2.1.5 Market Timing ... 8
2.2 Previous Studies... 8
2.2.1 The Operating Impact of Buyouts in Sweden ... 9
2.2.2 Operating Performance – Financial Measurements ... 9
2.2.3 Employment & Wages ... 11
2.2.4 R&D and Innovation ... 11
2.2.5 Other ... 11
3
Method ... 13
3.1 Methodological Approach ... 13 3.2 Research Approach ... 13 3.3 Research Method ... 14 3.4 Research Process ... 14 3.5 Research Design ... 14 3.6 Data Collection ... 16 3.6.1 Credibility ... 163.7 Analyzing Quantitative Data ... 17
3.8 Sample Collection... 17 3.9 Peer Groups ... 18
4
Test Methodology ... 19
4.1 Hypotheses ... 19 4.1.1 Operating Performance ... 19 4.1.2 Overall Performance ... 19 4.1.3 Market Timing ... 19 4.1.4 Change in Wages ... 20 4.1.5 Change in Employment ... 20 4.2 Hypothesis Testing ... 214.2.1 Type I & Type II Errors ... 21
4.3 T-Test ... 21
4.4 Non-Parametric Test ... 22
4.5 The Wilcoxon Signed-Rank Test ... 22
5
Empirical Results ... 25
5.1 Descriptive Statistics ... 25 5.2 Operating Performance ... 26 5.3 Overall Performance ... 29 5.4 Market Timing ... 32 5.5 Change in Wages ... 33 5.6 Change in Employment ... 346
Analysis ... 38
7
Conclusion ... 43
8
Discussion ... 44
References ... 45
Appendices ... 49
Figures and Tables
Figure 1-1. Development Buyout Investments ... 1
Figure 2-1. Institutional Investors in Europe 2003-2007 ... 5
Figure 2-2. Overlook Private Equity... 6
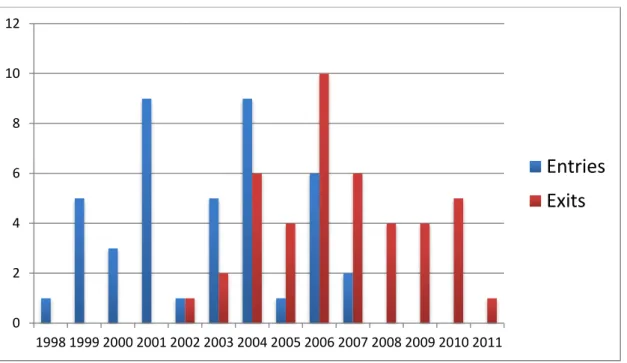
Figure 5-1. Entries and Exits for the Sample ... 25
Figure 5-2. Scatter Plot (Change in Wages) ... 34
Figure 5-3 Scatter Plot (Change in Employment) ... 35
Table 2-1. Types of Buyouts ... 6
Table 5-1. Portfolio Companies Statistics ... 25
Table 5-2. Industry Adjusted Performance Statistics ... 26
Table 5-3. Industry Performance Development ... 26
Table 5-4. One-Sample T-test on Operating Performance ... 27
Table 5-5. Wilcoxon Signed Rank Test (EBITDA Margin) ... 28
Table 5-6. Test Statistics for Wilcoxon Signed Rank Test (EBITDA Margin) ... 28
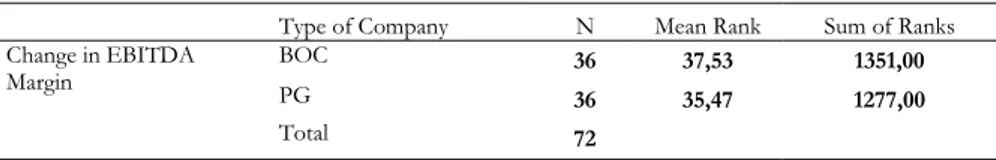
Table 5-7. Mann-Whitney U Test (EBITDA Margin) ... 29
Table 5-8. Test Statistics for Mann-Whitney U Test (EBITDA Marging) ... 29
Table 5-9. One-Sample T-test on Overall Performance ... 30
Table 5-10. Wilcoxon Signed Rank Test (ROA) ... 30
Table 5-11. Test Statistics for Wilcoxon Signed Rank Test (ROA) ... 31
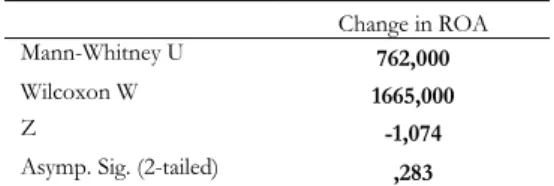
Table 5-12. Mann-Whitney U Test (ROA) ... 31
Table 5-13. Test Statistics for Mann-Whitney U Test (ROA) ... 31
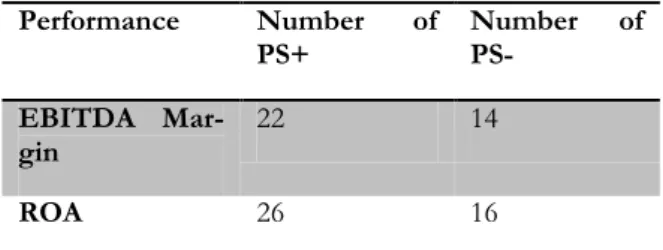
Table 5-14. Non-Parametric Sign Test (EBITDA) ... 32
Table 5-15. Non-Parametric Sign Test (ROA) ... 33
Table 5-16. Model Summary for Regression Analysis (Change in Wages) ... 33
Table 5-17. Coefficients for Linear Regression Analysis (Change in Wages) ... 34
Table 5-18. Model Summary for Regression Analysis (Change in Employment) ... 35
Table 5-19. Coefficients for Linear Regression Analysis (Change in Employment) ... 35
Table 5-20. Difference Change in Employment BOC vs PG ... 36
Table 5-21. Paired Sample T-test ... 36
Table 5-22. Group Statistics Change in Employment ... 37
Appendices
Appendix 1 ... 49 Appendix 2 ... 51 Appendix 3 ... 53 Appendix 4 ... 55 Appendix 5 ... 56 Appendix 6 ... 57 Appendix 7 ... 58 Appendix 8 ... 59 Appendix 9 ... 60 Appendix 10 ... 61 Appendix 11 ... 62 Appendix 12 ... 63 Appendix 13 ... 64 Appendix 14 ... 65 Appendix 15 ... 66 Appendix 16 ... 67 Appendix 17 ... 68 Appendix 18 ... 69 Appendix 19 ... 70 Appendix 20 ... 711 Introduction
This first chapter will give the reader an introduction to the subject of the thesis; some background infor-mation will introduce you to the problem discussion and further to the purpose and the research questions we intend to answer throughout the research. We will also explain concepts that are important for the under-standing of the subject.
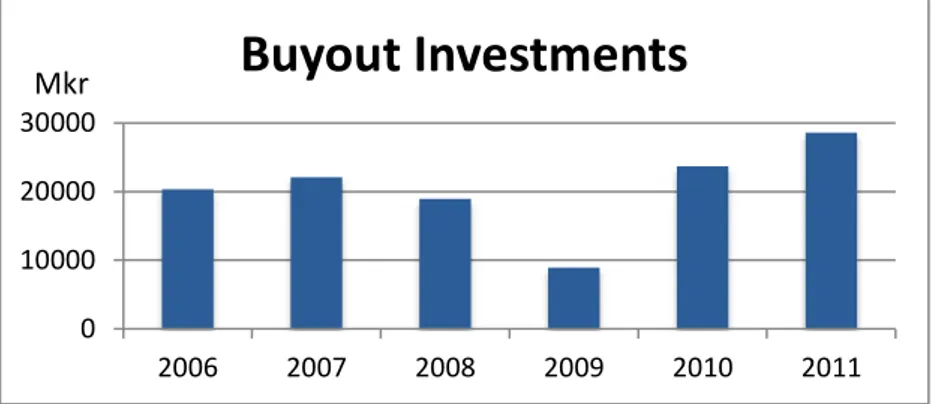
The global buyout market has experienced a huge development from the mid 1980’s until today, with a significant increase in transaction value. The transaction value of the lever-aged buyouts from 2005 through June 2007 represented 43% of the total transaction value between 1984 and 2007. The private equity (PE) investments in Europe grew from 0.2% to 0.3% of the European GDP between the years 2009 and 2010. According to EVCA’s Yearbook (2011), there were around 1,700 active PE firms in Europe in 2010.
The Swedish PE market has realized a significant growth, and in 2010, Sweden had the highest number of PE and venture capital investments as a percentage of GDP compared to other European countries (EVCA, 2011). According to SVCA (2010), the Swedish PE firms had a turnover that corresponds to 8% of the Swedish GDP. In 1985, Swedish PE firms managed SEK1.5 billion and 15 years later, in 2010 (August), the same number had reached SEK482 billion. Swedish PE firms are today, owners in 700 companies with 180,000 employees, which represent 7% of the Swedish private sector workforce. The PE funds are also attractive to foreign investors. Over 80% of the capital invested in Swedish PE funds the last few years came from foreign investors (SVCA).
Figure 1-1. The development of Buyout Investments in Swedish Portfolio Companies (Last quarter of 2011 is not included)
The 2nd of April 2012, the Swedish private equity (PE) firm Ratos agreed to sell their shares
in the Swedish pest control company Anticimex to EQT, another PE firm after six years as the majority shareholder. The exit resulted in a net profit of SEK940 million for Ratos and an average yearly internal rate of return (IRR) of 24% (Nyhetsbyrån Direkt, 2012). As op-ponents of PE activity claim that the PE firms do not create economic value one might ask where this IRR is gained. This debate, regarding PE firms ability to create economic value and the growth of the PE market have inspired us to investigate how portfolio companies are affected by buyouts made by PE firms.
0 10000 20000 30000 2006 2007 2008 2009 2010 2011
Buyout Investments
Mkr1.1 Background
Before the first two venture capital firms started in 1946, wealthy individuals and families dominated the market (Wilson J. W., 1985). The first known PE deal occurred 1901 in Pittsburgh when J.P Morgan bought Carnegie Steel Company for $480 million. The sellers in the deal were the founders of the company, Andrew Carnegie and Henry Phipps. Later, in 1907, Phipps founded Bessemer Trust to invest the profits from the Carnegie deal into pri-vate businesses. Today, over 2,100 families have over $60 billion invested in Bessemer Trust (Bessemer Trust).
What is considered today to be the first true PE investments started in 1946 after World War II. The start was the founding of the first two venture capital firms, American Research and Development Corporation (ARDC) and J.H Whitney & Company. Ralph Flanders, Karl Compton together with Georges Doriot, who is considered to be the father of venture cap-italism, founded ARDC with the purpose to encourage investments from the private sector in businesses run by soldiers returning from the war (Wilson J. W., 1985). J.H Whitney & Company was founded by the industrialist John Hay “Jock” Whitney with a goal to provide funds and professional assistance to entrepreneurs in growing industries (J.H. Whitney & Co, 2012).
In the mid 1960’s and early 1970’s U.S. companies were in an era of gross corporate waste and mismanagement. In these times, PE firms used corporate breakups, divisional spin-offs, takeovers, going-private transactions and leveraged buyouts (LBOs) to get established on the market. Despite that these new type of innovations caused criticism and outrage among business leaders it continued and the developments in the markets continued in the 1980’s and the market value of equity held in companies tripled from $1 trillion to more than $3 trillion. The increase in capital came mostly from private placements, which had expanded more than ten times during the decade, to a rate of $200 billion in 1988, and debt and equity made of private placements now accounted for more than 40% of annual cor-porate financings. At this time, the most widespread going-private transaction, the lever-aged buyout, was becoming larger and more frequently used. At the same time as the huge increase in private placement, the value of 214 public company buyouts exceeded $77 bil-lion, which were standing for one-third of the value of all mergers and acquisitions at this time. Due to these facts, entire industries started to being reshaped. Developments as strik-ing as the restructurstrik-ing of our financial markets and major industries reflect the underlystrik-ing economic forces more fundamental and powerful than financial manipulation, management greed, reckless speculation, and other reasons used by defenders of the corporate status quo. The decline that occurred at this time was caused by different factors from industry to industry, and the main objective with the new organizations was that it should resolve the central weaknesses that existed in public corporations (Jensen C. M., 1989). Since the lever-aged capital structures often relied on junk bond financing, the LBO activity almost disap-peared in the beginning of the 1990’s when the junk bond market crashed, causing many LBOs to end up in bankruptcy and default. By this time, Jensen’s prediction seemed prem-ature, but during the 1990’s and early 2000’s, although LBOs were relatively infrequent, they still existed, and in the mid 2000’s another leveraged buyout boom occurred (Kaplan & Strömberg, 2009). This boom came to an end with the credit crisis in late 2007 (Axelson, Jenkins, Weisbach, & Strömberg, 2010). According to Kaplan and Strömberg (2009), the evidence is strong that PE activity is subject to boom and bust cycles and they further speculate that because of the economic value private equity creates, the activity will contin-ue in the future. In contrast to Kaplan and Strömberg’s (2009) findings that PE creates
economic value, critics have been questioning whether that is really the fact and the topic have been heavily debated according to Lerner, Sorensen and Strömberg (2011).
In the late 1980’s the buyouts were almost exclusively concentrated to the U.S., Canadian and in some extent the U.K. market, accounting for 93% of worldwide transaction value, but it would start spreading to Europe. Between the year 2000 and 2004, Western Europe accounted for 48.9% (Lerner et al., 2011).
The Swedish PE market was established around 30 years ago and has since then had an important impact on the economic growth and the development of the society (SVCA). Sweden’s first PE firm Företagskapital was founded in 1973. Eight years later, in 1981 sever-al other PE firms were founded, among them: Wermia, Svecia Invest, Four Seasons Venture Capital and Improvator (SVCA, 2012).
The reason for the substantial growth within the private equity market is according to SVCA due to that the corporate structure that PE provides has been proven very success-ful. SVCA is also emphasizing on the fact that companies nowadays, because of the fast globalization and the more competitive corporate climate, has to focus on restructuring and centralization and seek managing for divisions that are not part of the company’s core ac-tivity and this is where PE firms can provide support. As mentioned earlier, there are dif-ferent opinions regarding whether PE firms actually create value or are acting opportunistic and behave like “locusts” once they have entered a firm (Badunenko, Barasinska, & Schäfer, 2009).
1.2 Problem Discussion
The debate concerning the impact of buyouts on the portfolio firms and the economic val-ue has been present since the 1980’s as buyouts increased in both freqval-uency and size. Pro-ponents argued that the structural changes in the organizations that occurs with buyouts, give managers incentives to make better investment and operating decisions and thus max-imize wealth. The opponents meant that the increased financial leveraged caused the firms to be more exposed to financial distress and more short-term-oriented. They argue that the financial distress leads to a decline in competitiveness (Palepu, 1990) and that the invest-ments are made to profit on the favorable tax treatinvest-ments that high leverage is creating, in-stead of creating economic value (Shleifer & Summers, 1988). Proponents, on the other hand, see the high leverage rate as a way to put pressure on managers not to waste money. The “free cash flow” decreases, as a result of the interest payments and amortization and prevents the manager to dissipate it. Accusations of private firms being more short-term-oriented and that the firms tend to “quick flip” (exits within 24 months of the investment) investments, instead of seeking for long-term profitability, has also been stated by oppo-nents of PE firms recently according to Kaplan and Strömberg (2009). According to Lerner et al. (2011), the private equity firms’ reasons for “quick flips” would be to obtain fees and raise new capital more quickly.
Another heavily argued topic is the buyouts’ effects on jobs and wages. To improve opera-tions and productivity and thus create economic value, these kinds of re-structurings often have to be made. Critics argue that the investors in an LBO benefit on the expense of workers and wages and that operating improvements and value creation is generally related with superior information about the future of the portfolio company’s performance. Op-ponents of private equity often mean that this superior information comes from the in-cumbent management and proponents often agree, meaning that superior information is a main reason for the investment since it will help deliver better results. The critics mean that
the incumbent managers prefer a private equity buyout because of the intention to keep their jobs and get compensated by the private equity owners. Moreover, for this reason, the managers will not fight for the highest share price to give the private equity investors a bet-ter deal (Kaplan & Strömberg, 2009).
1.3 Research Questions
The heavily debated topics mentioned in the problem discussion leads us to our two prima-ry research questions:
Do buyouts have any impact on the performance of Swedish portfolio companies? and
What type of impact do buyouts have on Swedish portfolio companies?
Some sub questions have been designed to help us answering our primary questions:
Do buyouts have any impact on the operating performance of Swedish portfolio companies?
Is the impact on the performance of the portfolio companies due to PE firm’s actions or market performance?
Do the performance of the portfolio company during the holding period have an effect on wages and employment?
1.4 Purpose
The purpose of this thesis is that through our empirical analysis determine if and what kind of impact buyouts have on Swedish portfolio companies.
1.5 Delimitations
This thesis concerns the performance of Swedish portfolio companies that have been bought up and sold by a PE firm during the period 1998-2011.
1.6 Results
The main findings in this thesis suggest that buyouts do not have, neither a positive nor negative impact on the performance of portfolio companies in Sweden. The tests allow us to conclude that PE firms do not have market timing skills. Neither can we conclude that PE firms cause layoffs of workers or lowering of wages.
2 Frame of reference
The purpose of this chapter is to present the basic theories and previous studies concerning the subject. The theories discussed will constitute as the theoretical frame of reference and is intended to help the reader under-stand the empirical findings and the analysis in later chapters.
2.1 Theory
2.1.1 Private Equity
In most cases if a firm needs to raise capital from the public, the company has to be successful and well established. Of course there are firms that are in the early stages of their lives or are having financial problems and thus have difficulties to get access to the public equity markets. The best alternative for these firms may be the PE market (Hillier, Ross, Westerfield, Jaffe, & Jordan, 2010).
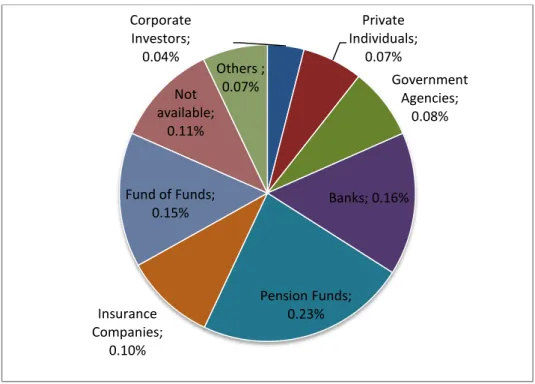
A PE firm is usually organized as Limited Liability Corporation or as a partnership (Kaplan & Strömberg, 2009), where the institutional investors such as pension funds and mutual funds, act as the limited partners and the PE firm acts as general partners (Hillier et al., 2010). In Figure 2-1 you can see an example of different types of institutional investors in Europe between the years 2003 and 2007.
Figure 2-1. Types of Institutional Investors in Europe Between the Years 2003 and 2007 (Source EVCA.EU)
To raise the equity capital needed for investments, the PE firms uses a private equity fund. Typically, the investors agree to provide a certain amount of money, which goes to the investments in companies as well as management fees to the PE firm. It is normal for the general partner to contribute with at least one percent of the total capital. The fund normally has a fixed life for 10 years but can often be extended three years. The general partner gets compensated in 3 ways, the management fee, “carried interest”, which refers to a part of the profits (usually 20%) of the fund and often, the general partners charge the companies they invest in for deal and monitoring fees. (Kaplan & Strömberg, 2009).
Corporate Investors; 0.04% Private Individuals; 0.07% Government Agencies; 0.08% Banks; 0.16% Pension Funds; 0.23% Insurance Companies; 0.10% Fund of Funds; 0.15% Not available; 0.11% Others ; 0.07%
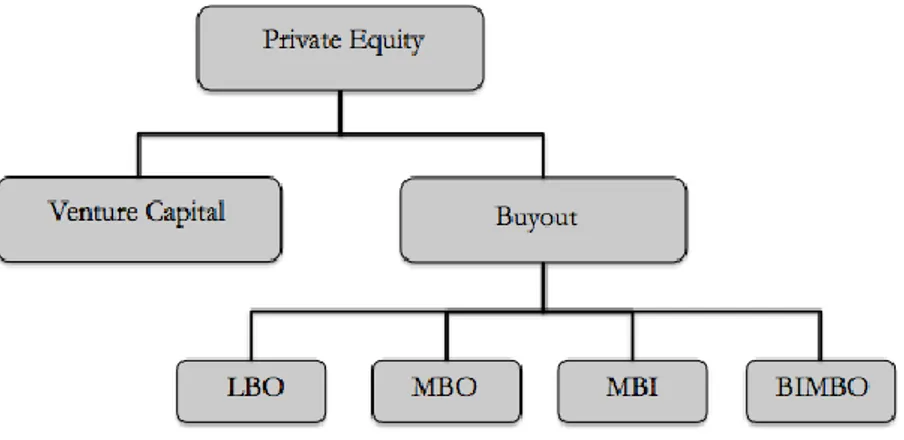
The two most common investments made by a PE firm are venture capital investments and buyouts. The venture capital investments are usually made in a company that is in an early stage in their development while buyouts are investments in more mature company with potential to grow and/or are in financial distress. In buyouts, the PE firm acts as an active investor.
Figure 2-2. Overlook Private Equity (See Definitions Section 2.1.1.1)
2.1.1.1 Buyouts
When private equity firms acquire the majority control of a company, using a fairly large portion of outside debt financing, it is called a leveraged buyout (Kaplan & Strömberg, 2009). The reason for high leverage is generally explained by tax deductions or incentives to work hard. As managers become the owners they will have to work hard to meet the in-terest payments (Hillier et al., 2010). The increase of the management’s ownership inin-terest in the firm is an important change related to these transactions.
The most frequently used kinds of buyouts made by PE firms are according to Bruining and Wright (2008):
Leverage Buyout
(LBO) The assets of the target company are used to secure the loans acquired to finance A takeover, which is financed with money borrowed from others (often a bank). the purchase. When it is time to repay the loan, the PE firm uses either the profits
or they sell the assets to repay the loan.
Management
Buy-out (MBO) Financed by the existing managers who will have full control over the company af-ter the transaction.
Management
Buy-in (MBI) Carried out when both external managers and external investors takes control over the company.
Buy-in Manage-ment Buyout
(BIMBO)
This is a combination of an MBO and an MBI and occurs when existing managers together with external managers take control over the company.
Table 2-1. Types of Buyouts
We will henceforth treat them as a homogeneous group and refer to them as buyouts. In a typical buyout, a PE firm acquires a company, increases the profitability, and sells it or floats its shares after several years. As mentioned earlier, a large share, usually between 60 and 90%, of the buyout price is debt financed. The funds needed to cover the remaining 10 to 40% of the price are provided from the investors (Kaplan & Strömberg, 2009).
2.1.2 Capital Structure
Since the typical buyout is financed with 60 to 90 % debt (Kaplan & Strömberg, 2009), and backed by the portfolio company’s assets (Axelson et al., 2010) we believe that a brief presentation of the capital structure theory is necessary to understand the impact of a buy-out on a portfolio company. A firm’s capital structure is its combination of equity and long-term debt that the firm uses to finance its operations. It is easy to imagine the firm as a pie, and a slice of the pie to be for example equity. The size of that slice will determine what percentage of the firm’s cash flow that will go to the creditors, while the rest will go to the firm’s debt holders (Ross, Westerfield, & Jordan, 2008). In Modigliani and Miller’s Proposition I (1958), it is argued that with the assumptions that there are no taxes, no transaction costs and that individuals and corporations borrow at the same rate, the market value of a firm is not dependent on its capital structure. In other words: the size of the pie doesn’t depend on how it is sliced. In reality though, taxes are present and a firm’s value is related to its debt-to-equity ratio. One feature of debt is that interest paid on debt is tax de-ductible. This means that the interest payment a firm makes on its debt is earnings they do not have to pay taxes on. This is good for the firm. The savings the firm allows to make on this is called the interest tax shield. The feature of debt that is harmful for the firm is, that if the firm fails to meet their debt obligations it can result in bankruptcy (Ross, Westerfield, & Jordan, 2008). Opponents of PE activity argue that PE firms take advantage of the first feature, namely the tax shield and pay less attention to the bankruptcy risk by increasing the debt in the companies they invest in. Another link between the theory of capital structure and buyouts is that the debt the PE firm takes on creates pressure on the managers to be careful with the free cash flow, preventing the managers from wasting it (Jensen & Meckling, 1976).
2.1.3 Trade-Off Theory
A company can choose how much debt finance and how much equity finance to use by balancing the costs and benefits; this is referred to as the trade-off theory of capital struc-ture. The idea about the theory goes back to Kraus and Litzenberger (1973). Their main hypothesis was that it existed an optimal level of financial debt, which maximizes the value of the firm. The optimal level can be attained when the increase in the present value of the costs associated with issuing more debt are offset by the marginal value of the benefits as-sociated with debt issues (Myers, 2001). Debt generates some benefits in form of tax de-ductibility of interest payments, and these benefits favor the use of debt. But this simple ef-fect can however be complicated by the implementation of personal taxes (Miller, 1977) and non-debt tax shields (DeAngelo & Masulis, 1980). The costs associated with issuing more debt are the agency costs that occur in conflicts between shareholders and debtors (Jensen & Meckling, 1976), and costs of financial distress. The costs of financial distress arise when a firm uses unnecessary debt and is unable to meet the interest and principal payments. Because the financial distress costs cannot be stated in a precise way, no formula has been developed to determine the firm’s optimal level of debt (Ross S. A., Westerfield, Jaffe, & Jordan, 2008)
2.1.4 Agency Conflicts and Reduction of Agency Costs
The agency conflicts that can occur in a buyout are between the limited partners, the inves-tors in the PE fund and the general partners, the PE fund managers. Since the GPs have limited liability, they sometimes tend to invest more aggressively and add more leverage to their deals if the liquidity in the debt markets are high or/and interest rates are low. These actions are more consistent with market timing than trade-off theory (Axelson et al., 2010).
These conflicts between GPs and LPs are a source of agency costs (Bergström, Grubb, & Jonsson, 2007). A benefit that comes with debt is that it reduces agency conflicts, because of those corporate managers usually have an incentive to waste cash on bad investments and perquisites. When financed with debt, the free cash flow available to managers is lim-ited and thereby helps to control the problem (Jensen & Meckling, 1976). The PE firms’ ability to closely monitoring the managers’ decisions and actions is a crucial factor to make sure that shareholder value is maximized. Since ownership after a buyout is fairly concen-trated, this monitoring over the managers’ strategic decision is easier than for most other firms (Bergström et al., 2007).
2.1.5 Market Timing
The trade-off theory implicitly assumes semi-strong form market efficiency. When the market is efficient securities are always correctly priced, and the market timing decisions are unimportant. But the capital market can actually be inefficient. When firms try to minimize the cost of capital, the fact that the market is inefficient has important implications for cor-porate financing (Stein, 1996). Imagine a firm whose managers are considering when to is-sue equity; this type of decision is called the timing decision. When managers believe that their stock is overpriced, they are likely to issue equity immediately. By issuing stock, they create value for the current stockholders because they are selling the stocks for more than they are worth. Conversely, if the managers believe that the stock is undervalued they will wait for the price to rise to its true value (Ross et al., 2008). Market timing is frequently dis-cussed in relation to PE activity and buyouts. It is often argued that PE practitioners in-crease the leverage of the deals because of the favorable market conditions, with low bor-rowing interest rates, in order to make money on the debt and equity markets. This means that instead of looking at the firm’s characteristics suggested by the trade-off theory, buy-out leverage respond more to debt market conditions (Axelson et al., 2010). Another aspect of the market timing theory with respect to private equity activity is the market timing with respect to industries, the PE firms’ abilities to pick companies in industries that expect a to have a positive development during the holding period (Bergström et al., 2007).
2.2 Previous Studies
Many articles concerning private equity and buyouts the last twenty years are referring to Michael C. Jensen’s article Eclipse of the Public Corporation from 1989. In this article, Jensen predicts that in the future, actors within leveraged buyouts would be the dominant corpo-rate organizational form. The leveraged buyouts activity had increased in that decade and Jensen means that the structure of private equity firms’ ownership, with performance-based managerial compensation, highly leveraged capital structure and active governance were superior to the typical corporations with public shareholders. Further, the article describes how the massive organizational changes in the economy are caused by manifestations such as takeovers, leveraged buyouts, corporate breakups and going private transactions. These different types of transactions have led to contrarious opinions among business leaders. Changes are always threatening; therefore the opposition against this fairly new innovation in the economy was understandable. This opposition is still a debated issue and is discussed in many articles by prominent researchers such as Strömberg and Kaplan.
The attempts in previous literature to see the impact of buyout on firms have been many, although they are usually conducted either on the U.S. market, the European market or in some cases on the U.K. market. Studies made concerning the impacts of buyouts on Swe-dish companies are rare. Of the few we found, we have chose only to include one, which
2.2.1 The Operating Impact of Buyouts in Sweden
Bergström et al. (2007) analyzed the determinants and level of buyouts, which were PE sponsored. In the article, they use three different measurements as an indicator of operat-ing profitability, EBITDA, Return on Invested Capital and Growth. They motivate their choice of studying operating performance by saying that they believe that improvements in a firm’s operating performance is the only true value creation. To explain the operating im-pact, Bergström et al. (2007) use a regression model with different parameters such as change in wage level, change in labor force, management incentives and leverage to explain the change in EBITDA margin. Their main findings are in line with the previous empirical studies made internationally, showing that private equity does create a substantial value. They find a posi-tive 3.07% units impact when looking at the changes in EBITDA margin and they cannot see any evidence that the value created is transferred from the employees. According to Bergström et al (2007) it is surprisingly that they don’t find a significant positive impact on value created by increased management ownership or increased leverage.
In the upcoming sections, the authors have chosen to structure the presentation of the previous research made internationally based on performance measure.
2.2.2 Operating Performance – Financial Measurements
Kaplan (1989) investigates the effects of 76 management buyouts (MBOs) in the U.S. on operating performance and value. These buyouts were completed between 1980 and 1986. Out of the 76 companies, 48 of them had post-buyout information, and they experienced an increase in operating income (before depreciation) and in net cash flow. They also showed a reduction in capital expenditure. Kaplan (1989) measures the changes in these cash flows in three different ways: in levels, as a fraction of the total assets in the end of the year and as a fraction of the total sales in the end of the year. The reason for measuring cash flows in relation to total assets and sales is for controlling for post-buyout asset divest-itures and acquisitions. Kaplan finds that the changes in operating income and net cash flows in relation to both assets and sales were considerably higher than the same changes for other firms in the industry. He further tests whether these changes represent valuable economic changes by estimate market-adjusted returns to pre-buyout public shareholders and to post-buyout investors. The results suggest that buyouts are associated with valuable operating improvements. Kaplan’s results regarding the operative changes are in line with those in Smith (1990) and Lichtenberg & Siegel (1990). Smith (1990) studies the changes in the operating performance for 58 post-buyout American firms by looking at operating cash flows before interest and taxes, deflated operating assets and the number of employees. Her results indicate that operating returns tend to increase from the year before buyout to the year following it. Because of the insignificant changes pre-buyout, according to Smith, the operating changes depend on the buyout. The results do not support the claims that the short-run cash flow increase is achieved by cutbacks in R&D, maintenance and advertise-ment since these capital expenditures are a non-operating use of cash. Smith (1990) con-cludes that improved management incentives are the reason for the increase in operating returns. Lichtenberg & Siegel’s (LS) (1990) research differs from Kaplan’s (1989) and Smith’s (1990). According to LS, the usage of a different database gave them an advantage allowing them to study divisional LBOs as well as full LBOs, not only full firm LBOs as Kaplan (1989) and Smith (1990). This gives LS a larger sample since almost half of the ma-jor buyouts were divisional buyouts. LS study the performance on a lower level off aggre-gation – the plant level in U.S. firms between 1981 and 1986. They also use a different measure of the performance – the total factor productivity (TFP). They argue that TFP is perhaps the purest measure of technical efficiency and that theory has suggested that it is
an important determinant of financial and economic variables such as profits, stock prices and real wages. Their findings are in line with Kaplan (1989) and Smith (1990) for the years 1983-1986, where the buyouts had effects of the productivity of the plants. On the other hand, in the years 1981-1982, they could not see any effects of the buyouts of TFP.
Harris, Siegel and Wright (2005) made a study with the purpose to extend the type of study that LS had previously done, by applying more sophisticated econometric techniques and incorporating more control variables. They are also using more recent data since the sam-ple includes buyouts between 1994-1998. While LS tested the effect in the U.S., Harris et al. (2005) tested the effects in the U.K. Their results are in line with LS’, showing that the plants involved in a buyout see an increase in total factor productivity. According to the re-sult the productivity gains seem to be even higher in the U.K. than in the U.S. The increase in TFP seems to be present when looking at different industries since 14 out of 18 indus-tries experienced this TFP-increase. Harris et al. (2005) try to explain these productivity gains by an increase in labor productivity. That labor productivity can assumingly be caused by the new managers’ actions to reduce labor intensity of production and instead use out-sourcing.
Muscarella & Vetsuypens (MV) (1990) conduct a similar study to those previously men-tioned, with focus on performance. The main difference is that they study reverse LBOs – companies that recently had been taken private by an LBO and then went public again. When a company goes public, information about the past few years, when the company was held private are presented in an IPO prospectus. This gives them an opportunity to study direct evidence of the buyout. Similar to LS (1990), they included divisional buyouts in their study. The results from this study show that the companies had undertaken a lot of restructuring activity to make the operations more efficient. These actions has led to re-duced costs and improved profitability. The conclusion drawn in the article means that there are evidence that changes in the governance structure enables the owners to use the assets of the corporation more efficient to create higher value.
Badunenko, Baum and Schäfer (2010) test the impacts of PE activity on both listed and un-listed European firms during the period 2002-2007. They measure the performance by ROA. The paper provides evidence that suggest that PE investments are harmful to firms in a shorter period. According to them, the detrimental effect disappears if the PE firm stays for longer than six years.
In CMBOR’s survey conducted on behalf of EVCA (2001) they analyzed 300 responds from European companies who had undergone a PE backed buyout between the years 1992 and 1997. According to their data there is not only an increase in growth the year af-ter the buyout but also a steady increase in following years. The mean increase in turnover for the companies in the surveys is 13% and 17% per year the three following years. The earnings before interest and taxes (EBIT) also increased steadily over the next three years for the companies. When looking at these increases it is appropriate to compare these with numbers from their competitors. Two thirds of the companies experienced that since the buyout, their turnover and EBIT grew faster than their competitors’.
Guo, Hotchkiss and Song (2009) show, similar to Kaplan (1990), how the performance of a portfolio company has changed by looking at changes in operating value. They find that the operating performance is on the same level or sometimes exceeds the operating per-formance of benchmark firms matched on industry. They also concludes that capital in-vested pre-buyout or post-buyout are large and positive.
2.2.3 Employment & Wages
Kaplan (1989) also tests the impact of the buyouts on employment and finds that the me-dian change in employment was 0.9%. This measure treats decreases in the job force for the sake of divestitures as decrease in employment. The measure of a subsample of buyouts that did not do any large divestiture after the buyout, showed a median increase of 4.9%. These results show nothing in line with the claims that buyouts cause layoffs. Smith (1990) found similar results with a median increase of 2% in employment. Lichtenberg & Siegel (1990) cannot see any reduction of employees (blue-collar workers). They also investigate the production workers’ wages and finds that the annual compensation had increased be-tween one year before the buyout and two years after it.
Amess & Wright (2010) conduct a systematic analysis of the effect of private equity and LBO governance on employment and whether the size of the target firms have impact on employment effects. They find that LBOs have no effects on employment, no matter if the buyout is backed by a private equity firm or not. The analysis does not present any results that the size of the target firm have impact on employment.
In CMBOR’s survey (2001), 60% of the respondents state that the firm had an increase in the total number of employees since the buyout. Their survey also shows that the total number of employees had increased by 40% per firm and also that the employee compen-sation had increased.
In contrast to these findings, Goergen, O’Sullivan and Wood (2011) studies the employ-ment consequences of buyouts in the U.K. and found that employemploy-ment reduces in the first year after the buyout. They do not find any evidence that this reduction in employment af-fected the productivity or profitability positively.
2.2.4 R&D and Innovation
Lichtenberg & Siegel find that, although not statistically significant that the mean relative R&D intensity is lower three years after the buyout than in the three years before the buy-out. Further they argue that this change will be biased downward if the most R&D intense parts of the company will be sold out, which is often the case. LS also mean that LBO tar-gets are less R&D intense, compared to other firms.
Lerner et al. (2011) examine buyout firms’ investments in innovation as measured by pa-tenting activity. They examine patents filed by 472 firms that received PE backing between 1986 and 2005. This study was conducted to see if LBO firms sacrifice long-term growth to boost short-term performance. The findings show that the patents that PE backed firms applied for in the years after the buyout transaction are more cited and that the PE backed firms’ patent portfolios became more focused in the years following the buyout. Based on this research they argue that there is no evidence that LBOs sacrifice long-term invest-ments.
CMBOR states that the companies included in their survey use the buyout investment to spend on vale-adding activities such as R&D and employee training (EVCA , 2001).
2.2.5 Other
Bloom, Sadun and Van Reenen (2009) have in a survey collected data from over 4000 me-dium size manufacturing firms across Asia, Europe and the U.S. concerning management practice. According to them, the measures of management practice are strongly related to the firms’ performance. They find that PE owned firms are considerably better managed
than family-, government- and privately owned firms. When looking at the different part of management they see that PE owned firms showed strong people management practices – including hiring, firing and promotions as well as strong operating management practices – including continuous improvement, lean manufacturing and monitoring.
According to CMBOR (2001), the existence of PE backing does not have only financial advantages among the surveyed companies but also a non-financial input. The PE firms al-so act to improve operational performance and management ideas. The survey alal-so indi-cates that since the buyout, the companies’ exporting activities have increased.
3 Method
In this chapter we will describe the chosen research method that have been applied in this thesis. The reader will also be provided with an insight in which research design and quantitative methods that has been used. Lastly, the data and sample collection will be explained.
3.1 Methodological Approach
According to Patel and Davidsson (2003) there are two different approaches to empirical research, positivistic approach and hermeneutic approach. The positivistic approach refers to that knowledge has to be confirmed and have the capability of improving the state of present knowledge. The hermeneutic approach is the opposite of the positivistic approach and is established by studying and interpreting the foundations of the human existence. The positivistic approach is usually used when gathering quantitative data while the herme-neutic approach is used in interpreting people’s actions and instead of verifying results it serves to get a new and better understanding. In this thesis we will gather and analyze quantitative data, which is a part of the positivistic approach (Saunders, Lewis, & Thornhill, 2009). As a tool for the analysis we will use existing theories to create hypotheses that will be tested through statistical methods.
3.2 Research Approach
According to Lewis, Saunders and Thornhill (2007), method is the process to obtain and analyze data. The general approaches used in academic research are the deductive approach and the inductive approach. When carrying out a deductive approach you seek for a de-scription of a specific phenomenon, you make use of existing theories to create a hypothe-sis and to develop a strategy and a research question allowing for an analyhypothe-sis to reach a conclusion and possible confirmation of the hypothesis (Saunders et al., 2009). Meanwhile, when using an inductive approach the researcher tries to understand the reason behind the occurrence of a specific phenomenon by starting with an observation and continuing with broader generalizations and theories to come up with a conclusion (Sekaran, 2003). One advantage connected to the inductive approach is the low need of a clear defined theoreti-cal framework, since the researcher is aiming to identify the relationship between the col-lected data. Therefore, this approach can be of use when a subject is relatively new and when there is little literature available. Contrarily, there also exist several gains of using a re-search derived from theories and earlier rere-searches, which is the case of the deductive ap-proach. Using this approach, allow us to link the subject to existing theory and make it pos-sible for an analytical framework. A combination of these two approaches also exists, the abductive approach. It is focused on discovering a phenomenon instead of modifying it, while usually testing the existing theories it focus on how the theory has been developed (Saunders et al., 2009).
For this paper we have chosen to use the deductive approach, which based on existing the-ories helps us to explain how buyouts affect the portfolio companies. The use of adjusting models into the framework is a classical example of using existing theory as an explanatory factor. Considering the timeframe of this paper, the deductive approach also is more favor-able because it is usually quicker to perform (Saunders et al., 2009)
Research methods could include statistical techniques, non-statistical techniques, inter-views, observations and questionnaires. Previous researches in this subject have included all mentioned methods. Nevertheless, research objectives, time limitations and costs will
pre-vent us from using all of them, and we have chosen to use statistical techniques to answer our research questions. Because of the extensive previous research and theories concerning buyouts and private equity, the approach most suitable for our thesis proved to be a tive research. Also, in the already existing research the majority has been using the deduc-tive approach. Based on this approach, we have chosen to use a methodology similar to Bergström et al. (2007), which will help us to fulfill the purpose of this thesis. The aim is to gather quantitative data and testing hypotheses to get results and draw conclusions using existing theories and comparing the results with previous studies of the subject.
To answer the research questions, one should use exploratory, descriptive or explanatory studies. An exploratory study is the best one to use when you are seeking for new insights to a specific phenomenon and also to clarify your understanding of it. In order to conduct an exploratory research, Saunders et al. (2009) argue that there are three ways to do so, a search of the literature, interview experts in the subject and conduct focus group inter-views. The goal with a descriptive study is to describe an event or a situation. This could be seen as an extension of the explanatory study. It is important to have a clear picture of the specific phenomena on which you want to collect data. The most suitable research for our problem is an explanatory research. The purpose of an explanatory study is to study the re-lationship between different variables, which will be done when evaluating how different variables affect the performance of the portfolio companies. This type of research is usually used together with quantitative data collection (Saunders et al., 2009).
3.3 Research Method
There are two types of methods that can be used in research studies, the qualitative method and the quantitative method. The most significant difference is seen in the start up phase when data is collected. The quantitative method originates its meaning from numerical and standardized data. Meanwhile, the qualitative research method has a purpose of creating a deeper understanding of the issue (Saunders et al., 2009). In the quantitative method, relia-bility and validity are of vital importance to enable for conclusions and reuseof the data. In contrast, the qualitative method provides a better in-depth understanding of the analyzed subject and emphasizes on how the respondent identifies the subject (Bryman, 2002). Since the purpose of this thesis is to see the buyouts’ impact on portfolio companies in Sweden, a qualitative method would have made it impossible to draw conclusions regarding Sweden as a whole. A quantitative method gives us more data, although not as specific as a qualita-tive method.
3.4 Research Process
After gaining knowledge and locating articles concerning our main subject of interest we started searching for useful statistical methods among them. The criteria for the methods were that it had been used in similar studies as the one we were planning to conduct. We found a study made by Bergström et al. (2007) that were similar to the one we had in mind. It has provided the main influence of the model in this thesis and parts of the research and theory are based on their study.
3.5 Research Design
According to Lewis et al. (2007) there are numerous ways to create a research, either by survey, case study, experiment, action research, grounded theory, archival research or eth-nography. It is also possible to combine methods to get a more reliable result.
To see the buyouts’ impacts on portfolio companies we decided to do an event study. An event study is an alternative to a case study. Economists are regularly asked to measure what impact an economic event has on the value of firms. This seems to be a difficult task, but an event study can be used as a measure for this. The use of an event study has many applications, in finance and accounting research this studies have been useful to a variety of events like, earnings announcements, mergers and acquisitions, issues of debt or equity, and announcements of macroeconomic variables (MacKinlay, 1997).
An event study does not have any unique structure, but it should follow a general flow of analysis. The primary task in conducting an event study is to define the event of interest and classify the timeframe of the event; this is called the event window (MacKinlay, 1997). In our case the event is the buyout and the window will be the holding periods of PE firms between 1998 and 2011, where we will compare buyout companies’ performance in the exit year relative to the entry year to see if there exists a difference. This event study is similar to Bergström et al. (2007) where they investigate the operating impact of 73 buyouts. They form the event window around the holding period, where the event window reaches from 1998 to June 2006. Similar to Bergström et al. (2007), we have, since holdings are entered and exited throughout the year, added a cut-off line after six months in every year. If the buyout took place in the first six months of a certain year, we have chosen to measure the values from the year before that certain year to make sure to see the effects of the event. The same strategy has been applied for the exits.
When the event window it set up, it is necessary to determine the selection criteria for in-cluding a company in the research. The criteria can involve limitations about availability of data, such as listed on the Stockholm Stock Exchange or include membership to a certain industry. (MacKinlay, 1997). The criteria in our event study are that a PE firm has entered and exited a Swedish firm (portfolio company) between the years 1998 and 2011. The crite-ria for the peer group companies in our study are that they have to exist throughout the same time period as our portfolio companies and belong in the same industry classification group.
To value the event’s impact the study it is necessary to include a measure of abnormal re-turn. This abnormal return is calculated as the actual return of the investment of interest over the event window less of normal return over the same time period (MacKinlay, 1997).
( | ) (1)
Source: MacKinlay (1997) p. 15.
Where is the abnormal return, is the actual return and ( | ) is the normal
return.
In our study the measures are abnormal change in Earnings Before Interest, Taxes, Depre-ciation and Amortization in relation to turnover (EBITDA Margin) and Return on Assets (ROA) from the time when the PE firm entered until the time the PE firm exited. In our case the normal change in EBITDA Margin and ROA is measured as the change in the peer group companies’ EBITDA Margin and ROA.
We have chosen to use two different performance measures in our analysis, the EBITDA Margin and the ROA. When using a deductive research approach an important issue is to make the fact operational (Saunders et al., 2009). Below it is described how we made the collected data operational:
(2)
(3)
The change in EBITDA Margin and ROA has been calculated respectively:
– (4)
(5)
3.6 Data Collection
In the collection of data, two different sources can be used: primary data and secondary da-ta. The difference between these two types is how the data is collected. When collecting new data directly from a source, it is referred to as primary data collection (Saunders et al., 2009). This kind of data can be collected through interviews and observations etc. The primary data is collected for the purpose to reach a conclusion concerning a certain subject (Arbnor & Bjerke, 1995). Data that have already been collected for another empirical re-search are known as secondary data. This type of data can be collected from former per-formed research and studies (Saunders et al., 2009) and be used for other purposes intend-ed (Arbnor & Bjerke, 1995). Sources for secondary data usually consists of the Internet, scientific articles and books (Saunders et al., 2009).
To fulfill the purpose of this thesis we have chosen to use only secondary data. To get an even deeper understanding of the subject, primary data would have been helpful to use but because of the time frame and lack of availability of primary sources we chose not to gather this type of data. We believe that only secondary data is useful enough to give us a reliable result.
To gather the secondary data we have used the databases Business Source Premiere, Affärsdata, JSTOR and Amadeus. Business Source Premiere and JSTOR have been used mainly to search for scientific articles, journals and reports related to the subject while Affärsdata and Amadeus have been used in collecting financial information about the companies. Statistics concern-ing the PE activity has been gathered from SVCA, EVCA and NVCA. In the gatherconcern-ing of the companies’ financial information we have gone through plenty of their financial state-ments. Under Swedish law all joint-stock financial institutions and firms must declare their audited annual accounts to the Swedish Companies Registrations Office (Bergström et al., 2007). This is very helpful in collecting the data. These financial statements can often be found through the previously mentioned databases. The databases also often include financial in-formation about private companies, when this is not the case, the financial reports can of-ten be found on the company’s webpage. Since the companies are Swedish, the financial data from their annual reports were often stated in SEK. To convert them into EUR, we have used the average yearly exchange rates from Riksbanken, which is the Swedish Central Bank (see Appendix 4). Unfortunately, some financial statements has been very hard to lo-cate and thereby some companies had to be removed from our sample.
3.6.1 Credibility
It is important for us to ensure that the information we provide is valid and reliable. Ac-cording to Saunders et al. (2007) we have to reduce the possibility of getting the wrong an-swers by paying attention to two particular emphases on research design: validity and relia-bility. “Reliability refers to the extent to which your data collection techniques or analysis
procedures will yield consistent findings” (Saunders et al., 2009, p. 156). The theoretical framework of this thesis is based on published literature and articles. Even though, many of the authors of the used literature are known researchers in the area of private equity and buyouts the collected material used for this thesis have been analyzed thoroughly in order to provide the best outcome. Our data has been collected from well-known and reliable da-tabases such as Amadeus and Affärsdata. To see if our research is reliable is according to Easterby-Smith et al. (2008) assessed by posing the following three questions:
Will the measures yield the same results on other occasions?
Will other researchers find the same observations?
Is there transparency in how sense was made from the raw data?
Since we have used well-known databases, unless the provider changes them, other searchers will find the same observations as we found and if the data is used in other re-search is the same we expect that they will yield the same results. Our ambition in this the-sis is to thoroughly guide the reader through the whole process and motivate and explain the usage of the data collected. Robson (2002) states that there are four threats to reliabil-ity, the subject or participant error, subject or participant bias, observer error and the ob-server bias.
Whether the findings really are about what they appear to be about are known as validity. If you want to find a result that you can generalize over a population, you want to make sure that the sample used is appropriate (Saunders et al., 2009). The validity of our research is ensured by the large sample used. As mentioned earlier when using a sample larger than 30, one can assume a normal distribution and a result that is representative for the whole population (Berk & DeMarzo, 2011). Robson (2002) argues that we have to be concerned about various threats when thinking about the validity; history, testing, instrumentation, mortality, maturation and ambiguity about causal direction are all important aspects that you have to deal with in order to get a valid result.
3.7 Analyzing Quantitative Data
When you intend to perform a quantitative analysis you need to consider many aspects, what type of data do you want to collect, in what format do you want to use it, perhaps you need to use weight cases, and what method are you going to use when searching for errors in the data. If all of these are considered before collecting the data you will end up with a more reliable result (Saunders et al., 2009).
Quantitative data can be separated into two different groups, categorical and numerical da-ta. The categorical data denote data that cannot be measured numerically, nevertheless can be classified into groups dependent on the characteristics that describe the data (Saunders et al., 2009). Numerical data are measured in numbers and the statistical use of it is greater than for categorical data. This data category is more suitable for us, since we will use statis-tical techniques to come up with some sort of results. In order to get a more accurate re-sult, the use of a greater amount of data increases the reliability of our results. Therefore, we have collected the data needed and used Excel and SPSS to analyze it.
3.8 Sample Collection
The previous studies and research made in this field has primarily been conducted on U.S. data. In the U.S. there is an unavailability of financial and accounting data for firms that are not traded publicly. This creates a possible sample bias in these studies since it limits the
aim of the studies to mainly reverse LBOs (Bergström et al., 2007). The previously men-tioned Swedish laws concerning joint-stock companies gives us benefits in collecting the sample.
In the search for Swedish companies that have been bought out and sold by PE firms be-tween the years 1998 and 2011 we were provided by a list by our supervisor who has done research in the field before. This list contained the major buyouts of Swedish companies made by Swedish as well as international PE firms between the mid 1980’s until 2011. Be-cause of the difficulties to gather financial information from a time that long ago we decid-ed to limit our sample to entries and exists between the years 1998 and 2011. We enddecid-ed up with a population of 73 companies and we drew a random sample of 45 because the gath-ering of data was expected to be quite extensive and time demanding. Because of the diffi-culty to gather data from the late 90’s and other reasons like the struggle to trace a compa-ny’s history through name changes and firm type changes, the sample size decreased from 45 to 42 portfolio companies with values of ROA and from 45 to 36 companies with val-ues of EBITDA Margin.
3.9 Peer Groups
Recall that abnormal return is measured as actual return minus normal return (see eq. 1) and in this thesis abnormal change in EBITDA Margin is measured as actual change in EBITDA Margin minus the normal change in EBITDA Margin (see eq. 6). The normal change in EBITDA Margin has in this thesis been measured as the change in EBITDA in companies who act in the same industry, the peer group.
(6)
The peer groups have been assigned in the same way as for example in Kaplan (1989) and in Bergström et al (2007), by using official industry classifications. While Kaplan (1989) used American Standard Industrial Classification (SIC) system we will just as Bergström et al (2007) use the Nomenclature Generale Des Activites Economiques dans l’Union Euro-penne (NACE 1.1) system, because it is structured to fit the EU industry structure.
We have used the four first digits of the NACE code of the portfolio companies and used the database Amadeus to find the peer group companies. We then used the ten companies with the highest turnover where the financial data were available to calculate the average. In case where information was unavailable for one company, we chose to use the next com-pany on the list. The companies were sorted by turnover of today, which necessarily do not mean that they were the largest during the whole holding period.
4 Test Methodology
In this section we will start by presenting the hypotheses we have tested in order to answer our research ques-tions. Further, the different statistical methods of testing the hypotheses will be presented.
4.1 Hypotheses
In the first two hypotheses and we test whether buyouts have an impact on portfolio
companies or not. We will then test whether the PE firms have market timing with respect to industry or not. This test serves to see if the PE firms have the ability to pick portfolio companies in an industry with expected positive development. Further we will test hypoth-esis regarding the kind of impact PE firms have on portfolio companies in terms of em-ployment and wages.
4.1.1 Operating Performance
The operating statistic measure we have chosen to investigate is the change in EBITDA Margin, which are the period’s earnings before interest, taxes, depreciation and amortiza-tion divided by the periods turnover (see eq. 2). This will according to Barber and Lyon (1996) give us a pure measure of the performance of the firm since it do not includes fi-nancial earnings and costs and tax payments.
The hypothesis used for testing the change in operating performance is:
The operating performance of the portfolio companies has during the holding period
been improved in relation to their respective peer group.
4.1.2 Overall Performance
We have also chosen to examine the change in ROA between the entry year and the exit year. ROA is calculated by dividing the net income with the book value of the total assets (see eq. 3). By using the net income instead of the operating income we will see the effect of the change in the capital structure of the firm, which is often present in a buyout, which in turn affects the interest and tax expenses and therefore the net income (Barber & Lyon, 1996). This is the reason why we chose to call it overall performance. According to Berg-ström et al. (2007) ROA will theoretically give a neutral comparison across industries, con-sidering both capital efficiency and profit margins.
The hypothesis used for testing the change in overall performance is:
The overall performance of portfolio companies has during the holding period been
improved in relation to their respective peer group.
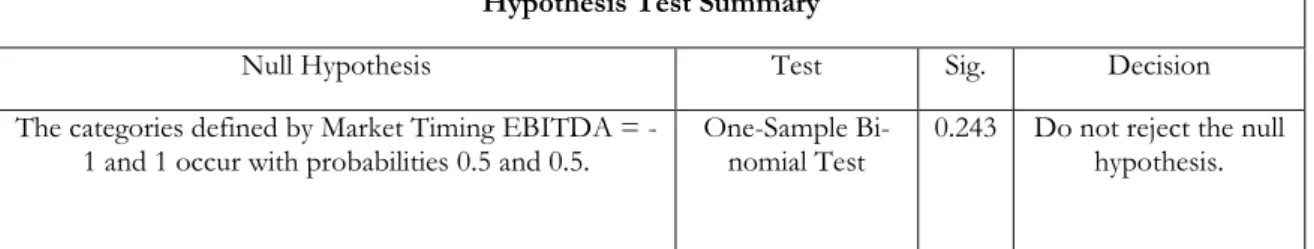
4.1.3 Market Timing
We have chosen, similar to Bergström et al (2007) to test market timing with respect to in-dustry. The reason for this is to see whether PE firms are able to pick companies acting in an industry that expects a positive development or not. If this is the case, the reason for success of a portfolio company might originate from an industry boost instead of impacts caused by the buyouts.
The hypothesis used for testing market timing is:
4.1.4 Change in Wages
To see what kind of impact PE firms have on the portfolio companies we have decided to test if the performance of the portfolio company during the holding period has a negative correlation with wages, namely if there is any indication that improved performance is due to wage reductions. Opponents of private equity have claimed that the portfolio compa-nies’ improved performance is due to wage reductions (Chapter 1.2). We have chosen to measure wage per employee at the time of the entry and at the time of the exit. Wage per employee has been calculated as:
(7)
The measure we will use in this test is the change in ROA, since this is the most accurate measure of overall performance included in our thesis.
The hypothesis for testing if change in ROA and wage per employee has negative correla-tion is:
There is an inverse correlation between change in ROA and change in wages per em-ployee.
4.1.5 Change in Employment
To investigate the change in employment among the portfolio companies, we will here conduct a similar test as in 4.1.4. The reason for doing this test is also due to the fact that opponents of private equity often claim that private equity activity leads to work layoffs. We want, through this test to see if this is really the case.
The hypothesis for this test has been constructed as follows:
There is an inverse correlation between change in ROA and change in employment. The change in employment has been calculated as:
–
(8)
We have chosen to measure the change in percentage because of the difference in size of the portfolio companies. In the test, we have excluded the companies of which we have had the reason to believe that the change in employment has had something to do with some kind of restructuring. This has been the case when we have seen an abnormal in-crease from one year to another. As a complement to the first test, to make it clearer to see the impact this measure has on the portfolio companies, we have chosen to investigate if there is any difference between the change in employment between the portfolio compa-nies and the peer group compacompa-nies.
The hypothesis for this test has been constructed as follows:
There is a difference between the changes in employment between the portfolio com-panies compared to the peer group comcom-panies.