New Trends in Business Intelligence
A case study on the impact of organizational demands of information and
new technologies on BI
Master’s thesis within informatics, 30 credits
Author: Navid Naghdipour
Tutor: Klas Gäre
Master’s Thesis in Informatics
Title: New Trends in Business Intelligence
Author: Navid Naghdipour
Tutor: Klas Gäre
Date: 2014-03-04
Subject terms: Business Intelligence, Decision support, Business Analytics, Trends in Business Intelligence.
Abstract
When the data warehouse concept was first introduced by IBM as a part of their new information system in 1988, the first step in the field of modern decision support systems or business intelligence was taken. Since then, academics, practi-tioners and solution developers have put a considerable effort in introducing new trends of these systems.
Each new trend has roots in what enterprises demand from these systems. The advances in Web technologies and social media, has led to introduction of new trends such as Cloud BI and Big Data which are both cost-effective and also have the potential to take advantage of semi-structured and unstructured data within organizations.
This paper deals with these new trends and the influences of organizational de-mands and new technologies and tools on them. A deep literature review deals with four major BI trends in detail. (Data warehouse, Business Performance Man-agement (BPM), Cloud BI and Big Data). Two case studies from local Business intelligence developers are carried out in order to explore the influences men-tioned above.
As the result of this study, a model is proposed that addresses the elements that affect the BI trends, both in organizational and technological perspectives. It is observed that despite the fact that lots of new trends have been introduced in the past years (e.g. Cloud BI and Big Data), it does not necessarily mean that older trends are becoming obsolete. Data warehouses and BPM systems are still being used vastly in the industry. However, the later trends can be offered to clients that have the demand for them.
The results imply that Cloud BI is mainly suitable for companies with low initial budgets and Big Data can be adopted by organizations that want to exploit their social data sources. The mere fact that both implied trends are built upon their preceding ones, has transformed data warehouses and BPM approach the ground work for any new trends to come.
Table of Contents
1
Introduction ... 1
Background ... 1 Problem ... 1 Purpose ... 2 Research Questions ... 3 Delimitations ... 32
Theoretical Framework ... 4
Introductions and Basic Concepts ... 4
2.1.1 Data vs. Information ... 4
2.1.2 What is Business Intelligence? ... 4
2.1.3 A Data Framework for BI ... 5
2.1.4 Architecture of BI ... 7
2.1.5 History of BI ... 10
BI and Organizations ... 14
2.2.1 BI and organizational demands ... 14
2.2.2 IS success model ... 14
BI trends ... 16
2.3.1 Data Warehouses ... 16
2.3.2 Business Performance Management (BPM) ... 22
2.3.3 BI in the Clouds ... 24
2.3.4 Big Data ... 27
Technologies and tools in BI ... 29
2.4.1 Data Storage... 30
2.4.2 OLAP Servers ... 30
2.4.3 In-Memory technology ... 30
2.4.4 Parallel processing and appliances ... 31
2.4.5 Cloud data services ... 31
2.4.6 Hadoop ... 31 Theoretical wrap-up ... 32
3
Research methodology ... 34
3.1 Research design ... 34 3.2 Research approach ... 34 3.3 Research method ... 35 3.4 Research strategy ... 35 3.5 Literature review ... 36 3.6 Data collection ... 37 3.7 Data analysis ... 37 3.8 Reliability ... 38 3.9 Validity ... 394.
Empirical findings ... 40
4.1 Pdb ... 40 4.1.1 About ... 40 4.1.2 Main operations ... 40 4.1.3 Main BI Clients... 40 4.1.4 Expected outcomes of BI ... 404.1.5 The latest trend offered to clients ... 40
4.1.6 Awareness of the latest trends ... 41
4.1.7 The importance of getting the latest trends ... 41
4.1.8 The frequency of upgrading ... 41
4.1.9 Expectations of BI users from the newer trends ... 42
Big Data yet? ... 42
4.1.10 The role of the new technologies ... 43
4.1.11 Success of the trends ... 43
4.1.12 Motivations behind the upgrades ... 43
4.1.13 The new trends and organizational demands ... 44
Cloud BI ... 44
Big Data ... 44
4.1.14 The new trends and technology ... 45
4.1.15 The future ... 45 4.2 Evry ... 45 4.2.1 About ... 45 4.2.2 Main operations ... 46 4.2.3 Main BI clients ... 46 4.2.4 Expected outcomes of BI ... 46
4.2.5 The latest trend offered to clients ... 47
4.2.6 Awareness of the new trends ... 47
4.2.7 Importance of getting the latest trends ... 47
4.2.8 The frequency of upgrades ... 47
4.2.9 Expectations of BI users from the newer trends ... 48
4.2.10 The role of technology ... 48
4.2.11 Success of the trends ... 49
4.2.12 Motivations behind the upgrades ... 49
4.2.13 The new trends and organizational demands ... 49
Cloud BI ... 49
Big Data ... 49
4.2.14 The new trends and technology ... 49
4.2.15 The future ... 50
5.
Analysis... 51
5.1 Main expectations of BI ... 51
5.2 The role of the facilitator ... 52
5.3 Trends on the market ... 53
5.4 Expectations of organizations from the new trends ... 53
5.5 Success of the trends ... 54
5.6 Motivations behind upgrades ... 54
5.7 New trends and organizational demands ... 55
5.8 New trends and technology ... 56
5.9 Proposed model ... 58
6.
Discussion ... 61
6.1 Results discussion ... 61
6.2 Generalization ... 61
6.3 Contributions ... 62
7.
Conclusion ... 64
8.
References ... 65
Appendix ... 70
Appendix 1: Questionnaire design ... 70
Interview Questions ... 70
Figures
Figure 1.1. The causes of introduction of the new trends. ... 2Figure 2.1. Business Intelligence Data Framework (Negash, 2004) ... 6
Figure 2.2. A high-level architecture of BI. (Eckerson, 2003) ... 8
Figure 2.3. BI architecture for structured data. (Negash, 2004) ... 9
Figure 2.4. BI architecture for semi-structured data. (Moss, 2003) ... 10
Figure 2.5. Delone and McLean’s IS Success Model. (Delone, 2003) ... 15
Figure 2.6. Example of contents of business data warehouse (Devlin, 1988)17 Figure 2.7. Business Data Warehouse: Different types of data (Devlin, 1988)18 Figure 2.8. Star schema. ... 19
Figure 2.9. Snowflake Schema. ... 20
Figure 2.10. Enterprise decision evolution. Introduced by Teradata foundation. ... 21
Figure 2.11. BPM Approach. (Golfarelli, 2004)... 23
Figure 2.12. Business Intelligence Framework. (Gash, 2011) ... 24
Figure 2.13. Cloud-based business intelligence framework. (Gash, 2011) .. 25
Figure 3.1. Components of data analysis. (Miles, 1994) ... 38
Figure 5.1. Delone and McLean’s IS Success Model. (Delone, 2003) ... 52
Figure 5.3. Data warehouses and demands ... 55
Figure 5.4. BPM and demands... 56
Figure 5.5. Cloud BI and demands ... 56
Figure 5.6. Big Data and demands ... 56
Figure 5.7. Technologies/tools and trends ... 58
Figure 5.8. Proposed model; the influence of organizational demands and technologies and tools on new trends in BI. ... 59
Tables
Table 2.1. BI Data Type/Source Matrix. (Negash, 2004) ... 6 Table 2.2. Architecture component for semi-structured data. (Moss, 2003) . 101 Introduction
Background
Organizations and businesses are in constant change today and are becoming more com-plex. In order for the organizations to keep the profitability, they need to respond agilely to the changes and make quick decisions. The nature of these decisions is that they need to be made in a short time and have to be accurately made as well. Considering the risks of such decisions, organizations and scientists have been looking for ways to get support from computers and information systems in order to minimize risks. (Negash, 2004; Turban 2011).
What used to be simple payroll and bookkeeping functions done by computers has evolved into complex managerial areas “ranging from the design and management of automated factories to the application of artificial intelligence methods to the evaluation of proposed mergers and acquisitions.” (Ma-hapa, 2012, p. 122). Web-based applications are more into focused recently as they range from transaction processing to problem analysis and solution applications (Turban, 2011). From the early versions and editions of these systems the name “decision support systems” (DSS) has been considered an umbrella term to include the applications and functions mentioned above (Power, 2007). Today any computerized system that supports decision making in an organization, ranging from knowledge management systems to marketing, fi-nancial, accounting and supply chain management (SCM) systems can be gathered together under the umbrella term of DSS (Power, 2002).
In the beginning of DSS, managers had other staff do the analysis aided by DSS. As PC technology advanced, managers became more interested and got more comfortable with using computers themselves in order to make intelligent decisions. That led to an emer-gence of new concepts and tools such as online analytical processing (OLAP), data ware-housing, data mining and more accessed via Web, used by managers and decision makers. Later on in the mid-1990s, these tools were given the term Business Intelligence (BI) and Business Analytics (Turban, 2011).
It can be deduced from the introduction above that lots of potentials can be exploited for organizations which adopt BI. Power of analytics can be translated into responding to a lot of data related organizational demands from top management to lower ranks throughout the whole organization (Davenport, 2007). As BI trends and techniques bring support and inevitably changes to the organizations, organizations as well have influences on newer BI capabilities in order to support upcoming, ever-changing demands (Turban, 2011).
On the other hand new technologies play an important role in the way BI systems are ex-panding their goals and objectives. New technologies in database management, data ware-housing, web-based applications for reporting, cloud computing and many more have caused BI to take some turns that was not foreseen in the initial and more primitive ver-sions of these systems (Gash 2011).
The aim of this thesis is to fill the gap between these two areas and study the interrelation between them. The gap and how the problem arises from it is discussed deeper in problem section. A model is proposed at the end of the thesis to address the organizations, the trends and technologies from a holistic view.
Problem
re-(Devlin, 1988; Kimball, 2002; Inmon, 2005; Boateng, 2012), Business performance man-agement approach (Kaplan, 1992; Golfarelli, 2004) , Cloud BI (Kennedy, 2009; Gash, 2011) and Big Data (Adrian, 2011; Olofson, 2012; Simon, 2012; Nemschoff, 2013) that are to be considered as the main trends under study in this research, have been target to a good amount of research. On the other hand, technologies supporting the innovations in BI have also been studied quite well. Chaudhuri (2011) gives a good listing of the modern techniques used in newer BI trends.
However, there is a gap between these studies. First of all, a defining research that investi-gates these trends in interrelation with each other is lacking at present time. Golfarelli (2005) introduces new trends in BI but only suffices to mention data warehouses and BPM. Secondly, there is no robust and constructive research at present that deals with the insuffi-ciencies of the trends on one hand, and organizational demands for accurate and timely da-ta for analysis on the other, which leads to introduction of the newer trends. Figure 1.1 de-picts this relation.
Thus, in this thesis the focus is on this gap; the interrelation between the trends and their two sided influences on organizational demands of information and the aid of newer tech-nologies and tools in enhancing the introduction of these trends.
Figure 1.1. The causes of introduction of the new trends.
Purpose
The purpose of this study is exploratory. The author wants to investigate the influences of different phenomena in the way a concept is being developed. As the new trends are being studied and investigated, the forces and factors that lead to the newer trends will be recog-nized and addressed.
The author makes an assumption that there is a dynamic between three pillars of ‘new trends in BI’, ‘tools and technologies’ and ‘organizational demands of accurate and timely data’. The thesis is based upon this dynamic and empirical data is collected in order to sup-port the dynamic. As the result of the thesis, a model is proposed which is based on these three pillars and it proves that the dynamic exists.
There are a lot of trends in BI, some very influential and some not as much. In this thesis, the author will study four major trends in BI. The trends that will be studied are Data Warehouses, Business Performance Management (BPM), Cloud BI and Big Data.
Eventually, the aim is to introduce a model, consisting of factors, both organizational and technological, that have influenced new trends in business intelligence systems.
Hence, the proposed purpose will be partly to explore new trends and partly theory devel-opment.
Research Questions
As discussed in the previous section, this research consists of three blocks or areas: Organ-izational demands of accurate and timely data, BI trends, and technologies and tools that support and enhance the trends. The aim is to find the influences of each block on the oth-er. In the scope of this research, ‘main BI trends’ are Data warehouse, BPM approach, Cloud BI and Big Data. The reason for this limitation is that there are numerous trends that are being introduced every year. Studying all of the in the context of a master thesis is not possible. Moreover, majority of the trends are not new ideas from scratch, but they are mostly some additional functionalities to an existing trend. These four trends are consid-ered to be the major ones because they introduce new functionalities that were lacking in previous trends. The new functionality of each trend is discussed deeply in theoretical framework (chapter 2).
The aim of this research is to find the factors within organizations and their demands of data for decision making and the available technologies that enable the trends. Thus, two main research questions will be formulated as follows:
What are the organizational demands of accurate and timely data that have influenced the introduction and evolution of main new trends in BI?
What technologies and tools support (or enhance) the introduction of main new trends in BI?
Delimitations
The research is going to be based on an analysis of the companies who develop and pro-duce BI solutions. A part of it will be done by studying their motives behind every new trend that they introduce. Lots of new trends were also introduced by the academics and then were adopted by practitioners and solution providers.
In order to have a better focus on specific subjects in this thesis, four of the major BI trends have been identified and studies (the ‘main trends’ have been introduced in section 1.3). In order to gather analytical data to understand the dynamics between the three main pillars of this thesis (introduced in section 1.3), two case studies have been chosen. These are two companies that are both leading BI solution developers and they are located in Jönköping, Sweden.
2 Theoretical Framework
Introductions and Basic Concepts
In this section, some basic theories regarding Business Intelligence will be dealt with. They are the basis of theories that will be introduced later in section 2.2 - 2.4.
2.1.1 Data vs. Information
Information systems (IS) are built to achieve different goals. One of the generic goals of in-formation systems is to process data into inin-formation and/or knowledge (Turban, 2008). Therefore, it is important to be able to differentiate between them in order to better under-stand the information systems.
Data refers to “an elementary description of things, events, activities, and transactions that are recorded, classified, and stored, but not organized to convey any specific meeting” (Turban, 2008, p. 51). They come in different forms, e.g. numeric, figures, images, video, etc. Data are usually stored in databases where the stored data can be retrieved more efficiently for further use (Turban, 2008).
Information is the organized form of data so that they have meaning and value to the end user. Whereas a student’s grade in the class can be considered as data, a student’s grade point average can be classified as information since it provides interpretations and meaning to the recipient and conclusions can be drawn using it.
Data is usually processed into information by using computer-based applications. The end result of this processing is more useful and of higher value than the summary of retrieved data stored in the databases (Turban, 2008). Later on in the following chapters some of these tools and applications that will make analysis possible on raw data will be introduced. Last but not least, knowledge “consists of data and/or information that have been organized and pro-cessed to convey understanding, experience, accumulated learning, and expertise as they apply to a current problem or activity” (Turban, 2008, p. 51). The results of such process will produce something valuable. The process takes organizational data in order to produce implications that in-clude the past experience and expertise. At the end, this results in ‘organizational knowledge’ which is of very high value within organizations.
Based on the definitions, data, information and knowledge can be both input and output of information systems. A system may take raw data in order to produce information. This in-formation can afterwards be the input of another system that will generate further infor-mation or knowledge. (Boisot, 2004; Turban, 2008).
Although the difference between data and information is quite clear, it is common in IS re-search that data and information are used interchangeably. In the following sections, it is attempted that these two subjects be separate and not used interchangeably but since this form of usage is quite common in literature, it is possible that the terms be tangled around in literature review.
The mere fact that BI systems are a type of information systems that provide analytic pow-er to organizations, the author was obliged to discuss this issue as the fundamentals of in-formation systems.
2.1.2 What is Business Intelligence?
Business intelligence has evolved a lot after the introduction of dimensional modeling and OLAP analysis. Since then data warehouses has been put to use in order to get analytical
information on historical data in order to make informed decisions. Business intelligent sys-tems have evolved since then and lots of issues and new trends have come along the way in order to catch up with the advances and needs of modern organizations (Golfarelli 2004). In this thesis I want to address some of those new trends and the background behind those advances.
First, we are going to review some of the definitions of business intelligence and compare the issues these definitions refer to (Negash, 2004, p. 178):
“BI systems combine data gathering, data storage, and knowledge management with analytical tools to pre-sent complex internal and competitive information to planners and decision makers.”
As a good agreed upon definition, the author try to bring the intelligent aspect of BI sys-tems into focus and mention the advantages these syssys-tems can bring. The definition high-lights the actionable values of the BI that lets decision makers make timely decisions based on high quality input data.
In some research the expected outcome of BI are explained as below (Willen, 2002): 1. Corporate performance management
2. Optimizing customer relations, monitoring business activity, and traditional decision support
3. Packaged standalone BI applications for specific operations or strategies 4. Management reporting of business intelligence
2.1.3 A Data Framework for BI
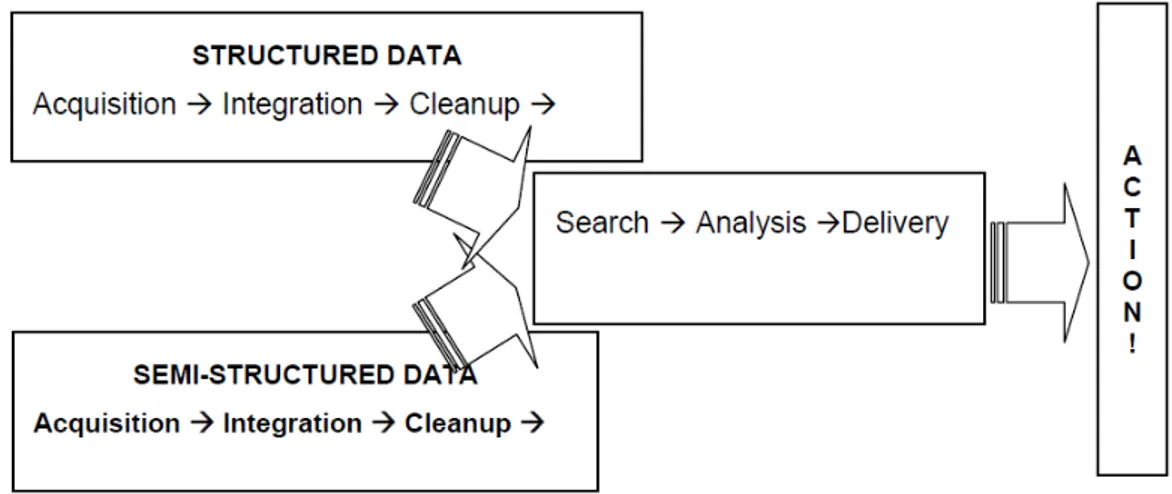
BI systems are able to take both structured and semi-structured data and turn them into valuable transformed information and knowledge that can be used to make timely decisions (Rudin & Cressy 2003; Moss 2003). The structured inputs are the ones existing in data warehouses, data mining tools, OLAP and ERP systems. The unstructured and semi-structured sources can be conversations, graphics, images, movies, news items spread-sheets, text, videos, web pages and business processes that are all popular ways of gathering and showing data.
Research and surveys show that 85% of data in organizations is semi-structured or unstruc-tured data (Blumberg & Atre, 2003) and managers insist on using these sorts of data be-cause of their value and ease of access and use within organizations.
A survey shows that 60 % of CIOs consider semi-structured data critical for improvements in the operations and new opportunities within the organizations (Blumberg & Atre 2003). In this research an executive of a telecommunication company states:
“We have between 50,000 and 100,000 conversations with our customers daily, and I don't know what was discussed. I can see only the end point – for example, they changed their calling plan. I'm blind to the content of the conversations” (Negash, 2004, p. 180).
The findings above highlight the importance of semi-structured data and how often it is used. Yet analyzing and processing semi-structured data has been a challenge for scientists and researchers. To create information out of scattered data, data is brought from enter-prise systems such as Enterenter-prise Resource Planning (ERP) systems and sent to the next stage called ETL (extract, transform, load). At this stage, data will be standardized and cleaned for analysis. Then the clean data will be transferred to a data warehouse (DW).
Dif-be done on the data stored in DW. All these steps are mostly used for structured data (Negash, 2004).
The framework developed by Negash (2004) depicts the whole picture of how both struc-tured and semi-strucstruc-tured data will be used in analysis and finally put into action:
Figure 2.1. Business Intelligence Data Framework (Negash, 2004)
2.1.3.1 Data Type/Source Matrix
As mentioned in the previous section, data types can be categorized into two main catego-ries, structured and semi-structured (Negash, 2004). Keeping this in mind, there’s another perspective that can be taken into consideration which is data source. In that regard, data can be either internal or external. Negash (2004) has introduced a matrix to compare and merge these two different perspectives in more detail. Table 1 shows this matrix.
Table 2.1. BI Data Type/Source Matrix. (Negash, 2004)
In general, internal sources are easier to deal with because they are a product of the organi-zation and the organiorgani-zation is familiar with its structure and values. ERP systems are good examples of these as they integrate data throughout the whole organization. On the other hand, with advances in web-based technologies and the popularity of Internet, external sources are becoming more and more common. The nature of external data that resides on
the Internet is mostly semi-structures and/or unstructured (Negash, 2004; Turban, 2011; Nemschoff, 2013). This category later on gives birth to one of the hottest topics today which is called Big Data. Big Data is investigated deeper in section 2.3.4.
As stated, BI’s main mission is to serve the decision makers with accurate and timely data. In any organization, decisions are made at different levels, from executives and strategic level to operational decisions related to each function in the organization. BI developers try to facilitate decision making for all different levels by developing tools for each responsible person. This trend called “BI for the masses” that serves a much broader population within the organization (McNight, 2003).
There are some challenges facing BI for the masses that Negash (2004) mentions in his re-search:
• Easy creation and consumption of reports • Secure delivery of the information
• Friendly user interface such as Internet browsers
2.1.4 Architecture of BI
A BI system has four major components (Turban, 2011):
1. A data warehouse that is the main repository for the historical data. Today almost any medium to large organizations have one or several data warehouses in their BI systems. Originally data warehouses were made to keep historical data. The users would go through data using queries in order to get what they needed for analysis. Today data warehouses support current data as well. Current data can be used for real-time or online decision support.
2. Business analytics which are a collection of tools used for doing analytical activities such as data mining in order to extract information and knowledge from historical data in the data warehouse. Tools and techniques used in business analytics can be considered in two major categories:
• Reports and queries: “Business analytics include static and dynamic reporting, all types of queries, discovery of information, multidimensional view, drill down to details and so on” (Turban, 2011, p. 10).
• Data, text and web mining: “Data mining is a process of searching for unknown relation-ships or information in large databases or data warehouses, using intelligent tools such as neu-ral computing, predictive analytics techniques, or advanced statistical methods” (Turban, 2011, p. 10). New techniques and technologies allow mining to be done on text and web as well.
3. Business performance management for monitoring and analyzing business perfor-mance. “It’s an emerging portfolio of applications and technology that contains evolving BI archi-tecture and tools in its core. BPM extends the monitoring, measuring and comparison of sale, prof-it, cost, profitability and other performance and other performance indicators by introducing the concept of management and feedback. It embraces processes such as planning and forecasting as core tents of business strategy. In contrast with the traditional DSS, EIS and BI, which support the bottom-up extraction of information from data, BPM provides a top-down enforcement of corpo-rate-wide strategy. BPM is usually combined with the balanced scorecard methodology and dash-boards” (Turban, 2011, p. 12).
4. User interface or the dashboard in which all the analytical activities can be moni-tored by users. Dashboards are the most well-known and used form of user inter-faces in BI. They provide users a visual view of the whole enterprise and the indica-tors that are measured. They tend to integrate information gathered from different
departments and businesses and give an “at-a-glance” view of the state of the cor-poration.
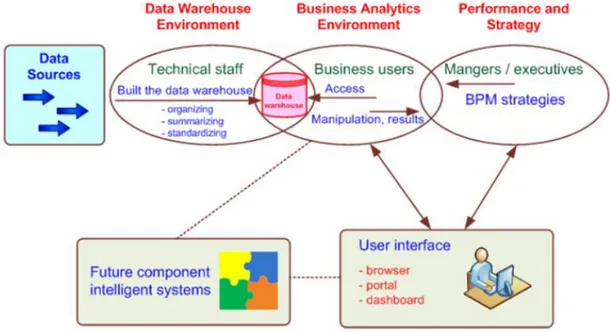
To understand the functionality of BI better, researchers have presented a model that de-picts the architecture of business intelligence as a whole.
Among them Eckerson’s model (Eckerson, 2003) is a somewhat good source to grasp the whole concept of BI. The model is presented below in figure 2.3.
Figure 2.2. A high-level architecture of BI. (Eckerson, 2003)
Figure 2.3 illustrates the connection between the four major components discussed earlier. The architecture shows us the actors involved in each component of BI. In the DW envi-ronment the technical staff is mainly in charge of organizing, summarizing and standardiz-ing the warehouse. Their activities are referred to as ETL (extract, transform, load). They get the old data from scattered databases across the organization and make it “clean” and standard for the one big integrated standardized warehouse.
The business analytics environment is where the clean data from the previous stage and warehouses are sent to be analyzed upon. At this stage users and managers agree upon a couple of metrics to assign to each business indicator. They are termed as KPI (key per-formance indicators). They tend to show how each specific indicator within a business unit is functioning. These indicators when brought into a graphical dashboard provide a health sign for the whole enterprise.
At the higher level, the management team and executives work on the BPM strategies. The inputs of the BPM are the results of analytics section which is observed by the manage-ment. Then decisions and strategies are made based on that reliable and timely information. As mentioned in the previous section, BI is supposed to deal with both structured and semi-structured data simultaneously. The decision in BI architecture is mostly business ori-ented rather than technically oriori-ented. Technical data architecture focuses on hardware, middleware and DBMS whereas BI architecture focuses on standards, metadata, business rules and policies (Negash, 2004; Moss, 2003).
Researchers have introduced BI architectures for both structured and semi-structured data. As for structured data, architecture is centered on the DW and all data from various opera-tional systems is extracted and loaded to the warehouse. The large amount of data will be distributed to different data marts used by each department or function in the organization. The analysis will be done using OLAP and/or other analytical techniques and the results will be sent to users in form of reports, charts or responses to a query (figure 3). Needless to mention, the Internet and intranets have a big role in data transferring and sharing (Negash, 2004).
Figure 2.3. BI architecture for structured data. (Negash, 2004)
As for the semi-structured data architecture, there has been very few research regarding this area although it was highly demanded from the industry. Moss (2003) implies that en-terprise architecture should be used for semi-structured data. He proposes five main mod-els i.e. business function model, business process model, business data model, application inventory and metadata repository can form an architecture for semi-structured data. (Fig-ure 2.5), (Table 2.2)
Figure 2.4. BI architecture for semi-structured data. (Moss, 2003) Table 2.2. Architecture component for semi-structured data. (Moss, 2003)
As it may be a good headstart for further research, this model is far from a comprehensive framework for semi-structured data. This area has raised a lot of attention lately and many researchers and practitioners are dealing with this topic now. This movement has given birth to a new concept which is called “big data”. Big data will be dealt with in further chapters and proposed architectures will also be reviewed.
2.1.5 History of BI
In order to have a better understanding of Business Intelligence systems and their trends, it is important to go back a few years and see where they came from and how they evolved. The following sections, the author is going to investigate the origins of Decision Support Systems (DSS) and their evolution.
2.1.5.1 Decision support system origins and theory development
It was in the 1960s that researchers began to study computerized decision making under the umbrella term of Decision Support Systems. The early finding and research topics of that era are production scheduling application by Ferguson (1969), implementing and test-ing of an interactive model-driven management decision system by Morton (1967), multi-access interactive computing presented by Licklider (1960) and many more.
In 1964 IBM pioneered in development of one of the first concepts of Management In-formation Systems (MIS) by introducing IBM System 360. “These early MIS focused on provid-ing managers with structured, periodic reports and the information was primarily from accountprovid-ing and transaction processing systems.” (Power, 2007, p. 1)
Around the 1970s various researches were done on management decision systems, strategic planning systems and decision support systems. The first use of the term decision support system was done by Gorry and Scott-Morton (Gorry, 1971) in which “they argued that Management Information Systems primarily focused on structured decisions and suggested that the supporting information systems for semi-structured and unstructured decisions should be termed Decision Support Systems”. (Power, 2007, p. 1)
In 1980, Alter concluded a study taken from previous researchers to introduce the generic operations performed by DSS in different categories. These operations range from ex-tremely date-oriented to exex-tremely model-oriented. His studies led to introduction of seven types of DSS as it follows (Power, 2007, p. 1):
“
1. File drawer systems that provide access to data items.
2. Data analysis systems that support the manipulation of data by computerized tools tailored to a specific task and setting or by more general tools and operators.
3. Analysis information systems that provide access to a series of decision-oriented data-bases and small models.
4. Accounting and financial models that calculate the consequences of possible actions. 5. Representational models that estimate the consequences of actions on the basis of
simu-lation models.
6. Optimization models that provide guidelines for action by generating an optimal solu-tion consistent with a series of constraints.
7. Suggestion models that perform the logical processing leading to a specific suggested deci-sion for a fairly structured or well-understood task.”
2.1.5.2 Model-driven DSS
This sort of DSS is one of the earlier types that were first introduced by Scott-Morton (Morton, 1971; Power, 2002). In his production planning management system. “A model-driven DSS emphasizes access to and manipulation of financial, optimization and/or simulation models. Simple quantitative models provide the most elementary level of functionality. Model-driven DSS use lim-ited data and parameters provided by decision makers to aid decision makers in analyzing a situation, but in general large data bases are not needed for model-driven DSS.” (Power, 2007, p. 1).
The introduction of model-driven DSS was followed by introduction of the first commer-cial tool called IFPS (interactive financommer-cial planning system) in the late 1970s and it was still marketed until the mid-1990s. Expert Choice is the name of another model-driven DSS for
1983. A novel feature of Expert Choice was the support of personal or group decision making.
Another well-known model-driven DSS is VisiCalc (visible calculator) that was introduced by Dan Bricklin and Bob Frankston in 1978. “VisiCalc provided managers the opportunity for hands-on computer-based analysis and decision support at a reasonably low cost. VisiCalc was the first "killer" application for personal computers and made possible development of many model-oriented, personal DSS for use by managers.” Introduction of spreadsheets and today’s modern Microsoft Excel have roots in this model-driven DSS. (Power, 2007, p.1).
2.1.5.3 Data-driven DSS
Data-driven DSS focus on the access and manipulation of time-series of data (whether in-ternal or exin-ternal and real-time). The classic version of these systems is file systems that re-trieve data by a given query. A more enhanced and advanced version that is also used in today’s BI systems are data warehouses. In Power (2007) it is discussed that “Data warehouse systems allow the manipulation of data by computerized tools tailored to a specific task and setting or by more general tools and operators provide additional functionality. Data-Driven DSS with On-line Analyti-cal Processing (OLAP) (Codd, 1993) provide the highest level of functionality and decision support that is linked to analysis of large collections of historical data” (Power, 2007, p. 1). Other examples of da-ta-driven DSS are Executive Information Systems, Analysis Information Systems and re-trieval-only DSS. The earlier versions of these systems were also called data-oriented DSS- the terminology that could be found in earlier studies such as Alter (1980) and Bonczek (1981).
Executive information systems (EIS) were inspired by the research of John Rockart (Rockart 1979). These systems were evolved from model-driven DSS and relational data-base systems. The first EIS took advantage of pre-defined screens that displayed infor-mation to end users. These screens were maintained by analysts and the target was senior executives (Power, 2007). The development of the first EIS began in 1978 which was called Management Information and Decision Support (MIDS) system. One of the features of this system was that it let senior executive define their own requirements and work with the system directly (Houdeshel, 1987).
In the beginning of the 1990s, data warehousing and OLAP concepts extended the do-mains of EIS. Nylund (1999) claims in his paper that the developments done in Business Intelligence (BI) can be traced back to Procter & Gamble’s project in 1985 that developed a DSS that made a bridge between sales information and retail scanner data by making a link between them.
Researchers like Ralph Kimball in Metaphor Computer Systems and Howard Dresner in the Gartner Group came up with applications and new functionalities of data-driven DSS and also contributed to the terminology of Business Intelligence. “The term BI is a popular-ized, umbrella term coined and promoted by Howard Dresner of the Gartner Group in 1989. It describes a set of concepts and methods to improve business decision making by using fact-based support systems. BI is sometimes used interchangeably with briefing books, report and query tools and executive information sys-tems. In general, business intelligence systems are data-driven DSS.” (Power, 2007).
2.1.5.4 Communication-driven DSS
As decision making needed more collaboration and team-work, a new generation of DSS with the focus on network and communication were presented. “In these systems, communica-tion technologies are the dominant architectural component. Tools used include groupware, video conferencing and computer-based bulletin boards” (Power, 2007, p. 1).
In the past few years, communication decision making has enjoyed a couple of technolo-gies such as bulletin boards and audio and video conferencing. Internet has helped these techniques expand and has made synchronous communication-driven DSS possible. (Pow-er, 2007).
2.1.5.5 Knowledge-driven DSS
These systems are the result of contributions of Artificial Intelligence to DSS (Henderson, 1992). These systems are a combination of human-computer expertise and are skill-oriented. They are capable of giving suggestions and analysis to managers in a specific do-main. They are able to understand problems in those domains and solve some of these (Power 2002).
The first clones of these systems root back to 1965 at Stanford University where DENDRAL expert system was developed. These systems included rule-based reasoning programs that helped physicians diagnose diseases based on the symptoms.
After that several knowledge-based systems were developed for Macintosh and IBM-DOS platforms as well as UNIX. Artificial intelligent systems and expert systems have been de-veloped to detect patterns and rules in different datasets. In recent years web-based adviso-ry systems has connected expert systems to relational databases using web-based interfaces which has expanded the application of knowledge-driven DSS (Power, 2007).
2.1.5.6 Web-based DSS
Power (1998) introduced a definition for Web-based decision support system as “a com-puterized system that delivers decision support information or decision support tools to a manager or business analyst using a "thin-client" Web browser”. With this practical defini-tion in hand, I’m going to go back a bit to mendefini-tion some facts and origins of this type of DSS.
In the middle of 1990’s by the introduction of World-wide web and HTML 2.0, a new plat-form was spotted and exploited to further extend the capabilities of computerized decision support. Researchers around the world found the opportunity to investigate the area. The research went further than just web-based DSS. Researchers were investigating Web access to data warehouses.
By 1995, the World Wide Web took considerable amount of attention from both the tech-nical world and academics. At this point, web was considered a platform for development of decision support systems (Bhargava, 2001).
By this time, web-based DSS is becoming an important issue and some institutes merely dedicated to DSS and data warehouses are starting to work and focus on the issue. The Da-ta Warehousing Institute (TDWI) is esDa-tablished, DSS journal issue on Next Generation of Decision Support and ISWorld DSS Research pages and DSS Research Resources are pub-lished (Power, 2007).
All that research made a good foundation for practitioners to get to work and realize the developed theories. In order to support information exchange and knowledge manage-ment, the intranet within the organizations were developed in 1996-97. The main primary decision support tools were ad hoc query and reporting tools, optimization and simulation models, online analytical processing (OLAP), data mining and data visualization. (Powell, 2001).
da-DBMS. “In 2000, application service providers (ASPs) began hosting the application software and tech-nical infrastructure for decision support capabilities.” (Power, 2007, p. 1)
2000 was also the year when portals as a sophisticated means of communication were in-troduced. As more accurately called enterprise knowledge portals, they combined information, knowledge management and business intelligence as an integrated environment which could be accessed by the Web (Power, 2007).
BI and Organizations
2.2.1 BI and organizational demands
IT alignment states that IT within the organizations shall formulate strategies that are aligned with the strategies that steer the organization as a whole (Chan, 2007). If you take BI as a part of IT strategy, then the whole alignment issue could also apply for BI (Turban, 2011).
Thus, BI should have roots in organizational needs and those needs are to be aligned with organization’s strategies (Golfarelli, 2004). This connection between the top management and BI architecture is of a great importance. Higher levels of management can contribute to plan a ‘robust’ architecture by providing guidelines to analytical architecture (Davenport, 2007).
As Davenport (2007) mentions, BI also is in need of a formulated architecture. Business in-telligence architecture has to be flexible and it should be possible to adapt the system to business demands and objectives that are in constant change. That’s where the whole con-cept of Business Performance Management (BPM) begins to shine. (BPM and its roots and characteristics are dealt thoroughly with in section 2.3.2)
Regarding the other trends, there are demands in organizations that are using information systems. In this thesis, expectations like improved visualization or facts like popularity of using social media such as Facebook and Twitter are also considered as a demand that or-ganizations have from their IS (in this research, it is mainly BI systems) to support those demands. In general, any opportunity residing within the organization that could be ex-ploited by BI or any expectations that a legacy BI system cannot fulfill and is expected from a new trend to fulfill can be considered as organizational demands from a BI system.
2.2.2 IS success model
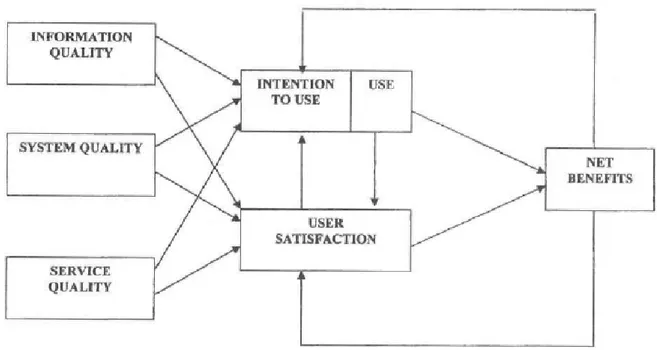
When dealing with Information Systems (IS), there are lots of papers that deal with the is-sues and barriers in planning, designing, developing and maintaining them. There is a sub-stantial amount of research regarding success factors dealing with IS. Delone (2003) deals with the perspective from which IS as a whole should be looked upon. In this research much emphasis has been put on the end users. It is logical since it is users that have to deal with the system in their daily routines and the success of on IS implementation highly de-pends upon user satisfaction.
It is perceived that quality of information is one of the main reasons that Information Sys-tems exist. The rapid delivery of data and information which is accurate and timely is one of the main goals of IS (Delone, 2003). To further explore this aspect of IS, Delone (2003) addresses that “quality has three major dimensions; information quality, systems quality and service quality. Each should be measured—or controlled for—separately, because singular-ly or jointsingular-ly, they will affect subsequent "use" and user satisfaction” (Delone, 2003, p.23).
Figure 2.2 shows Delone and McLean’s model. In this model Use and Intention to Use are addressed separately because they are of different natures. Use is a behavior whereas Inten-tion to Use is an attitude. It is of importance to consider that Use and User SatisfacInten-tion can be interpreted closely to each other. In a process point of view, Use should precede User Satisfaction, but in a cause-effect point of view, pleasant experience with Use will result in higher User Satisfaction. On a similar note, higher User Satisfaction will result in higher In-tention to Use, and thus Use (Delone, 2003).
As a result of higher degree of Use and User Satisfaction, Net Benefits will increase too which is the optimal goal of the IS. If this optimal goal (Net Benefits) is met, then incen-tives from the side owners and sponsor of the system will have an impact on the Use and User Satisfaction as a feedback, thus the loop between Use, User Satisfaction and Net Ben-efits will occur.
Figure 2.5. Delone and McLean’s IS Success Model. (Delone, 2003)
Delone has dealt with each of the blocks separately, introducing them and elaborating on their characteristics as follows: (Delone, 2003, p. 25)
System quality: “System quality is measured in terms of ease-of-use, functionality, reliability, flexibility,
data quality, portability, integration, and importance. Individual impacts were measured as quality of work environment and job performance.”
Information quality: “Information quality is measured in terms of accuracy, timeliness, completeness,
relevance, and consistency. Individual impact was measured in terms decision-making performance, job effec-tiveness, and quality of work.”
Service quality: Service quality is measured in terms of “tangibles, reliability, responsiveness,
as-surance, and empathy to measure service quality.”
Delone (2003) explains further that each of the factors mentioned above have individually a certain impact of Use and User Satisfaction and consequently on Net Benefits of the In-formation System.
BI trends
In this section the ‘main four’ BI trends discussed in section 1.3 will be dealt with. These theories will be the basis for further analytical procedures in chapter 5.
2.3.1 Data Warehouses
2.3.1.1 Where did it come from?
The history of data warehouses goes back to business needs. It was first pondered upon and introduced by an IBM branch called IBM Europe, Middle East and Africa (E/ME/A) (Devlin, 1988). IBM developed an architecture called E/ME/A Business Information Sys-tem (EBIS) that was used as a strategic information sysSys-tem. This was the first time that a data warehouse was used as an integrated entity with organization’s relational database. Devlin 1988 states that the reason behind this development was that IBM couldn’t get the desired results from existing classic database systems. One of the shortcoming of relational databases is data retrieval is not easy for novice users. The proposed architecture using a DW provides a simplified end-user access that doesn’t take an expert to function it.
Another interesting point that Devlin (1988) points out to be a reason behind DW devel-opment was that users, especially at management level. It says that managers “have become requestors of information rather than accessors of information. Managers and other users require current information, and existing information systems frequently do not respond quickly enough to business changes or users' needs. The reason for this is that a specific ac-tion must be taken by the Informaac-tion Systems (Is) organizaac-tion for each change made.” The interesting point here is the usage of the term “requestor”. In later developments of DW and BI systems consequently, this aspect will lead to introduction of reporting and OLAP.
Devlin (1988) further explains that “If the information exists but is in an unsuitable format for general querying, the Information Systems organization must devise a specific extrac-tion procedure for each occurrence” (Devlin, 1988, p.61). This can result in delays because the IS has to take care of many ad hoc requests and queries.
To sum it up, according to Devlin (1988) current information systems with relational data-bases had some deficiencies. The most important ones were:
1. Normal users (novice users) found it difficult to perform queries. In that time, a large amount of information retrieval and reporting activities were done by IT pro-fessionals.
2. Users especially at management level have become requestors of information rather than accessors of information. They require reliable timely reports.
3. The current querying techniques are time consuming and inaccurate especially when dealing with ad hoc queries.
As a result EBIS provides a solution to this problem as an architecture of an integrated sys-tem and consistent information to end users in any business function.
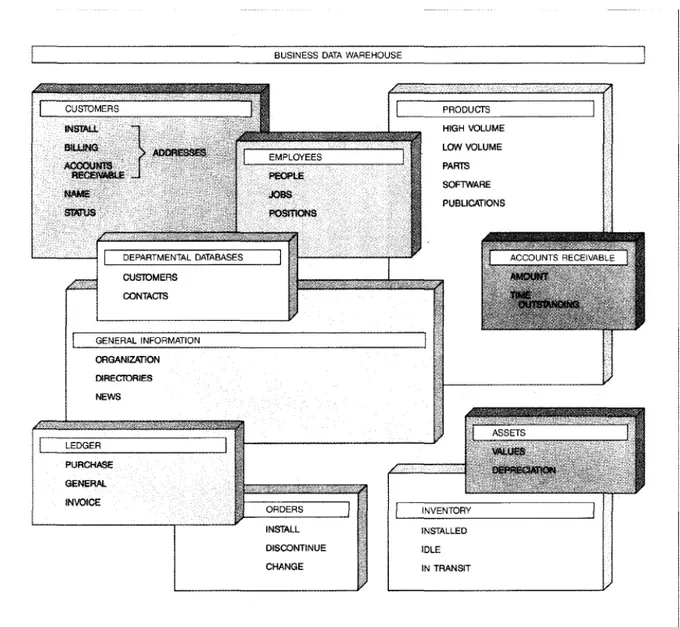
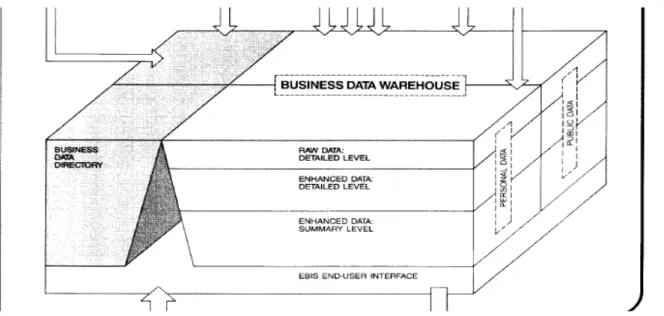
Devlin (1988) presents an example of data and table structure of the business data ware-house (figure 2.6). It mentions that all the necessary data be accumulated and accessed in one repository in a way that all processes and functions can read and write data on it and stay updated. It is visible that some dimensions e.g. products, customers, orders etc. are in-troduced.
Devlin (1988) further explains that data residing in data warehouses might be in different level of detail dependent on users’ need. It could be raw data that users send to “the
Intelli-gent Workstation” in order to use it in reports, or it could also contain enhanced data at different level. Figure 2.7 shows different level of data residing in the business data ware-house. It shows that DW includes both raw and enhanced data at detailed and summary level. “Descriptions of the data and the business rules are also stored in a Business Data Directory (BDD), which allows the user to productively use the stored business information” (Devlin, 1988, p. 65). You can also observe that both personal public data reside in the DW. All other processes and sub-systems interact with the DW and the End-User Interface shows the desired col-lection of data to users.
The paper also emphasized on the fact that each user views the desired data differently based on his/her need. Afterwards the report is constructed based on that view. Based on this perspective, the user has only views the column he/she needs, although these columns may be collected from different tables in different data sources in the company. (Devlin, 1988). Moreover, each user observes information from various tables in the company’s da-tabase combined in a way that makes the data most meaningful.
Figure 2.7. Business Data Warehouse: Different types of data (Devlin, 1988)
As a conclusion, IBM presented the use of data warehouses based on some needs and defi-ciencies that the current relational databases had. They introduced an architecture of their new integrated system named EBIS and stated that the date warehouse helps them get to the goals of the system. The emphasis was on users and how they access the data different-ly based on their needs and interpretations.
2.3.1.2 Characteristics of data warehouses
Based on literature authored by Inmon (2005), data warehouses have some basic character-istics:
• Subject oriented: Data in a DW is organized by subjects, e.g. sales, product, em-ployee, etc. This enables users not only understand how the organization is per-forming but also why. It differs from usual databases in the way that databases are more product oriented whereas subject oriented data warehouses provide a more comprehensive view of the organization.
• Integrated: Integration is related to the concept of subject orientation. It happens that data which is intended to be stored in data warehouses originates from differ-ent systems and thus, might be in differdiffer-ent formats. The data warehouse must deal with standardizing the formats in a way that data sources would be consistent. A data warehouse is considered to be completely integrated.
• Time variant: Time is a crucial characteristic in data warehouse because they store historical data. Real-time data warehouse store current status as well. Based on those historical data, patterns, trends and thus predictions are made for decision making. Time can be in different grains (level of detail) e.g. daily, weekly, monthly, etc.
• Nonvolatile: “After data are entered into a data warehouse, users cannot change or update the data. Obsolete data are discarded, and changes are recorded as new data” (Turban, 2011, p. 33).
There are some additional characteristics that more modern data warehouses are advised to possess.
• Web based: Data warehouses are designed in a way that can be accessed via Web-based applications (Turban, 2011).
• Client/server: In order to provide easy access for end-users, data warehouses use a client/server architecture (Turban, 2011).
• Real time: Newer generations of data warehouses have embedded real-time access and analytical capabilities. (Basu, 2003; Bonde, 2004).
• Metadata: Data warehouses contain metadata that contain data about data. It shows how data are organized and how to effectively use them (Turban, 2011).
2.3.1.3 Dimensional modeling
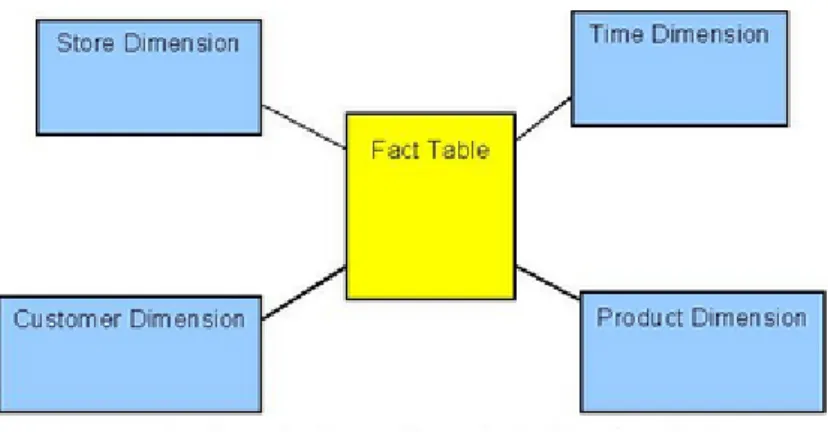
A model for development of data warehouses was introduced by Ralph Kimball. Star schema is the method of implementing data warehouses using dimensional modeling which is a retrieval based model that supports high volume query access. The architecture of star schema consists of a central fact table with various dimension tables that are connected to the fact table. Fact tables include measures with large number of rows (Adamson, 2009). A fact table contains the necessary fields and attributes in order to provide information to perform decision analysis. The facts can be described and looked upon through foreign keys that are linked to dimension tables.
Fact tables address the data that need to be analyzed in the data warehouse. These data will be used in decision making. Fact tables are surrounded by multiple dimension tables via foreign keys. Dimension tables contain data that would describe the fact table. They will give dimensions like time, place, etc. to measurements in the fact tables. This will make it possible to perform analytical operations.
In other words, dimensions give meaning and interpretability to data that reside in fact ta-bles which are mostly numeric. Some popular dimensions are time, location, size and the type of product and/or service. Using reporting tools, data in fact table can be retrieved in regards to time, location, etc. (Kimball, 2002; Turban, 2011)
Figure 2.8 shows how a typical star schema in dimensional modeling looks. The fact table in the center could be sales or any other numeric entity. Other dimensions describe the fact table’s data. For example, one can retrieve the amount of sales in year 2011 in store num-ber 2 for specific products. (Kimball, 2002).
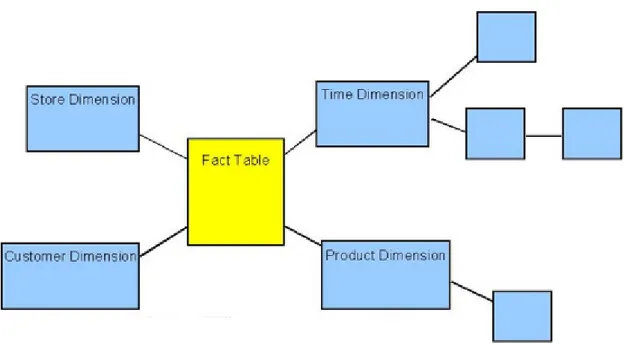
Snowflake schema is a variation of star schema. In snowflake schema one dimension tends into other dimensions with other level of details. In figure 2.9 time dimension has ex-tended into smaller portions like month, day or week. (Kimball, 2002)
Figure 2.9. Snowflake Schema. Retrieved from http://www.1keydata.com/datawarehousing/star-schema.html
2.3.1.4 Denormalization
Normalization is an act of altering the design of the tables and entities in a relational data-base in order to minimize redundancy and dependency. A datadata-base before the normaliza-tion process is a database with a few tables and each table has many columns or attributes (wide tables). The normalization process transforms the database into one with more num-ber of tables and each table has less numnum-ber of attributes (narrow tables) (Codd, 1970). Normalized databases will take less space by reducing the redundant fields. There is a drawback that query time will take more time. This is because of the increased number of tables and thus, increased join operations between the tables (Codd, 1970).
Normalized schema may cause inefficiencies in retrieval operations when a relatively small amount of data is being retrieved from a relational database. (Shin, 2006). In data ware-houses with big amount of historical data, a normalized design may not be optimal due to increased response time. Denormalization provides a mechanism that eventually will reduce the number of the tables that requires to be accessed to retrieve the answer of a query. This mechanism will reduce the number of join operations in query execution (Hoffer, 2002). The drawback with this method is that the data warehouse may contain redundant data and thus, it will take more space, but we accept the redundancy in order to increase the re-sponse time (Shin, 2006).
2.3.1.5 Data Warehouse Evolution
Data warehouses are a major part of BI systems. They contain the timely and accurate data that is the basis for analysis that leads to an informed decision. As businesses need to evolve and the amount of data has increased in organization, the demands and expectations from data warehouses has increased as well and they need to evolve accordingly.
Tradition-al data warehouses are not respond well to organizations criticTradition-al demands. Data are updat-ed on weekly basis in form of batch updates. This speupdat-ed is not enough to keep up with transactions that happen in ‘near-real-time’ (Turban, 2011).
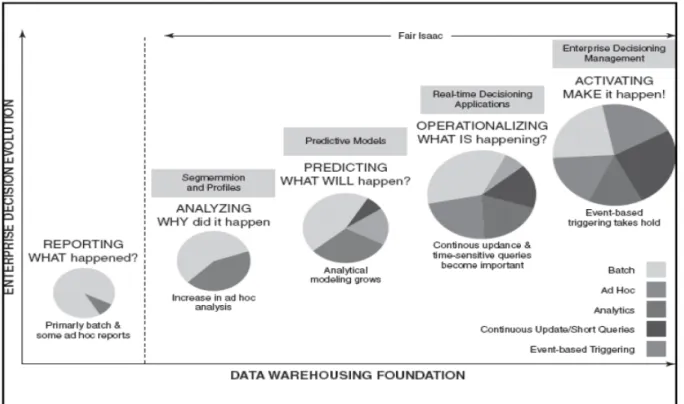
In 2003, the introduction of real-time data warehouses was a great shift in BI systems as they provide data as soon as they become available and loaded. These data warehouses are Real-time data warehouses (RDW) or Active data warehouses (ADW). DW has extended its horizons even further to a level that modern ADW can provide information directly to customers and retailers and expand throughout the whole supply chain to customer service (Turban, 2011).
The next step in evolution which is also the highest step, ADW do not only provide real-time data and make predictions based on them, but also they make events happen. For ex-ample they can make and trigger sales campaigns or identify marketing opportunities (Tur-ban, 2011; Wrembel, 2009).
Figure 2.10 shows the evolution of enterprise decision and how data warehouses can sup-port them as they evolve (Turban, 2011). The usage of data warehouses was mere resup-porting purposes in the beginning with much batch up and very few ad hoc querying. As the com-plexity of decision making increased, more services were demanded from data warehouses. Prediction was possible through analytics and data mining techniques. After that, RDW was introduced that would tell the decision makers what was going on at the moment for timely decisions. The last and the newest evolution is when event-based triggering is getting more focus and data warehouses that get continues updates and are real-time, can trigger events and make things happen (Turban, 2011).
2.3.2 Business Performance Management (BPM)
2.3.2.1 Dawn of BPM
Currently, businesses need a tool to address the rapid changes of environment and the flow of data. Therefore organizations need to include IT in their strategies and top level man-agement in order to get return on these IT investments (Golfarelli, 2004). “In order to reduce the costs and keep pace with the market, they are adopting an end-to-end strategy that involves both custom-ers and supplicustom-ers to synchronize all the business activities. At the same time, companies have undcustom-erstood the importance of enforcing achievement of the goals defined by their strategy through metrics-driven manage-ment” (Golfarelli, 2004, p. 1). Therefore there needs to be a system to measure the effec-tiveness of business processes continuously. This measurement is done through Key Per-formance Indicators (KPIs) and score cards (Kaplan, 1992; Sveiby, 1997).
The goals described above are not wholly covered by data warehouses. Data warehouses only help managers understand their business by providing bottom-up extraction of infor-mation from data, therefore lacking the top-down perspective that includes the organiza-tion strategy. To fill this gap, a new concept was introduced that was adopted as an active and concrete approach to business management. This concept is called Business Perfor-mance Management (BPM) that can be defined as “a set of processes that help organizations opti-mize business performance by encouraging process effectiveness as well as efficient use of financial, human, and material resources” (Golfarelli, 2004, p. 2). BPM goes deep into strategy of the organiza-tion and addresses the expected outcome of BI systems. It is an umbrella term that houses all different capabilities and tools necessary for BI systems. Data warehouses, OLAP tools and ETL tools are all supported and provided in BPM.
2.3.2.2 The BPM Approach
BPM is interwoven in the organization’s structure and processes. In order to deal with how BPM works, it is important to take a look at process-oriented organizations and how they function.
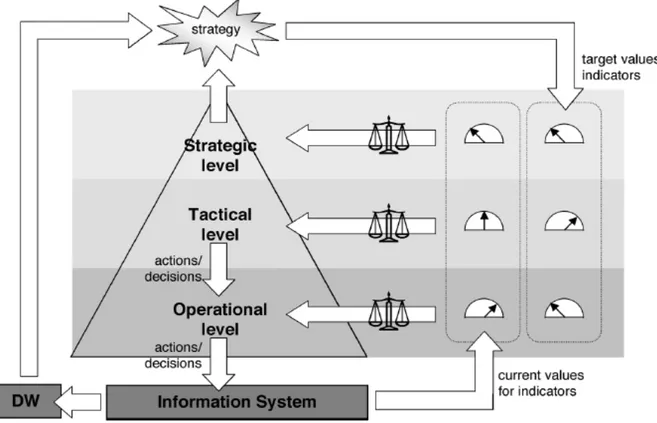
The organizational hierarchy is designed in a way that duties and responsibilities are point-ed out and distributpoint-ed throughout the organization. There are usually three different levels: “At the strategic level, the global strategy of the enterprise is decided. The tactical level is usually composed by multiple divisions, each controlling a set of functions; the decisions taken here are related to the corre-sponding functions and must comply with the strategy defined at the upper level. Finally, at the operational level, the core activities are carried out; the decision power is limited to optimizing the specific production ac-tivities in accordance with the main strategy” (Golfarelli, 2004, p. 2).
In order for organizations to perform the duties assigned to each level, processes have to be carried out. “A process identifies a set of logically related tasks performed to accomplish a defined goal. Processes are orthogonal to organizational structure, in fact they usually include tasks carried out by differ-ent divisions and require decisions at differdiffer-ent levels” (Golfarelli, 2004, p. 2). One of the advantages of processes is that they are holistic and take the whole organization into account rather than focus on a single task. They are designed in a way that are aligned with organization’s strategy and goals. These high level strategies are then translated into smaller goals and ob-jectives and each are given a target value and an indicator to monitor how on the track they are. Figure 2.11 gives an image of how all these concepts are going to work together as a whole.
Figure 2.11. BPM Approach. (Golfarelli, 2004).
Golfarelli (2004) makes some indications regarding the proposed model:
• “The strategy and the corresponding targets on indicators are influenced by the enterprise perfor-mance as inferred from the information system.
• The actions/decisions taken at the tactical and operational levels are aimed at matching current and target values for indicators.
• The actions/decisions fulfill the company strategy and determine its performance.” (Golfarelli, 2004, p. 2).
The issue here is to measure the level of alignment of IT/IS strategies with corporate strat-egies. Without a single way of determining target values, employees at different levels of the organization may fail to share the same opinion and view regarding the target values. The use of Key Performance Indicators (KPIs) can solve the problem mentioned above. They provide a value set by managers and experts based goals and objectives. All the values will be measure by these indicators and it provide managers with results without misunder-standing and personal definitions (Golfarelli, 2004).
To sum it up, BPM was introduced because of insufficiencies found in data warehouses. Enterprises came to the conclusion that they need data for decision making at all levels of the organization, from operational level to top management that defines the strategies of the organization. Thus, they needed a more holistic approach that would weigh the per-formance of the organization against the strategies, goals and objectives. That led to devel-opment of an approach that would contain and include the whole organization in providing data and thus decision making activities. Golfarelli (2004) summarized the features of BPM that were not included in classic data warehouses:
• Users: The users in BPM approach are decision makers that work in tactical and op-erational level. These users have limited access to organization’s strategy and their access is limited to ‘subset of indicators’ in their own specific area.
• Delivery time: Decision at different levels are made in different pace. Decisions in lower levels of the organizations are relatively made faster than the ones in strategic levels. Thus, the freshness of data must be set according to the demand. BPM sys-tems are not real-time per se, but they operate in right-time. It means that it is im-portant for information to be timely enough to be used in decision making process. • Information coarseness and lifetime: “information circulated in BPM systems is usually more de-tailed than in DW systems, since it concerns single events related to specific tasks. Besides, lifetime of information required by BPM is limited, since users are interested in the current performance of their tasks. Such characteristic leads to considering data streams as potential sources. The state of an automated assembling line or the performance of the stock exchange may be definitely part of the input for a BPM system. Finally, the high dynamicity of information encourages to resort to rule engines and mining techniques for identifying outliers and remarkable business situations” (Golfarelli, 2004, p. 3).
• User interface: To keep operational and tactical decision makers away from technical complications like executing OLAP sessions and running queries, BPM systems provide users with reports and dashboards with relevant indicators that are a more user-friendly way of interacting with the system.
To sum things up, based on Golfarelli (2004), it is clear that data warehouses cover merely parts of BPM requirements. According to figure 2.11, it can be concluded that data ware-house “is used by the top management to understand the enterprise and to define the global strategy, while other techniques must be used by tactical and operational decision-makers to “absorb” the strategy and make the best decisions for their tasks” (Golfarelli, 2004, p. 3).
2.3.3 BI in the Clouds
2.3.3.1 Elements of cloud BI
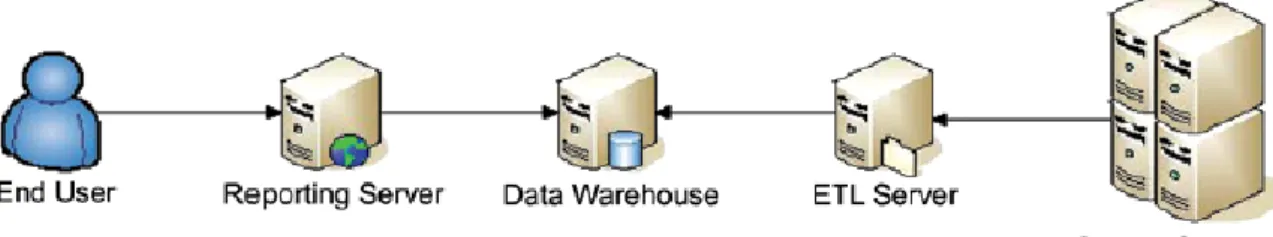
As explained in the previous sections, the data warehouse is the core of BI systems. All the data within the organization is accumulated and integrated in there and accessed by various users. The data in data warehouses are extracted, transformed and loaded from other source systems like legacy systems and other databases or data marts (Turban, 2011). On the other hand users access the data in the data warehouse via reporting tools. These re-ports can be generated in various forms and times by the users. Figure 2.12 depicts a pic-ture of how a typical business intelligence system looks like.
Figure 2.12. Business Intelligence Framework. (Gash, 2011)
The key factor with the BI is integration. It is important that data which resides in the data warehouse is integrated and everybody within the defined framework, has access to the
same timely and correct data (Baars, 2010). For many companies implementing a BI system is too much of a risk due to the integration issue mentioned above. In recent years using the cloud technology has decreased the risks by providing a platform that users can access data from anywhere. “Cloud Computing offers companies a way to avoid the significant upfront invest-ment that an internal BI framework traditionally requires” (Gash, 2011, p. 262; White, 2008). The idea of cloud BI started to get popular in 2009 when Hewlett Packard named cloud BI as one of the top 10 trends in BI. In 2010, cloud BI made it to the top 10 again. This shows how much the idea was becoming popular due to the tendency of using cloud computing in general (Hewlett Packard, 2010). As in more recent years, the popularity of clouds in business intelligence hasn’t gone anywhere. Numerous surveys and research organizations, still put BI cloud as one of the newer trends, even until now in 2013 (Tableau, 2012; EMA, 2012; Klipfolio, 2012; Tableau, 2013; Klipfolio, 2013).
Gash (2011) sketches a rough map for BI clouds as mentioned in figure 12. As shown in the picture, “ETL servers, data warehousing servers, and reporting servers and the software associated with them can all be shifted into the cloud, leaving only the source systems and the end users in the compa-ny’s domain” (Gash, 2011, p. 263).
Figure 2.13. Cloud-based business intelligence framework. (Gash, 2011)
2.3.3.2 Advantages and disadvantages of cloud BI
As discussed in the previous section, cloud computing can include some of the elements of BI. If these components are moved to cloud (figure 12), the organization is going to face some issues, but at the same time is going to benefit from its advantages. To have a short list of the advantages, Swoyer (2013) states that convenience, flexibility, ease of access, and most importantly, cost efficiency are the main advantages of cloud solution. To dig deeper in the concept of clouds and its impact on BI, we mention Gash (2011)’s perspective. To stay on a positive note, let’s first go through the advantages that Gash (2011) points out in his research:
Upfront investment costs: A lot of the cost of BI systems are hardware and software
costs that has to be purchased for BI systems to run on. As shown in figure 11 and 12 and as mentioned in previous section, some parts, both software and hardware, can be moved into cloud and thus reduce the total price. This can be done by “creating a Web service to expose a company’s source systems to the cloud provider or by simply establishing a secure virtual private network tunnel from the cloud provider into a company’s intranet” (Gash, 2011, p. 263)