1
Downtime cost and Reduction analysis:
Survey results
Master Thesis Work, Innovative Production, IDT
KPP231
Mohamad Tabikh
Commissioned by: Mälardalen University Supervisor: Dr. Antti Salonen
2
Abstract
The purpose of this paper is to present a sample of how Swedish manufacturing companies deal with equipment downtime cost, and further how they analyze its reduction. The study was performed by conducting a web-based survey within Swedish firms that have at least 200 employees. The main results obtained from the investigation show that the estimated downtime cost constitute about 23.9 % from the total manufacturing cost ratio, and 13.3 % from planned production time. Additionally, the hourly cost of downtime, whether planned or unplanned, is relatively high.
However, there is a shortage of systematic models that capable to trace the individual cost imposed by downtime events. This lack was shown apparently whilst 83 % of surveyed companies they do not have any complete model adapted for quantifying their downtime costs. Moreover, only few companies develop their cost accounting methods such as, activity-based costing (ABC) and resource consumption accounting (RCA) to assimilate and reveal the real costs that associated with planned and unplanned stoppages. Still, the general pattern of downtime cost calculation allocated to direct labor and lost capacity cost.
On the other hand, the attempts of decreasing downtime events and thus costs were based on schedule maintenance tactics that supported by overall equipment effectiveness (OEE) tool, as an indicator for affirming improvements. Nonetheless, the analysis indicates the need for optimized maintenance tactics by incorporating reliability-centered maintenance (RCM) and total productive maintenance (TPM) into companies’ maintenance systems. The maintenance role of reducing downtime impacts not highly recognized. Furthermore, the same analysis shows the requirement for better results of performance measurement systems is by implementing total equipment effectiveness performance tool (TEEP). The advantage of such tool is to provide the impact index of planned stoppages in equipment utilization factor.
Finally, the lack of fully integrated models for assessing the downtime costs and frameworks for distinguishing the difference between planned and unplanned stoppages are the main reasons behind the continuation of cost in ascending form. Due to that, the improvements will emphasize on areas with less cost saving opportunities. As a result, this will affect the production efficiency and effectiveness which in return has its influence on costs and thereby profits margin.
Keywords:
Downtime cost, planned stoppage, Maintenance optimization, Performance measurement systems, Swedish manufacturing companies3
Acknowledgement
The completion of this project could not have accomplished without the support of my
supervisor, Dr. Antti Salonen. His valuable comments and encouragement have been
much appreciated, thank you. I would also like also to extend my gratitude to Dr. Sabah
Audo, his advices during the small chats outside the university building were very
precious. Additionally, I am grateful to the companies that collaborated in this work
especially the respondents of the questionnaire.
As well, I would like to thank my family and friends for their trust. Last but not least, a
very special “Gracias” to my life partner BEA for her limitless love.
4
Table of Contents
1. Introduction ... 8
1.1 Background ... 8
1.2 Problem discussion ... 9
1.3 The objective and Research questions ... 10
1.4 Delimitations and limitations ... 11
1.5 Summary of the chapter ... 12
2. Methodology... 13
2.1 Research philosophy ... 13
2.1.1 Research philosophy of this study ... 14
2.2 Research approach ... 15
2.2.1 Research approach of this study ... 16
2.3 Research methods ... 16
2.3.1 Research method of this study ... 17
2.4 Research strategy ... 18
2.4.1 Internet based survey ... 18
2.4.2 Research strategy of this study ... 19
2.5 Data collection tool - Questionnaire ... 19
2.5.1 Questionnaire design of this study ... 20
2.6 Data Analysis ... 23
2.6.1 Data analysis of this study ... 24
2.7 Research credibility... 25
2.7.1 Reliability ... 25
2.7.2 Validity ... 25
2.7.3 Credibility of this study ... 26
2.8 Summary of the chapter ... 27
3. Theoretical framework ... 28
3.1 Cost accounting methods ... 28
3.1.1 Traditional cost accounting ... 28
3.1.2 Life Cycle Costing ... 29
3.1.3 Resource Consumption Accounting ... 31
5
3.2 Performance measurement systems ... 35
3.2.1 Overall equipment effectiveness ... 35
3.2.2 Total equipment effectiveness performance ... 37
3.3 Maintenance concept and interventions ... 38
3.3.1 Maintenance definition and perspective change ... 38
3.3.2 Maintenance strategies, policies and tactics ... 39
3.4 Downtime identification, causes and effects ... 42
3.5 Determination of cost categories ... 46
3.6 Summary of the chapter ... 49
4. Results ... 50
5. Analysis and Discussion ... 58
6. Conclusions and Suggestions ... 68
7. References ... 70
8. Appendices ... 74
6
List of Figures and Tables
Figures
Figure 1. The difference between inductive and deductive process ... 16
Figure 2. The respondents’ number and their positions ... 21
Figure 3. Respondents’ type of industry ... 22
Figure 4. The structure of forecasting model for calculating LCC ... 30
Figure 5. Traditional costing and activity- based costing ... 34
Figure 6. OEE and the perspectives of performance integrated in the tool ... 36
Figure 7. Conceptual process of maintenance impact on firms’ profits ... 39
Figure 8. The sequential steps of RCM analysis ... 42
Figure 9. The generic factors and processes that related to Downtime event ... 44
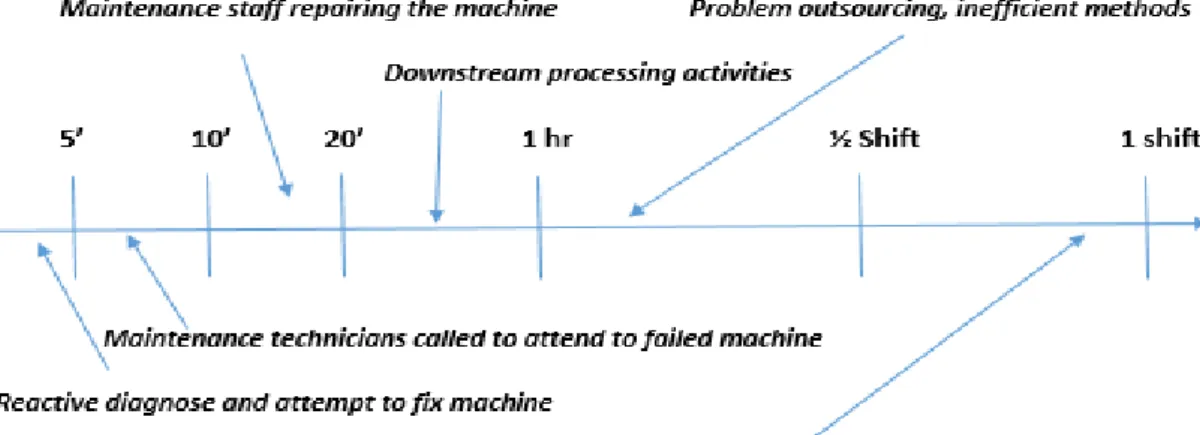
Figure 10. The effect of downtime duration on process activities ... 47
Figure 11. The cost categories that associated with downtime in manufacturing ... 48
Figure 12. The methods used by firms for assessing downtime cost ... 64
Figure 13. Differences of decreasing downtime costs through maintenance tactics ... 66
Tables
Table 1. The comparison between positivism and interpretivism ... 14Table 2. The different types of scales of data and their descriptions ... 24
7
List of Abbreviations
LCC: Life Cycle Costing
RCA: Resource Consumption Accounting
ABC: Activity Based Costing
OEE: Overall Equipment Effectiveness
TEEP: Total Equipment Effectiveness Performance
RM: Reactive Maintenance
PM: Preventive Maintenance
CBM: Condition Based Maintenance
RCM: Reliability Based Maintenance
TPM: Total Productive Maintenance
FMECA: Failure Mode, Effects, and Criticality Analysis
TQM: Total Quality Management
8
Chapter 1
1. Introduction
The opening chapter mainly displays the motivation factors behind the thesis topic and the intention of approaching such a subject. Further, the introduction context enclosed by different constituent elements namely background, problem discussion, objective, research questions, delimitations, limitations, and finally a chapter summary. The report structure consists of eight chapters, and at the end of the first three chapters brief summary will be provided. The purpose is to facilitate the process of idea flow and content coherence; especially the first three chapters addresses the theoretical background of this study. Consequently, the overall goal of this
chapter is to furnish the reader with a general understanding about the proposed topic.
1.1 Background
In today’s competitive manufacturing market, production efficiency and effectiveness are among top business priorities. Thus, production equipment becoming the central focus of interest as it is the backbone of the manufacturing process and key performance indicator of productivity. The requirements of outstanding performance force companies to substantially consider reducing their machines downtime frequency and its consequential costs [1]. Equipment downtime occurs due to planned or unplanned stops. However, the unplanned stops caused by failures and disturbances occurrence are the most common unexpected factors that have the non-trivial influence on the overall productivity. Also, this interrelation between downtime events and productivity lies in gist of economic connotation, in which cost and profit variables are inversely proportional by means of decreasing downtime cost and thereby increasing production profit [1]. To this end, in order to decrease the downtime cost, suitable and developed costing methods are needed to calculate and trace every single cost disbursed during the stoppage juncture. All activities and resources that have depleted whilst retrieving the production equipment function should be allocated based on their real costs. The primary role of costing method is to highlight areas with high-cost savings, and of which
9 managers proceed to implement improvements. For instance, one explicit trade-off is between costing methods and maintenance applications. Productive maintenance strives for minimizing downtime events and hence cost. On the other hand, proper costing method can be of much beneficial to maintenance managers through assessing the efficiency of the adopted maintenance policy. Moreover, it allows the use of series mathematical modelling and simulation as an input to optimizing maintenance strategy, in particular, the preventive maintenance strategy [2].
Thereupon, a real case study is very urgent in approaching this topic in a logical manner. According to that, Swedish manufacturing industry was chosen for this issue as it has perceived vast technological progress within production facilities. Moreover, the infrastructure of such development was based on the installation of robotic systems. Nevertheless, these sophisticated and complex systems exposed to frequent stoppages wherein are some of these stoppages has a significant impact on production outage and so lost profit [3].
The case of malfunctioning equipment and its restoration is very costly and requires many resources and budget expenses. For those mentioned reasons, Swedish manufacturing industry is considered a good option to investigate especially the issues that related to downtime cost and reduction analysis.
1.2 Problem discussion
According to Lincoln [4], the downtime costing methods that have been used by manufacturing companies they are often static in nature and inappropriate of measuring the dynamic nature of production lines. These methods lack the ability of identifying the hidden cost categories and instead emphasized on the direct cost that levied itself. Additionally, the traditional paradigms of costing downtime did not accurately traced the consequential costs of changing system behavior in accordance to random downtime events. The downtime cost bundled with other costs in an overhead bucket, where managers cannot have a clear vision about the individual cost of downtime and thus conduct practical decisions in line of improvements.
10 On the light of this, the research has been previously estimated that 80% of industrial facilities were unable to quantify the cost of downtime. Furthermore, many companies underestimating the total cost by a factor of 200-300% [5]. However, the research did not mention any remarkable work about the real cost of planned stoppages and how it contributes to downtime total cost [6].
Under those circumstances, the common attempts toward decreasing downtime events and further costs were restricted to applied maintenance, in which consider the crucial pivot in assuring the availability of production equipment. Nevertheless, the difficulty of selecting the optimal maintenance policy or by practicing the inefficient maintenance tactic, not only will fail to reduce downtime incidents but rather will lead to added-costs [7]. In return to Swedish industries, the role of maintenance is not exceedingly recognized. There is a need to invest more in productive maintenance, which is considered by the majority as a necessary expense [8].
1.3 The objective and Research questions
The overall aim of this work is to investigate on downtime costs in Swedish manufacturing companies, and how they are analyzing its reduction. Specifically, this work will discuss issues related to the subject such as, cost categories and drivers that attributable to downtime events whether planned or unplanned. The firms’ used methods for assessing the cost of downtime, and what are their holistic vision about the cost difference between planned and unplanned stoppages. Finally, the accredited maintenance applications so as to reduce the downtime events and thus costs.
Therefore, a set of research questions formed for achieving the work objective and those questions are:
1. What are the main cost categories and drivers associated with planned and unplanned stops can be identified?
11
3. What is the industry’s view of the cost difference between planned and unplanned stops in production?
4. What is the maintenance strategy that applied for reducing downtime events and thereby costs?
5. Is there any performance measurement system adopted for evaluating the improvement of production equipment?
1.4 Delimitations and limitations
The work delimitations can be divided into following points: (1) the field of selected population that required to conduct this survey was mainly chosen from the manufacturing companies with high capital investments. According to that, the equipment downtime has a significant impact on cost and productivity. (2) IT companies and service providers were excluded from this work. (3) The improvement procedures of decreasing downtime cost were only associated with maintenance practices, regardless other methods that could be efficient and applicable. On the other side, the limitations were classified as uncontrolled factors whilst performing this study. The first factor was the time constraint; this work built on a survey study and required more time to assimilate much responses and analysis. The second factor was the scarce resources and literature of costing downtime in manufacturing environment, especially the works that correlated to planned stoppage costs.
12
1.5 Summary of the chapter
Background
•The need of reducing equipment downtime and its associated costs
• The advantage of adopting an integrated costing method that enables to trace the
downtime cost
• The motivation factors behind selecting Swedish manufacturing companies for this
study
Problem discussion
•Traditional costing methods are static in nature
• The challenge of identifying the downtime hidden costs
• Companies underestimate downtime costs by a factor of 200-300% • The lack of research on planned stoppage related cost
• The role of maintenance in decreasing downtime not highly recognized
Objective
• The overall aim of this work is to investigate on downtime costs in Swedish
manufacturing companies, and how they are analyzing its reduction
Delimitations and limitations
•Only manufacturing companies are under study in this work •Time constraint
13
Chapter 2
2. Methodology
In this chapter, a description of how study was conducted is presented. Moreover, a comprehensive discussion about adopted research method and its strategy is also provided.
2.1 Research philosophy
The philosophical attitude of qualifying any research work mainly based on arguing the methodology that have been adopted for a particular investigation. The decision of selecting one method rather than another will be assessed individually by researcher’s vision, ontologically and epistemologically, that often related to the research questions in hand [9]. The research paradigms referred to conservative philosophical schools, which known as positivism and interpretivism. Both schools have their impacts of constituting the significant evolve of controversial science [10].
Positivism is considered the co-founder of epistemological movement, especially in
connection to social science. The pioneers of this philosophy introduced the argumentative that social world exists externally to researcher, and can be measured directly through observation. This statement implicit properties of which researcher must be restricted. Subjectivity, not any more accepted. Instead, objectivity is the new trend that enables scientific research on a logical basis. In addition, the independence of analysis is neither affected nor affects by the subject of the research [10].
The achievement of state-of-art research in accordance to positivism require clear mechanism and structured method. This methodology facilitates the process of collecting observations and further quantifying them statistically [10]. In contrast, interpretivism approached the interrelation between people and their environment. The debate core here contradicts the essence of positivism custom, see table 1. Interpretivism beliefs are based on merging axiomatically both entities, the researcher and social world in one mold. The researcher and
14 his/her social world cannot be separated. For this reason, the criteria of embracing interpretivism values in research work demanding the methods to emphasize on people. For example, the data collection procedure, usually, preferable with qualitative over quantitative data. In this context, the investigator should make interviews to figure-out people behavior in a particular phenomenon [11].
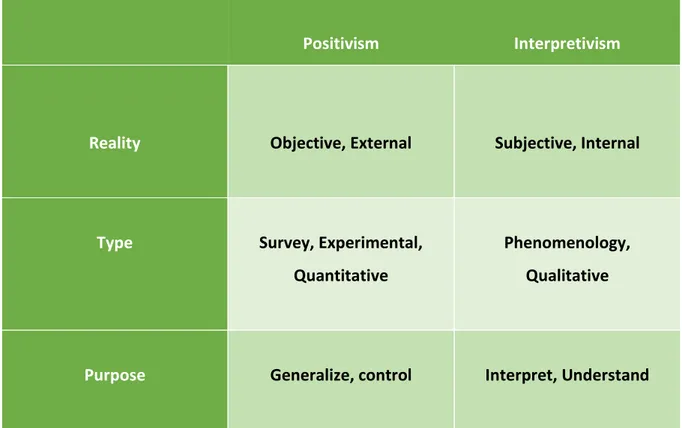
Table 1. The comparison between positivism and interpretivism
Positivism Interpretivism
Reality Objective, External Subjective, Internal
Type Survey, Experimental, Quantitative
Phenomenology, Qualitative
Purpose Generalize, control Interpret, Understand
Source: Merriam [12]
2.1.1 Research philosophy of this study
The philosophical discourse on the subject of this study has been taken to a large extent the positivism manner, as a base for approaching downtime costing issues in Swedish manufacturing companies. Moreover, this study claims the objectivity through investigating topic problem, i.e., information, data, and all types of obtained results were presented as given without any biased subjective influence. According to positivism, any problem must be into considerations of numerical assessment and can be realized throughout customized
15 measurement tool. Therefore, this study utilized web-based survey as a tool for collecting data and further creating a database for content analysis. The enumerated analytic techniques such as, descriptive statistic was adopted to discern the central tendency of population. Furthermore, this type of analysis enables to generalize results and spotlights interrelated factors.
Nevertheless, the distinction between positivism and interpretivism and in relation to best research philosophy is quite difficult. They have interchangeable characteristics in which any separate selection may lead to impairment of research quality. In my opinion, they are somehow linked in one way or another but at different levels and their causality based on the nature of matter that under study. Consequently, this relative relationship between those two concepts will be pointed-out during the display of upcoming chapters, for instance while firms calculate their downtime costs. They exclude the cost of planned stoppages as routine that entrenched to mindset and organizational cultural aspects.
2.2 Research approach
One of the essential crucial elements in research is to specify which method is being applied. There are two well-known approaches dedicated to research namely, inductive and deductive. In the inductive approach, the researcher strives for collecting the data that considered relevant to the topic of interest. Then, the next step starts with analyzing these data in purpose of finding patterns, and afterward developing a theory that could interpret such patterns. Hence, if research trending towards the inductive paradigm the driven factors might be attached to set of observations, and indeed must transit from particular experiences to more general set of propositions about those experiences [13].
In a paradox with inductive concepts, deductive approach enforces researcher to start with existing theories and then attempting to tests its inferences with data, see figure 1. In general meaning, deductive characteristics constrained the work procedure to be into scientific investigation category as labelled by positivism. The investigator must review what others have done in the field, and that in ease of drawing hypotheses that emerges from studied materials [14].
16
Figure 1. The difference between inductive and deductive process
Source: Blackstone [14]
2.2.1 Research approach of this study
The scientific approach of this study is deductive in nature, and that because the project idea created after wide review of existing theories. Those reviews are the literatures that associated with downtime cost in production systems. For instance, the proposed methods and models to quantify the downtime cost, the difference between planned and unplanned stops, identification of cost drivers, and the maintenance strategies to increase reliability and thereby minimize downtime cost. The study primarily included articles published in prestigious scientific journals, conference proceedings, books, theses and any other relevant reports that may considered important and fulfill the level of scientific research standards. Afterthought, the step was to formulate research inquiries - in the form of research questions - from what have been reviewed and then begins with collecting and analyzing the obtained data in order to answer the research questions. Finally, the compiled results and conclusions will either confirm or reject the proposed research hypothesis.
2.3 Research methods
The best-chosen method for gathering data have been disputed between qualitative and quantitative audiences. In general principle, any selected method either quantitative or
Inductive
Gather Data
Look for Patterns
Develop Theory
Deductive
Theorize/Hypothesize
Analyze Data
17 qualitative based will be considered appropriate as long as it guides the anticipated research. Hence, the nature of given research determines the method that needed to accomplish better results [15].
Qualitative method explores attitudes, behavior and personal vision through interviews or
focus groups. It attempts to obtain opinions from specified participants in which few people take part in the research. In a paradox, quantitative method generates statistics through use of survey accompanied by the assistance of questionnaires. This type of methods reaches many participants, and the contact is much quicker than it is in qualitative [15].
The main differences between qualitative and quantitative research methods explained into following points:
Quantitative data collection is more close-ended in comparison with qualitative data collection that based on more open-ended
Quantitative data analysis used the statistical theories as background; Qualitative data analysis count on text or image analysis.
Quantitative reporting has a set structure, as it grounded on mathematical elaboration; Qualitative data reporting is more flexible and may contain additional conscientiousness [16].
2.3.1 Research method of this study
The study of downtime cost analysis in Swedish manufacturing companies required large size of active participants in order to achieve good results. Therefore, a quantitative method based on survey was adopted and considered effective over qualitative because the target is to assimilate many responses in limited duration. Moreover, the acquired data might be easier to standardize in numeric form for later comparison than data obtained through qualitative methods.
The choice was not easy though, because topic like downtime cost evaluation it might contain more investigations about human and machine interactions. In other meaning, the qualitative analysis could magnify the problem from different angles. However, the proposed survey was
18 included semi-structured questionnaires in which allows participants to present their opinions to some extent.
2.4 Research strategy
Research strategy defined as the way that relied on logic and set of procedures with the aim of answering research questions in particular. There are many listed strategies used by research work such as, survey, experiment, case study, grounded theory and so on [17]. In spite of the variety of available strategies, this work feasibly implement the survey strategy as a tool for answering research questions. Thus, the following parts introduces only elements that shaped such strategy and omitted others for its unsuitability to this study.
2.4.1 Internet-based survey
Survey defined as a measurement process through asking questions, and that in the aim of collecting information from selected group of interest to be representative of a larger population. In fact, this procedure known as a sample survey and its importance allows to generalize results even though not the whole population being tested. There are two types of surveys, questionnaire and interview. The questionnaires mainly handed-out through different ways, electronically, by asking online questions and by sending private emails or throughout physical distribution by post. On the other hand, the interview associated with face-to-face meetings or via phone [18].
According to Cohen et al. [19], internet-based survey is becoming commonplace in many branches of science because of its accessibility of features over other methods. Some of those features can be summarized as following listed points:
Automated data entry Lower costs
Wider distribution
19 2.4.2 Research strategy of this study
The success of this work required an accurate sample from large existing population. Although, the time and expenditure factors also a paramount concern whilst planning any survey. For this reason, internet-based survey was considered a right choice to get fast responses with high rate participants, in addition to the advantages that arise for both surveyor and contributor by flexible data entry. This method has its positive impacts on the planned budget as well, since there is no much work done manually and no paper work included through distributing questionnaires. In the light of this benefits, the environmental facets have been likewise influenced in a safe manner.
2.5 Data collection tool - Questionnaire
One of the techniques that commonly used in collecting data is well-defined. This technique namely, questionnaire, it composed of customized and set of standardized questions in which aim for gaining new knowledge from a given subject. There are different types of questions incurred questionnaire layout such as closed-ended, open-ended and combination of both questionnaires. Closed-ended questionnaires, usually, more suitable for quantitative research than other types because it’s easier to generate statistics and perform analysis. Open-ended questionnaires have better consistency with qualitative research than quantitative, but still researcher could quantify the answers during the analysis stage. As well as, this questionnaire offers respondents the freedom to express their opinion without any restriction [15].
Additionally, the mixed-questionnaires have been more applied recently whereas many researchers tend to use such approach of closed and open questions at the same template. Furthermore, this questionnaires might enclose a series of closed questions, with boxes to tick or scales to rank and even an open questions for getting more detailed responses at the same time [15].
The planning and design stage of the questionnaire required a set of sequenced steps in order to perform a convincible scientific questionnaire as stated by Cohen et al. [19]. Firstly, the researcher needs to start with deciding the objectives of the questionnaire and then specifies the population in which the sample will extract from. Next, the investigator must generate concepts to be addressed and data required for meeting purposes of the study. After that, the
20 decision of varieties of measurements and questions should be evaluated in order to confirm if its test the research questions/ hypothesis. Then, the subsequent steps start with writing questionnaire items and piloting questionnaire, to end with the final version of reliable and valid questionnaire.
2.5.1 Questionnaire design of this study
The plan and design process of questionnaire that dedicated to this study passed through three stages: the objective of the questionnaire; population and participants; and finally the procedure
1. The objectives of questionnaire
The aim of the questionnaire that centered this study is to collect information and data about how Swedish manufacturing companies evaluate their downtime costs and its reduction. Then, the subsequent stage is to analyze obtained results and recommend improvements of conditions pertaining to matter at hand. In like manner, the questionnaire should meet the research objective directly and neglect all questions that do not support the overall target. The research questions should be answered by questionnaire, and that in order to generalize results from specified population and by this means affirming the reliability and validity of the tool.
2. Population and Participants
Once the questionnaire objectives identified clearly, then the next important step was by specifying the population and participants that needed for conducting the empirical study. The decision was to find manufacturing companies that have intensive production lines in which downtime events has a significant impact on their productivity level and costs. Furthermore, the participants must be appropriate for answering the questionnaire and have a broad cognizance about the subject related issues. Therefore, a list of 647 email addresses of financial, production, technical, and maintenance managers have been acquired from the official database company. The company known as “parguide-Bisnode” and has a database that including detailed information about all active companies, worksites, and organizations in Sweden. Those addresses present 647 firms wherein they have at least 200 employees.
21 The survey starts by sending-out email for every member of the selected population, for instance, 647 emails have been sent-out. Each email was included the research topic, purpose, and a link to questionnaire website in addition to expected time needed to answer the questions, i.e., around 10 minutes. However, 189 email addresses were removed for various reasons such as invalid addresses or the probable participants are not in their positions anymore. Thus, the total population of this study was restricted to 458 employees from different manufacturing industries, and the number of respondents was 75, which represents the overall response rate by 16.3 %.
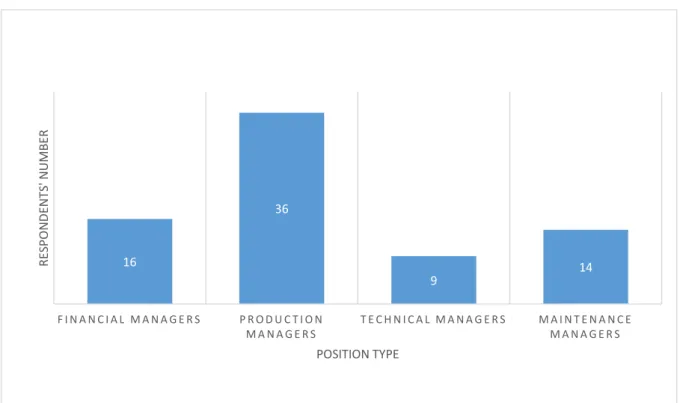
The respondents were 21.3 % financial managers, 48 % production managers, 12 % technical managers, and 18.7 % maintenance managers, see figure 2. Moreover, the respondents were distributed among the following industries: 58 % of the respondents were in mechanical engineering, 13 % electrical engineering, 12 % metal and steel, 9 % construction and concrete, 4 % pulp and paper, and 4 % other types of industries, see figure 3.
Figure 2. The respondents’ number and their positions
16 36 9 14 F I N A N C I A L M A N A G E R S P R O D U C T I O N M A N A G E R S T E C H N I C A L M A N A G E R S M A I N T E N A N C E M A N A G E R S R ES PO N DE N TS ' N UM BE R POSITION TYPE
22
Figure 3. Respondents’ type of industry
3. Procedure
The questionnaire used in this study consist of three main parts: general, downtime cost analysis part and supplementary questions. The number of main questions was 13 additionally to sub-questions. The questionnaire designed according to the standard of constructing relevant, short and understandable questions. At the same consistency, the structured questions were allowing respondents to pick an answer from a set of listed possibilities. As well as, open-ended option was necessary to be adopted in sake of enabling respondents to elucidate their answers as intended.
The questionnaire passed through different stages of procedures such as drafting, pre-testing, finalizing and production. The first stage includes the drafting process of objective questions in which attempts to cover all the pertinent aspects of chosen subject. Hence, the questions content and wording have been checked by academic expert to assure that questions contained the educational, technical, organizational and financial aspects. Furthermore, the first draft was written in English and then translated to Swedish. This procedure happened because the targeted group for survey were located in Sweden, and for more responses and better results the decision has been made based on this matter. However, the altered version,
9
7 10
43
3 3
Metal and Steel Construction and Concrete
Electrical Engineering
Mechanical Engineering
Pulp and Paper Others
R ES PO N D EN TS ' N UM BE R INDUSTRY TYPE
23
see appendix A, has also been corrected by academic expert to guarantee the content
understandability.
The next stage was to pre-tests the constructed questions if they are easy to understand and can be answered directly, thereof the questionnaire was introduced to different industrial practitioners and the results were encouraging. After that, the final stage was by finalizing and producing the questionnaires, one questionnaire was sent to each participant by email and so forth. This process occurred on the first level of distributing questionnaires and then after a while the first and second reminder using emails correspondingly performed.
2.6 Data Analysis
Quantitative data analysis is a vigorous research form, originating from the positivism source. It is often linked to large-scale studies such as, surveys. It can also employ in smaller scale studies, i.e., action research, case studies, experiments, and correlational research. Statistical formulas ground the numerical analysis, and usually, the analysis processed through software tools. These tools simplify the complex computations. However, the scales of data must be clearly identified before the data analysis launched, see table 2 [19].
There are two main well-known techniques in analyzing the data’s, descriptive and inferential statistical methods. The descriptive statistics are denoted by mode, mean, median, range, variance, standard deviation, standard error, skewness, kurtosis, etc. On the other hand, inferential statistics consists of Hypothesis testing, correlations, factor analysis, regression, etc. With this classification in mind, a systematic process of selecting the technique whilst conducting data analysis considered a critical step for better results and thereby drawing rational conclusions [19].
24
Table 2. The different types of scales of data and their descriptions
Source: Cohen et al. [19]
2.6.1 Data analysis of this study
After the data had collected, the main results and findings obtained through processing these data by descriptive statistical techniques. During the analysis phase, each question was analyzed separately and treated as mutually exclusive variable. The arithmetic averages and standards deviation in addition to other elements within descriptive statistics were mainly considered in the analysis of central tendency. In a precise, arithmetic average were treated as weighted average score on Likert-scale and ranged from 1 to 5. The equation used for arithmetic average denoted as: µ =
And standard deviation equal to
SCALES OF DATA DESCRIPTION
NOMINAL Denotes categories
ORDINAL Classify and introduces an order into the data
INTERVAL Introduces a metric
25
These symbols express as: n/N = number of participants, Xi = number of participants given score out of
five on Likert-scale [21].
2.7 Research credibility
The aim of any research is to be trustworthiness or in scientific term, credible. The research credibility can be classified into two parts: reliability and validity
2.7.1 Reliability
Reliability is the extent to which achieved results are consistent over time and can reproduce under a similar methodology; thus, the approach is considered reliable. The vitality of this definition instigating researchers to create stable measurements in which can sustain same results when the procedures are repeated [22].
Even though, still there is an alive argument about research reliability especially in a survey studies. The test-retest questionnaire may sensitize the respondents to the subject matter, and therefore affect the responses given. So, the state of an attitudes change may lead to differences in answers provided in which have been identified by surveyor as extraneous variables [22].
2.7.2 Validity
Validity determines whether the research measures what was intended to measure. In other words, does the study tool was collected the appropriate data that needed for answering the research questions [23]. Moreover, the validity in quantitative research was described as “construct validity”, the cornerstone of validation. The construct is the initial question, concept or hypothesis that regulates which data is to be gathered and in which way [22]. There are different types of validity:
I. Internal validity: it shows how dependent and independent variables logically
connected
II. External validity: this kind linked to which the results can be generalized, and the
26
III. Statistical validity: is a mathematical measure used and considered relevant enough to
evaluate the cause and effect between variables.
IV. Construct validity: this type of validity associated with the optimum selection of
theories that considered applicable in line of the research subject. It legitimates the relationship between studied variables, for instance, if the theories that used cover all aspects of the study [23].
Insofar of these definitions and taxonomies, the general term of reliability and validity divided into two strands: firstly, the reliability frame constrained by whether the obtained result is replicable. Secondly, in return to validity, one can say the content is valid as long as the means of measurement are correct and if they are actually assessing what they are anticipated to measure [23].
2.7.3 Credibility of this study
This report claims that it has followed the scientific foundations in every stage of investigating the downtime cost analysis in Swedish manufacturing companies. Accordingly, the methods used; data collection tool; analysis; presented results as well as theories that attributed to its content was based on purely scientific approach.
Thereof, we can declare the reliability and validity of this work through list of following points:
The work consists of pre-existing theories, methods and procedures as cited in many scientific references such as books, conferences, and journals. Therefore, if any new investigator conducts same study mostly will attains similar results.
The questionnaire used in this study was designed with structured questions for instance, mixed questions (open and close) in which the responded has the freedom to introduce his/her opinions as intended. This structure improves the construct validity and reliability of the instrument.
The questionnaire was based on appropriate theories and literature and was pre-tested by academic expert and manufacturing practitioners in order to ensure that all concepts are clear and relevant.
27 A check of every question to assure the adequacy of measuring all needed aspects and subject areas within the proposed study. This procedure will increase the reliability of the questionnaire and so forth construct validity.
2.8 Summary of the chapter
Research Philisophy
• The Positivism vision
Research Approach
• The deductive approach , proceeding from theories to investigation - research questions
or hypothesis
Research Method
• The adopted method based on quantitative paradigm due to the nature of this study
Research Strategy
• The research strategy is internet based survey , because it attempts to reach large
population
Data Collection
Tool
• Well-defined Questionnaire and additional information extracted from formal databases
and includes books, articles and conferences
Data Analysis
• Descriptive statistics , studing the central tendency by arithmetic average and standard
deviation
Research Credibility
• The construct reliability associated with pre-existing procedures and methods
• validity confirmed throughout gradual assessment done by academic expert and
28
Chapter 3
3. Theoretical framework
This chapter will present the concepts and theories that have been deployed in questionnaire. Furthermore, a holistic literature review incurred into this section in purpose of enriching the knowledge about the mentioned field.
3.1 Cost accounting methods
3.1.1 Traditional cost accounting
There are many cost accounting methods exist in manufacturing industries. The evolution of those costing methods is not entirely compatible with the development that intervene production systems. The introduction of lean manufacturing strategies obliges companies to launch a new costing structure, in which can fulfill the requirements of agile production lines. This technological advancement, beside the cultivated automation, made Swedish manufacturing companies aware of the importance of developing their costing methods, as it was monitored at ascending level. Further to that, and in return to the traditional costing accounting methods, Swedish firms were stemmed its accounting method originally from a model that firstly presented by Frenckner and Samuelson, [24].
The model viewpoint was meant to ascribe the manufacturing costs by the absorption factor of the unit produced. In other words, absorption costing or full absorption method is considered a way for distributing all costs generated to every finished product. Moreover, the mentioned model determined a set of cost items whilst analysis takes place. Those items can be distributed into direct labor, direct material, indirect material, administration, sales, and manufacturing overhead costs. The presented model was in the era of mass production. Therefore, the manufacturing overhead costs as maintenance, energy, design department, etc. was apportioned according to direct labor, direct material, labor hours, and machine hours [25].
29 3.1.2 Life cycle costing (LCC)
LCC is a method that pursues to optimize the cost of physical assets over their valuable lives, through identifying and quantifying all the incorporated costs tangled in that life, and that by using the present value technique. The general procedure for LCC analysis defined in first position the cost elements of interest, or all the cash flows that happened during the lifespan of the asset. The process of LCC of an asset, usually, includes all the expenditures that attached to it, and in particular the conversion stage from acquisition until disposal at the end of functioning life. The second step of the procedure is to delineate the cost structure, the structure mainly consists of those costs that can be grouped together so as to identify the potential trade-offs and thereby achieving optimum LCC. Moreover, the cost collections divided into three modules of engineering and development; production and implementation; and operation. Similarly, other cost categories distributed into utilization, ownership and administration. Even more, there is proposed cost categorization as engineering, distribution, manufacturing, service costs, sales costs and renovation [26].
Despite such diversion of defining cost structures, the aim in the end is the detailed costs of each component will depend upon an individual item under consideration. The vital point is that the structure must be designed in a way allows analyst to perform indispensable LCC analysis, and trade-offs to adequate the project objectives. The third step of the LCC general approach is to estimate the cost relationship, and that expressed mathematically in which describes the cost of the item as a function of one or more independent variables. Finally, the last stage of LCC procedure is by establishing the method of LCC formulation by finding a proper methodology to appraise asset’s LCC [26]. Hence, a systematic methodology was provided by given eight steps as following:
1. Operating profile that labels the periodic cycle of equipment or the proportion of time the equipment will be operating, mainly covers the modes of startup, operating and closure.
2. Utilization factors specify in what way equipment will be running within each mode of the mentioned operating profile.
30 4. Determine the critical cost parameters, for instance, the factors that control the degree of the costs earned during the life of equipment. Such factors as energy usage rate, period of repairs, time between overhauls, time between failures and time period for scheduled maintenance.
5. All costs are first deliberated at current rates.
6. Escalate the current calculated costs at assumed inflation rates
7. Discount costs to the base period; the money has a time value and the cash flows arising in different period should be discounted back to the base period to certify comparability.
8. Sum discounted cash flow to establish the net present value; this will enable the LCC of the asset to be established [26].
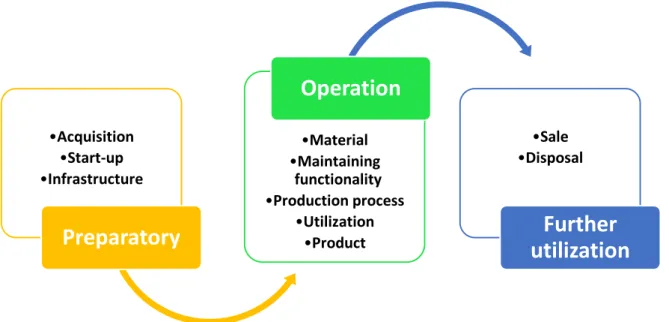
The structured model that delivered by VDMA and SEMI [27] for calculating LCC of an asset during a period of consideration is a comprehensive list of items that affects the cost of the machine along its lifespan. The many cost items were gathered into three phases and each phase including different cost pools and parameters as shown in figure 4.
Figure 4. The structure of forecasting model for calculating LCC
Source: VDMA and SEMI [27] •Acquisition •Start-up •Infrastructure
Preparatory
•Material •Maintaining functionality •Production process •Utilization •ProductOperation
•Sale •DisposalFurther
utilization
31 3.1.3 Resource consumption accounting (RCA)
RCA defined as an emerging management accounting method that composites the benefits of managerial accounting’s highlighting on resources with those of the activities and processes vision. Furthermore, RCA takes advantages of an enterprise resource planning system’s ability to track, sustain, and cluster the most detailed information and to successfully assimilate the operational and financial information. The main principles of RCA are the enable factors that determine the costs attributable to certain resource pools. Though, the construct mechanisms of RCA models preconditioned from managers to have a full understanding about all resource interrelationships. The resource pool conception focuses on assemblage the different costs of homogenous resources in a specific area of restraint. This mechanism known as the cost center in which contained one or more resource pools for instance, the resource pool may be a particular machine and the operator that connected directly to it [28].
White [29] claims that RCA main concepts can be seen as resource flows and pools, in which the resource flows from resource pools to products. The resource pool in this context is carrying a cost in addition to specific inputs needed to produce an output, and might this output support another cost pool rather than becoming product or service. Thus, the flows should be modeled properly because one of the important objectives of RCA is to provide causality information so the decision-makers can make the right judgments. Here, the cause and effect principle ensure the relationship between resource pools can hold both fixed and proportional costs. However, this relied on the nature of the costs that can be altered between resource pools [28].
The example of such disparities can be electricity, i.e., the electricity arrived at the company as a proportional cost but in some resource pools it becomes a fixed cost. As the cost that devoted to heating and lightened the manufacturing facility. Furthermore, RCA-cost allocation method deals only with the resources costs that have been used to products, and neglecting the imposed costs that related to non-added value. Another issue is the unused and idle capacity costs; RCA approach attributes those costs to people or department in charge and that in purpose of not affecting the product cost. The causality between resources and resource drivers are very essential to determine. Otherwise, the costs accuracy would not be
32 allocated appropriately to products. However, if the costs in one cost pool did not impact the other cost pool or product then no needed to be included in the cost model [30].
When RCA cost sheet conducted for analysis target, there are several features to be illustrated:
I. Primary and secondary costs
II. cost driver type if it is resource or process III. Origin of the cost (provider)
IV. Fixed and proportional quantities and costs
Primary costs are the costs that originate in a particular resource pool such as direct labor. On the other hand, secondary costs initiate in support of manufacturing resource pools that are related to the consuming object. The secondary costs can be maintenance, utilities, space, etc. Afterward, the type of cost driver consumed is based on the nature of its output. For instance, the cost driver for secondary cost of space is a resource type because the output is measured as square feet. However, the cost driver for the secondary cost of human resources is a process type because the output of this resource is an activity. The provider of the input is where the cost constructed, this could be the production department or any other support department. An example of that is the plant maintenance as secondary costs, the driver type is a resource because the output is maintenance labor hours. Therefore, in this case the provider is plant engineering and maintenance [30].
The last step is to derive the fixed and proportional cost; RCA is based on quantity structure in which means that all consumption interactions are specified on the basis of quantities. Nevertheless, the monetary value follows these quantities regardless the cost that involved in defining the consumption relationship [28]. The way used to define how total fixed and proportional cost constituted from a consuming object are determined under RCA as following:
PR- the proportional budget rate for a resource provided by the support department FR- the fixed budget rate for a resource provided by the support department
33
FQC- the fixed quantity of a resource used by the receiving sample object
The formulation for determining proportional and fixed costs are expressed into two equations:
Proportional cost assigned =
PQC*PR
Fixed cost assigned =
(FQC*FR) + (FQC*PR) + (PQC*FR) [28]
3.1.4 Activity-based costing (ABC)
ABC is a cost allocation method mainly pioneered in the area of management accounting. This method has been successfully conducted in manufacturing plants for improving the strategic vision of decisions-making, in addition to enhancing the business cost control and customer profitability. One of ABC role is to supplies management with appropriate information to comprehend the use of scarce resources in various business activities. It helps management to notice areas of the high cost, identify the elements that stimulus these costs, and develops performance. Furthermore, it allows to measure improvements in the time and cost of the activities performed. This drive forward to better management of resources concerning product costing and customer profitability. In the ABC tactic, resources are traced to activities, and activity are then traced to the targeted object such as products or services based on their intake of the activities [31].
ABC model uses different structural blocks in comparison with traditional costing, see figure 5. The traditional costing approach was presented product as a cost object that consumes resources directly. On the contrary, the propose ABC model are adopted the cost objects as a consumer of activities that in turn consume resources. Resources and activities are disbursed in a certain amount, and the rates of consumption are regarded as resource drivers and activity drivers. Resource drivers describe the rate of consumption of each resource when an activity is completed. Activity drivers underlined the rate of consumption of each activity as cost objects are generated. The idea here is that the activity driver defined on per- job basis for every cost object created, and there is a specific degree of activity consumed [4].
34 For example, the cost driver for the delivery activity is limited by the number of loads. The specialist computes the total number of shipments in a given time duration and traces the delivery activity costs to all the products based on the number of shipments consumed by each product. ABC method trace the true cost of a product either correlated to direct or indirect overhead costs, and then it identifies any non-value added activities. This characteristic is considered a significant advantage, because it illustrates expenses that may be vagueness to an organization [31].
Figure 5. Traditional costing and activity- based costing
Source: Lincoln [4]
ABC designed in aiming to provide an accurate cost data and information about the root of the cost, which means ABC make overhead traceable. In many cases, ABC has been used in combination with other process improvement tools to assert progresses initiatives and to track cost improvement. The managers that were familiar with ABC applications they had better condition monitoring of management than non-adopting method. Costs were minimized through the removal of non-value activities, or due to processing enhancement. However, the impressive results of such method and the fact of cost reductions that supported by its sufficiency of calculating the operating cost, still incurred a deficient in the handling of capital
35 costs. Whilst the depreciation cost is considered in ABC analysis, the interest charges for capital invested in an organization are not been taken seriously [32].
3.2 Performance measurement systems
3.2.1 Overall equipment effectiveness (OEE)
OEE in general display is described as one of the sufficient performance measurement tool that measures the different types of production losses essentially at equipment level and indicates areas of improvement. This tool provided a quantitative metric of efficient and effectiveness machine performance; it identifies and measure losses in relation to manufacturing factors such as availability, performance and quality rate. The major losses that drained the production efficiency and thereby the effectiveness are classified into three groups: downtime, speed, and quality losses [33].
Downtime losses consist of a breakdown, set-up, and adjustment losses. The breakdown event is categorized as time and quantity losses caused by equipment failure. For instance, this type of events lead to downtime and thus production loss. On the same ground, set-up and adjustment losses occur due to production is changing over from requirement of one item to another. This problem can happen in the situation of mixed products as the set-ups between different products. The second class of losses are the speed losses, this type of losses divided into idling and minor stoppage and reduced speed losses [34].
The idling and minor stoppage losses occur when production is sporadic by transient malfunction, and this can be a result for instance, the dirty photocells. Although, this type of stoppages can overcome quickly but in case of frequent occurrence much capacity is lost. Reduced speed loss is referred to the variance of equipment design speed (theoretical) and actual operating speed. An example of that is the improper materials used in which leads to longer processing times and speed loss [34].
The last category of production disturbances and losses is the quality losses, it includes quality defects and rework in addition to reduced yield during start-ups. The defects and rework are the losses that affect the quality because of malfunctioning production equipment such as, the
36 material that get stuck and damaged while processing. Reduced yield losses are the losses that occur from machine start-up to steadiness phase of machine operations. This kind of reduced yield might be attributable to inadequate preparation before starting up machine and especially after long-time stops caused by failure [34].
According to Muchiri and Pintelon [34], all those mentioned losses are measured by OEE, and that specified in OEE equation:
OEE = A*P*Q.
Where: Availability rate (A) = Operating time (h) / Loading time (h) * 100
Performance efficiency (P) = Theoretical cycle time (h) * Actual output (units) / Operating time (h)
Quality rate (Q) = Total production – Defect amount / Total production (units) * 100
The strength of an OEE tool is in its appearances of integrating different aspects of manufacturing into one single measurement and the contribution of indicating the efficiency of those aspects. The perspectives that emerged are maintenance effectiveness, production efficiency, and quality efficiency as can be seen in figure 6. An example of those perspectives is maintenance effectiveness in which evaluated by OEE to affirm that the maintenance policy adopted to reduce failure, and set-up times are the optimal strategy [34].
Figure 6. OEE and the perspectives of performance integrated in the tool
37 Based on OEE results, there are many advantages can be extracted from such a measurement. Firstly, it allows managers to evaluate the initial performance of a manufacturing plant and through same manner compare it with future OEE values. This feature is quantifying the level of improvement made. Secondly, an OEE calculated value for one manufacturing line can be used to assess the line performance across the whole company and thus spotlights any inefficient line performance. Thirdly, if the machine process works separately without any reliance to another machine, OEE tool has the capabilities to measure the individual machine and thereby provide the performance status. Which in turn designates the areas of improvements [35].
3.2.2 Total equipment effectiveness performance (TEEP)
TEEP is a measurement tool similar to OEE, but it deals with equipment output in reference to the total calendar time available rather than the loading time that used in OEE calculations. So, TEEP is adopted to evaluate how well the production machine (assets) are deployed in relative to the total calendar time. This way specify opportunities that might stand among current operations and world- class levels [36]. However, the performance efficiency and quality efficiency metrics are alike in correlated to both tools; the main difference is the inclusion by the availability efficiency metric [37].
Zandieh et al. [38] underlined this difference as TEEP tool has added a capability over OEE realization. This added-value happened through the measurement of equipment utilization such as, planned downtime in the total planned time horizon. Moreover, the importance of showing clearly the maintenance contribution to bottom line productivity of the plant, TEEP elements provide an obvious distinction between planned and unplanned downtime. With the help of TEEP, both parameters can be measured. Still, one main flaw of TEEP analysis is such tool limited to equipment-level productivity. Nevertheless, it is applicable to processing industries or a flow shop where the production streamline approached as a single entity [34]. In the sake of clarification, an example given by Chand and Shirvani [39] is a good example explained how TEEP can be calculated. Firstly, the equipment utilization is calculated based on the following formula: (Total running time- planned downtime)*100 / Total running time
38 According to the same example, the total running time was equal to 30, 000 minutes (125 hr. /week * 4 weeks *60) and planned downtime is equal to 1,035 minutes. This calculation excludes the set-up and adjustments time. Thus, the equipment utilization after calculation is equal to 96% (0.96). The second component of the tool is to find the actual availability that expressed into the following formula: (Loading time –set-up time –Downtime)*100 / Loading
time
The loading time (running time – planned downtime) is equal to 28,965 minutes; the set-up and adjustments time in addition to downtime were summing up to 4,881 minutes. In which leading to the actual availability of 84 % (0.84). The performance efficiency is the third element in calculating TEEP, and the formula is: (Average cycle time* number of good units made) *100
/ operating time
The average cycle time is considered to be 0.71 minute / unit; number of good units made are 25, 718; the operating time is equal to 24, 155 minutes. Thus, the performance efficiency gives 76 % (0.76) of its capacity. The last piece of calculating TEEP is to evaluate the rate of quality, the formula is: (Number of good units made- Rejects) *100 / number of good units made The number of good units made is equal to 25,718, and the number of scrap and rework units are 797. In relied on given formula the rate of quality can be extracted, the value is 97% (0.97). Finally, the TEEP can be calculated according to this formula:
TEEP = Utilization*availability*performance*rate of quality *100
In consistent with this example, TEEP = 0.96 * 0.84 * 0.76 * 0.97 * 100 = 59 %
3.3 Maintenance concept and interventions
3.3.1 Maintenance definition and perspective change
Maintenance is defined as the arrangement of all technical and managerial actions intended to preserve the item and restore it to the state in which it can perform its required function. Maintenance conventionally treated as a necessary evil, but the concept evolved recently and
39 diverted into profit generating function. The essence of this function is that the maintenance has become a cornerstone for a manufacturing organization to sustain its competitiveness [40]. The implementation of effective maintenance policy will impact in increasing the utilization of manufacturing systems. This output because the proper maintenance leads to enlarging quantity produced with good quality due to the effect that released on process efficiency and effectiveness. i.e., whilst decreasing downtime events, short stoppages, bad quality, etc. Consequently, the economic paybacks of maintenance strategies can be characterized by increasing the profit margin as a result of decreasing the manufacturing costs as shown in figure
7, [41].
Figure 7. Conceptual process of maintenance impact on firms’ profits Source: Alsyouf [41]
3.3.2 Maintenance strategies, policies and tactics
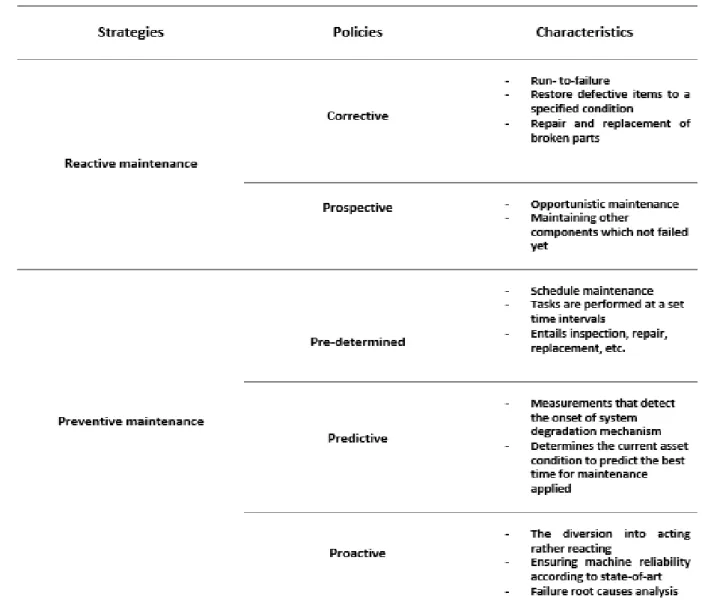
There are two crucial strategies for maintenance activities. One is reactive maintenance (RM), which attempts to decline the severity of equipment failure once they occur; the form of overhaul or replacement work is only performed when machinery has failed. In other meaning, this type of strategy restricted by a reaction to a failure occurrences. The other one is preventive maintenance (PM) that strive to reduce the probability of failure after maintenance has been applied in a certain period. It carried out at pre-determined intervals and inconsistent with pre-described criteria as intended to eliminate the degradation of an item functions. Those strategies can be realized and adapted through discrete set of policies. In the case of a
40 reactive strategy the corrective and prospective policies are the factors that constitute its content. On the other hand, the preventive strategy associated by pre-determined, predictive and proactive policies, see table 4 [42].
Table 3. Maintenance strategies, policies and characteristics
Source: Khazraei and Deuse [42]
On the whole, the implementation of those strategies in successful mode required forming and employed the right tactics. Some tactics are well commonly used in manufacturing industries, and they are characterized by enabling the preventive maintenance strategy. The tactics are condition-based maintenance, reliability-centered maintenance, and the total productive
41 maintenance. The former tactic linked to predictive policy, and the latter tactics are restricted by proactive policy [42].
Condition-based maintenance (CBM): CBM focuses on the current condition of the system or
other components that derived as subsystems. The main role is to mitigate downtime at the optimal time; it infers that a system capacity is exploited as much as it can perform its expected performance degree. The incurred procedure of replaced or repaired item must be performed before it goes below certain performance measures. As an outcome, CBM provides the ability for the system to remain operating as long as it is acting within predefined performance limits [43].
Furthermore, Mobley [44] extends the role of CBM into the determination process while problem exists in the equipment, how severe the problem and how long the equipment can perform before breakdown. Condition-monitoring techniques developed for CBM and these techniques classified in accordance to the type of symptoms that they are designed to detect. The classification is the dynamic effects in which vibration analysis techniques adopted for tracking the noise levels. In addition to particles released; chemical released; physical effects such as wear and fracture; temperature rise in the equipment; electrical effects such as conductivity and resistance [45].
Reliability-centered maintenance (RCM): RCM defined as a resource optimization method that
is conducted in ease of developing and refine maintenance programs. This tool empowers maintenance managers to direct their maintenance efforts and expenditures only on the critical functions of a piece of equipment that demanding reliable operations. The goal of RCM is to generate maintenance standards or routine that keep the critical system functions in the most cost-effective mode [46]. RCM goal can be achieved through a sequence of activities or steps as shown in figure 8.
Total productive maintenance (TPM): TPM, it is a lean manufacturing strategy that strive for
enhancing the machine efficiency and effectiveness as possible, through optimizing all types of maintenance activities [48]. This maintenance tactic is mainly inherent on focuses that combine process and people in one framework [42]. The overall aims of TPM are to:
![Figure 5. Traditional costing and activity- based costing Source: Lincoln [4]](https://thumb-eu.123doks.com/thumbv2/5dokorg/4896218.134322/34.892.92.782.357.729/figure-traditional-costing-activity-based-costing-source-lincoln.webp)
![Figure 6. OEE and the perspectives of performance integrated in the tool Source: Muchiri and Pintelon [34]](https://thumb-eu.123doks.com/thumbv2/5dokorg/4896218.134322/36.892.157.715.804.1070/figure-oee-perspectives-performance-integrated-source-muchiri-pintelon.webp)
![Figure 7. Conceptual process of maintenance impact on firms’ profits Source: Alsyouf [41]](https://thumb-eu.123doks.com/thumbv2/5dokorg/4896218.134322/39.892.109.787.497.732/figure-conceptual-process-maintenance-impact-profits-source-alsyouf.webp)
![Figure 8. The sequential steps of RCM analysis Source: Rausand [47]](https://thumb-eu.123doks.com/thumbv2/5dokorg/4896218.134322/42.892.109.783.332.681/figure-sequential-steps-rcm-analysis-source-rausand.webp)
![Figure 9. The generic factors and processes that related to Downtime event Source: Nepal and Park [1]](https://thumb-eu.123doks.com/thumbv2/5dokorg/4896218.134322/44.892.115.782.274.688/figure-generic-factors-processes-related-downtime-source-nepal.webp)