Efficient Modeling of Modular Multilevel Converters
for HVDC Transmission Systems
NOMAN AHMED
Doctoral Thesis
Stockholm, Sweden 2018
TRITA-EECS-AVL-2018:39 ISBN: 978-91-7729-798-7
Electric Power and Energy Systems School of Electrical Engineering and Computer Systems, KTH Teknikringen 33 SE-100 44 Stockholm SWEDEN
Akademisk avhandling som med tillstånd av Kungl Tekniska högskolan framlägges till offentlig granskning för avläggande av teknologie doktorsexamen torsdagen den 14 Juni 2018 klockan 10:00 i Q2, Osquldas väg 10, Kungliga Tekniska Högskolan, Stockholm.
© Noman Ahmed, 2018 Tryck: Universitetsservice AB
iii
Sammanfattning
Utvecklingen mot att utvinna alltmer elektrisk energi från förnybara källor kräver mer effektiva elektriska transmissionssystem. Det behövs också ett starkare nät, med högre styrbarhet och högre kapacitet, som kan hantera effektfluktuationer pga obalans mellan generering och last. Högspänd likströmsöverföring (HVDC) erbjuder energieffektiv och kostnadseffektiv effektöverföring på långa avstånd. På grund av sina överlägsna egenskaper har modulära multinivå-omvandlare (MMC) accepterats som den rådande tekniken för HVDC med spänningsstyva effektomvandlare (VSC). För att kunna studera framtida MMC-baserade HVDC-nät är lämpliga simu-leringsmodeller nödvändiga. Huvudmålet med denna avhandling är att ta fram kompakta simuleringsmodeller för MMC. Dessa kompakta modeller ska kunna ef-terlikna responsen för en MMC i alla relevanta fall, och ska kunna användas som beräkningseffektiva byggblock vid simulering av HVDC-nät. Denna avhandling pre-senterar två ekvivalenta simuleringsmodeller för MMC, den kontinuerliga modellen (CM) och den detaljerade ekvivalenta modellen (DEM). I jämförelse med CM kan DEM också representera egenskaper av enstaka submoduler i en MMC. Modeller-na valideras genom inbördes jämförelse och jämförelse med experimentella resultat från en MMC prototyp. Den mest betydelsefulla egenskapen hos modellerna är re-presentationen av blockeringsfunktionen för MMC:n, vilket presenterades för första gången för simuleringsmodeller genom detta arbete. Denna funktion är mycket vä-sentlig för att beskriva transienta egenskaper hos MMC:n vid uppstart och felfall. Avhandlingen undersöker även MMC:ns egenskaper med redundanta submoduler i omvandlar-armarna. Två olika styrmetoder används och jämförs.
De framtagna MMC-modellerna används för att utveckla punkt-till-punkt- och multiterminal-HVDC (MTDC). En kompakt modell för en hybdrid-HVDC-brytare tas också fram och används i MTDC-systemet. Därigenom kan ett MMC-baserat MTDC-system med hybrid-HVDC-brytare beskrivas noggrant. Analysen av fel på likströmssidan av MTDC-systemet fastslår att snabba HVDC-brytare är nödvän-diga för att isolera den felbehäftade delen av nätet utan att stoppa effektflödet i resten av systemet.
Ett generiskt fyrterminal-HVDC-system med CM-modellen utvecklas också. Det simulerade systemet kan tjäna som ett standard-testsystem för elektromagnetiskt transienta (EMT) studier vid användning av den begränsade versionen av den kom-mersiellt tillgängliga EMT-programvaran. De dynamiska egenskaperna av HVDC-nätet studeras också för olika felfall.
v
Abstract
The drive towards getting more and more electrical energy from renew-able sources, requires more efficient electric transmission systems. A stronger grid, with more controllability and higher capacity, that can handle power fluctuations due to a mismatch between generation and load is also needed. High-voltage dc (HVDC) provides efficient and economical power transmission over very long distances, and will be a key player in shaping-up the future electric grid. Due to its outstanding features, the modular multilevel con-verter (MMC) has already been widely accepted as a key concon-verter topology in voltage-source converter (VSC)-based HVDC transmission systems.
In order to study the feasibility of future MMC-based HVDC grids, ad-equate simulation models are necessary. The main objective of the thesis is to propose MMC reduced-order simulation models capable of accurately replicating the response of an MMC during all relevant operating conditions. Such models are the basic building blocks in developing efficient simulation models for HVDC grids. This thesis presents two MMC equivalent simula-tion models, the continuous model (CM) and the detailed equivalent model (DEM). Compared to the CM, the DEM is also capable of demonstrating the individual sumodule behavior of an MMC. These models are validated by comparing with the detailed MMC model as well as with experimental results obtained from an MMC prototype in the laboratory. The most significant feature of the models is the representation of the blocking capability of the MMC, presented for the first time in the literature for an MMC equivalent simulation model. This feature is very important in replicating the accurate transient behavior of an MMC during energization and fault conditions. This thesis also investigates the performance of the MMC with redundant submod-ules in the arms. Two different control strategies are used and compared for integrating redundant submodules.
The proposed MMC models are used in developing point-to-point and mul-titerminal HVDC (MTDC) systems. A reduced-order model of a hybrid HVDC breaker is also developed and employed in the MTDC system, making the test system capable of accurately replicating the behavior of the MMC-based MTDC system employing hybrid HVDC breakers. The conclusion of the analysis of dc-side faults in a MTDC system is that fast-acting HVDC breakers are necessary to isolate only the faulted part in the MTDC system to ensure the power flow in rest of the system is not interrupted.
A generic four-terminal HVDC grid test system using the CM model is also developed. The simulated system can serve as a standard HVDC grid test system. It is well-suited to electromagnetic transient (EMT) studies in a limited version of commercially available EMT-type software. The dynamic performance of the HVDC grid is studied under different fault conditions.
Acknowledgements
The work presented in this thesis was carried out at the Department of Electric Power and Energy, School of Electrical Engineering, KTH Royal Institute of Tech-nology, Stockholm, Sweden.
I would like to express my deepest gratitude to my supervisor Prof. Hans Peter-Nee. Your encouraging attitude and support during the whole project helped me to move forward in the right direction. I would like to acknowledge the efforts of my co-supervisor and mentor Prof. Lennart Ängquist. Your endless support, guidance and extreme attention to detail were all that kept me going on the path of learning. Without your kind support this work would not have been possible. I would also like to acknowledge the efforts of Prof. Lennart Harnefors and Prof. Staffan Nor-rga, your valuable comments helped me to improve the layout of my research papers. I would like to thank all the administrative staff, who provided me help during my study years. Many thanks to Eva Petersson and Peter Lönn. I would like to express my deepest gratitude to all of my colleagues (past and present) in the de-partment, for providing a pleasant working environment.
I am thankful to my parents whose guidance, prayers and love made it possible for me to reach this level. And above all, my beloved wife Hamna, I am grateful to you for being such a supportive life-partner and friend. During all ups and downs of my research, your moral support, love and encouragement helped me to move forward.
Noman Ahmed
Stockholm, June 2018Contents
Acknowledgements vii
1 Introduction 1
1.1 Background . . . 1
1.2 Main contributions of the Research Work . . . 2
1.3 Outline of the Thesis . . . 2
1.4 List of Appended Publications . . . 3
1.5 Related Publications . . . 5
2 Modular Multilevel Converter (MMC) 7 2.1 MMC Internal Dynamics . . . 9
3 Efficient Modeling of MMCs 13 3.1 MMC Modeling Approaches . . . 13
3.2 Continuous Model (CM) . . . 14
3.3 Detailed Equivalent Model (DEM) . . . 19
3.4 Validation of CM and DEM . . . 21
3.5 Experimental Verification . . . 26
3.6 Computational Speed of CM and DEM . . . 26
3.7 Modeling with Redundant Submodules . . . 28
4 MMC-Based HVDC Transmission and Multiterminal HVDC Sys-tems 33 4.1 MMC-Based HVDC Control System Architecture . . . 34
4.2 Negative Sequence Current Control (NSCC) Scheme . . . 34
4.3 Modeling of the Hybrid HVDC Circuit Breaker . . . 35
4.4 Multi-terminal HVDC Systems . . . 36
4.5 DC-side Faults in MTDC Systems . . . 37
4.6 HVDC Grids . . . 38
5 Conclusions and Future Work 41 5.1 Conclusions . . . 41
5.2 Future Work . . . 42 ix
x CONTENTS List of Symbols 43 List of Acronyms 45 Bibliography 47 Publication I 51 Publication II 63 Publication III 73 Publication IV 81 Publication V 93 Publication VI 101 Publication VII 113 Publication VIII 123 Publication IX 135
Chapter 1
Introduction
1.1
Background
The rising electricity demand due to industrialization, the mushroom-growth of large scale renewable energy sources, and a deregulated electricity market imposes the need for more efficient and lower cost high-voltage transmission systems. A stronger electric grid, with substantially higher capacity and more controllability, that can handle massive power fluctuations without losing stability is also needed. An upgrade of the existing high-voltage ac (HVAC) grids is not possible in densely populated areas because of public opposition, narrow transmission corridors and limited availability of right of way (ROW).
AC has been the preferred transmission system for the past hundred years, yet there are some technical limitations when it comes to HVAC transmission for bulk power transfer over very long distances and connection of asynchronous grids [1, 2]. On the other hand, high-voltage dc (HVDC) not only provides viable solutions to these limitations but also has economic and environmental benefits [1, 2]. HVDC has now become a matured technology and the preferred choice for bulk power transmission over very long distances with better controllability and lower losses. Foreseeing this, HVDC will be a key player in shaping the future grid.
Due to the advancements in voltage-source converter (VSC)-based HVDC tech-nology, it is generally believed that the future HVDC grid will consist of VSCs [3,4]. The advent of the modular multilevel converter (MMC) gives added advantages to the VSC family [5–8]. In recent years, the MMC has become the most widely used converter topology for VSC-based HVDC transmission systems [9]. It is most likely that the MMC will be the key converter topology for future HVDC grids.
In order to determince how such grids should be designed and to find solutions to different technical challenges for them, adequate simulation models are neces-sary. The transient analysis of such grids is not possible without an accurate and computationally efficient simulation model of the MMC. Hence, the thesis focuses on the development of MMC equivalent simulation models, which can replicate the
2 CHAPTER 1. INTRODUCTION
accurate behavior an MMC during energization, steady state and fault conditions. It also focuses on efficient modeling of multiterminal HVDC (MTDC) systems and HVDC grids and transient analysis of such systems under different fault conditions.
1.2
Main contributions of the Research Work
The first major contribution of the thesis is the development of the continuous simu-lation model (CM), capable of replicating the blocked state of an MMC. This is the first MMC equivalent simulation model with blocking capability that is presented in the literature. The model has been validated both by detailed circuit simulations and experimentally on a 10 kVA MMC prototype.
The CM lacks the capability to replicate MMC behavior on a submodule level. Therefore, a detailed equivalent model (DEM) capable of representing the MMC response on submodule level, is also developed. The DEM is also able to replicate the blocked state of the MMC. The DEM can be used to study the balancing control of the capacitor voltages in the valve-arm, redundant submodules and even the transients followed by a faulty submodule in the valve-arm. The DEM has also been validated both by detailed circuit simulations and experimental results.
In order to ensure the validity of the proposed MMC simulation models for mul-tiple applications, the objective was to include the study of short-circuit issues in multiterminal HVDC (MTDC) systems and HVDC grids. An efficient MTDC sys-tem employing hybrid HVDC breaker has been developed with all details using the detailed equivalent MMC model. In order to replicate the dynamics of the hybrid HVDC breaker, a reduced-oder model of it has also been developed. The model is capable of accurately replicating the dynamics of a hybrid HVDC breaker. This was the first simplified model of the hybrid HVDC breaker proposed in the liter-ature. The simulated MTDC and HVDC grid can serve as standard HVDC grid test systems, providing a realistic test scenario for electromagnetic transient (EMT) studies.
The open-loop control approach for MMC was proposed in [10]. A negative sequence current control (NSCC) scheme based on this open-loop approach has also been presented in the thesis.
Additionally, Publications I and II, are among the first publications predict-ing the MMC as the key converter topology for future HVDC grids. The MMC has now been the most widely accepted converter topology for VSC-based HVDC transmission systems.
1.3
Outline of the Thesis
Chapter 2 discusses the basics of an MMC and describes its internal dynamics
1.4. LIST OF APPENDED PUBLICATIONS 3
Chapter 3 describes the modeling approach for the proposed MMC simulation
models. Validation of the proposed models through detailed circuit simulations and experiments has also been presented. Additionally, the performance of the MMC with redundant submodules is analysed.
Chapter 4 presents the usability of the proposed MMC models by employing
them in different HVDC system configurations. Short-circuit issues in MTDC sys-tems and HVDC grids are analysed. The modelling approach for a reduced-order model of a hybrid HVDC breaker is also presented.
Chapter 5 summarizes the main outcome of this thesis and provides suggestions
for future research.
1.4
List of Appended Publications
The publications originated from this Ph.D. project are:
I. N. Ahmed, A. Haider, D. V. Hertem, L. Zhang, and H.-P. Nee, “Prospects and challenges of HVDC SuperGrids with modular multilevel converters,” in Proc. 14th European Conference on Power Electronics and Applications
(EPE), Birmingham, UK, Aug-Sep. 2011.
Noman Ahmed (NA) planned the paper with Hans-Peter Nee (HPN) and wrote the manuscript. Dirk Van Hertem (DVH) assisted NA in writing about Grid Topologies. The Section about DC-side resonance was written by Lidong Zhang (LZ).
II. N. Ahmed, A. Haider, D. V. Hertem, L. Zhang, S. Norrga, L. Harnefors, and H.-P. Nee, “HVDC SuperGrids with modular multilevel converters—the power transmission backbone of the future,” in Proc. 9th International
Multi-Conference on Systems, Signals and Devices (SSD-PES), Chemnitz, Germany,
Mar. 2012.
NA planned the paper together with HPN and wrote the manuscript. DVH
assisted NA in writing about Grid Topologies. The Section about DC-side resonance was written by LZ.
III. N. Ahmed, L. Ängquist, S. Norrga, and H.-P. Nee, “Validation of the con-tinuous model of the modular multilevel converter with blocking/deblocking capability,” in Proc. 10th IET International Conference on AC and DC Power
4 CHAPTER 1. INTRODUCTION
NA and Lennart Ängquist (LÄ) planned the work. NA developed the model
and performed the simulations with the support from LÄ. NA analyzed the results and wrote the paper, with feedback from LÄ.
IV. N. Ahmed, L. Ängquist, and H.-P. Nee, “Continuous modeling of open-loop control based negative sequence current control of modular multilevel convert-ers for HVDC transmission,” in Proc. 15th European Conference on Power
Electronics and Applications (EPE), Lille, France, Sep. 2013.
NA and LÄ planned the work. NA developed the code, model, and
per-formed the simulations with the support from LÄ. NA analyzed the results and wrote the paper, with feedback from LÄ.
V. N. Ahmed, L. Ängquist, S. Norrga, and H.-P. Nee, “Efficient modeling of modular multilevel converters in HVDC grids under fault conditions,” in Proc.
IEEE Power and Energy Society General Meeting (PESGM), Washington DC,
USA, Jul. 2014.
NA planned the work. NA developed the HVDC Grid model and performed
the simulations. NA analyzed the results and wrote the paper, with feedback from LÄ.
VI. N. Ahmed, L. Ängquist, S. Norrga, A. Antonopoulos, and Lennart Harne-fors, H.-P. Nee, “A computationally efficient continuous model for the modular multilevel converter,” IEEE Journal of Emerging and Selected Topics in Power
Electronics, vol. 2, no. 4, pp. 1139-1148, Dec. 2014.
NA and LÄ planned the work. NA developed the model and performed
the simulations with the support from LÄ. Antonios Antonopoulos (AA) provided the laboratory measurements. NA analyzed the results and wrote the paper, with feedback from LÄ.
VII. W. Leterme, N. Ahmed, L. Ängquist, J. Beerten, D. V. Hertem, and S. Nor-rga, “A new HVDC grid test system for HVDC grid dynamics and protection studies in EMTP,” in Proc. 11th IET International Conference on AC and
DC Power Transmission (ACDC), Birmingham, UK, Feb. 2015.
Willem Leterme (WL) and NA planned the work together with LÄ, Staffan Norrga (SN) and DVH. NA developed the HVDC grid model. WL im-plemented the protections in the model and performed the simulations. WL analyzed the results and wrote the paper, with feedback from NA and others. VIII. N. Ahmed, L. Ängquist, S. Mahmood, L. Harnefors, Staffan Norrga, and H.-P. Nee, “Efficient modeling of an MMC-based multiterminal dc system
1.5. RELATED PUBLICATIONS 5
employing hybrid HVDC breakers,” IEEE Transactions on Power Delivery, vol. 30, no. 4, pp. 1792-1801, Aug. 2015.
NA and LÄ planned the work. NA developed the model and performed
the simulations with the support from LÄ. Shahid Mahmood (SM) provided input for the Hybrid HVDC breaker. AA provided the laboratory measure-ments. NA analyzed the results and wrote the paper, with feedback from
LÄ.
IX. N. Ahmed, L. Ängquist, A. Antonopoulos, L. Harnefors, S. Norrga, and H.-P. Nee, “Performance of the modular multilevel converter with redundant submodules,” in Proc. 41st Annual Conference of the IEEE Industrial
Elec-tronics Society (IECON), Yokohama, Japan, Nov. 2015.
NA and LÄ planned the work. NA developed the code, model, and
per-formed the simulations with the support from LÄ. AA provided the labo-ratory measurements. NA analyzed the results and wrote the paper, with feedback from LÄ.
1.5
Related Publications
I. N. Ahmed, A. Haider, L. Ängquist, and H.-P. Nee, “M2C-based MTDC system for handling of power fluctuations from offshore wind farms,” in Proc.
IET Conference on Renewable Power Generation (RPG), Edinburgh, UK,
Sep. 2011.
II. A. Haider, N. Ahmed, L. Ängquist, H.-P. Nee “Open-loop Approach for Con-trol of Multi-terminal DC Systems based on Modular Multi-level Converters,” in 14th European Conference on Power Electronics and Applications (EPE), Birmingham, UK, Aug-Sep. 2011.
Chapter 2
Modular Multilevel Converter
(MMC)
The information presented in this chapter is based on Publication I and VI.
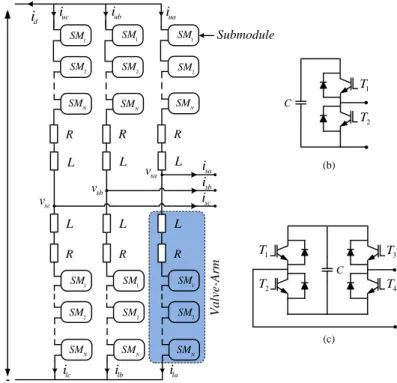
The Modular Multilevel Converter (MMC), first presented in [5], has now become the most widely used VSC topology for HVDC transmission systems. Compared to the conventional VSC topologies, the MMC is highly scalable with respect to the number of levels, as shown in Figure 2.1(a). The basic building block of an MMC is called a submodule. The number of submodules can be adjusted to obtain the desired output voltage. Several submodule topologies have been presented in the literature [9]. Until now, all MMCs for HVDC systems have been designed using half-bridge or full-bridge submodules.
Half-bridge submodule: It is mainly composed of two insulated-gate bipolar
transistor (IGBT) switches, two anti-parallel diodes and a dc storage capacitor C as shown in Figure 2.1(b). The output voltage of each submodule can either be switched to zero or a voltage V.
Full-bridge submodule: It consists of four IGBTs with anti-parallel diodes
and a capacitor as shown in Figure 2.1(c). This topology allows positive, negative as well as zero voltages.
As shown in Figure 2.1(a), each phase-leg of the MMC consists of an upper and a lower valve-arm. In each valve-arm, the submodules are cascaded in series. This gives the freedom to connect as many submodules required, without increasing the circuit complexity. The addition of the MMC to the VSC family offers added benefits, such as modular design, output voltage with low harmonic content and no
8 CHAPTER 2. MODULAR MULTILEVEL CONVERTER (MMC) (a) V a lv e-A rm (b) (c) C 1 T 2 T 3 T 4 T C 1 T 2 T Submodule + ua i ub i uc i d i sa v sc v sb v -L 2 SM R 1 SM N SM L R 1 SM N SM L R 1 SM N SM la i L R 1 SM N SM lb i L R 1 SM N SM lc i L R 2 SM 1 SM N SM sa i sb i sc i 2 SM SM2 2 SM 2 SM d V
Figure 2.1: (a) Equivalent circuit of a three-phase MMC (b) Half-bridge submodule (c) Full-bridge submodule.
requirement for common dc-link capacitor [7,8]. In case of a dc-side fault, the valve-arm inductor L can limit the feed-in alternating current through the converter. The valve-arm resistance R, models the resistive losses in the arm. The advantages of MMC over other existing converter topologies makes it the most suitable candidate for HVDC grids.
Also, the converter losses for the MMC stations are significantly lower than the two-level VSC stations. The choice of submodule implementation has a significant effect on converter losses. In [11], it is shown that the conventional half-bridge with IGBTs has around 0.5% valve losses of rated power, while full-bridge implemen-tation approximately gives 70% more losses. Hence, with reference to losses, the half-bridge implementation for MMCs, is currently the most suitable topology for HVDC transmission systems.
Each half-bridge submodule in the valve-arm acts as an individual controllable voltage source with a dc storage capacitor. There are three possible switching states
2.1. MMC INTERNAL DYNAMICS 9
for a half-bridge submodule as discussed below:
• ON-State: During normal operation, at any instant, one of the two switches in the submodule is ON. When the switch T1 is ON, the submodule is said
to be inserted and the output voltage of the submodule is the same as the voltage across the capacitor.
• OFF-State: When the switch T2is ON, the submodule is said to be bypassed
and the voltage across the submodule is zero.
• Blocked-State: When both T1 and T2 are OFF, the submodule becomes
blocked and current is only allowed to pass through the freewheeling diodes. Hence, in the blocked state, when the valve-arm current is positive the capac-itor will be inserted (and charged). Alternatively, when the valve-arm current is negative, the capacitor is bypassed (keeping its voltage).
These switching states are shown in Figure 2.2.
P osit iv e c ur re nt Ne ga ti v e c urr ent 1 T C C C C C C 1 T T1 1 T T1 T1 2 T T2 T2 2 T 2 T 2 T OFF-State ON-State Blocked-State
Figure 2.2: Switching states of a half-bridge submodule.
2.1
MMC Internal Dynamics
To understand the dynamics of an MMC, a continuous state model of an MMC can be developed. Let C be the capacitance of each submodule and N be the number of submodules per valve-arm. The valve-arm capacitance then will be given by
Carm=
C
10 CHAPTER 2. MODULAR MULTILEVEL CONVERTER (MMC)
The available sum capacitor voltage, vΣ
c, due to the valve-arm current,i, is given by
vcΣ= N n C t Z t0 idt. (2.2)
where n is the insertion index. The insertion index is defined as the instantaneous ratio between the number of inserted submodules and total number of submodules in the valve-arm. The voltage inserted by the valve-arm, varm, depends on its
insertion index and is given by
varm= nvcΣ. (2.3)
Considering the direction of the valve-arm currents shown in Figure 2.1(a), the output phase current, is, and the circulating current, idif f, are given by
is= iu− il (2.4)
idif f =
iu+ il
2 . (2.5)
The upper and lower valve-arm currents, in terms of the output phase current and the circulating current can now be expressed as
iu= is 2 + idif f (2.6) il= − is 2 + idif f. (2.7)
The available sum capacitor voltage for the upper and lower valve-arm will be
vΣcu=N nu C t Z t0 iudt (2.8) vclΣ= N nl C t Z t0 ildt. (2.9)
where subscripts u, l represent the upper and lower valve-arm, respectively. From Figure 2.1(a), the expression for the output phase voltage can be written as vs= Vd 2 − Riu− L diu dt − nuv Σ cu (2.10) vs= − Vd 2 − Ril− L dil dt − nlv Σ cl. (2.11)
2.1. MMC INTERNAL DYNAMICS 11
Subtracting (2.11) from (2.10) and using the definition for idif f, we get
Vd− 2Ridif f − 2L
didif f
dt − nuv
Σ
cu− nlvclΣ= 0. (2.12)
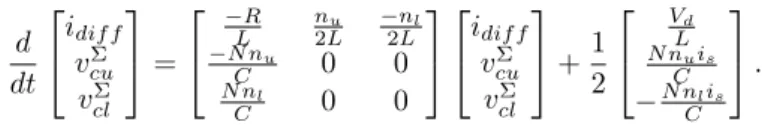
Substituting the expressions of the valve-arm currents from (2.6) and (2.7) in (2.8) and (2.9), respectively, the dynamics of one phase leg is then given by the following state-space system: d dt idif f vΣ cu vΣ cl = −R L nu 2L −nl 2L −N nu C 0 0 N nl C 0 0 idif f vΣ cu vΣ cl + 1 2 Vd L N nuis C −N nlis C . (2.13)
The interactions between upper and lower valve-arm sum capacitor voltages, circulating current, direct voltage, output phase current, and insertion indices, as expressed by (2.13), are graphically represented by the block diagram shown in Figure 2.3. diff i cl v cu v
u n l n 1 2R d V X s i X ½ X X 1 1 Ls R 1 arm C 1 arm C u i l iFigure 2.3: Block diagram representing the internal dynamics of MMC phase-leg. Hence, assuming an even voltage distribution among the submodules in the valve-arm, the state of an MMC can be described in terms of the sum capacitor voltage in each valve-arm, which is continuously updated depending on the valve-arm current and the insertion index. Describing the state of the MMC in terms of sum capacitor voltage greatly reduces its complexity especially if it is modeled for a large number of submodules. This approach is the building block in developing MMC equivalent simulation models, as will be discussed in the next chapter.
Chapter 3
Efficient Modeling of MMCs
The contents of this chapter are based on Publications III, VI, VIII and IX.
3.1
MMC Modeling Approaches
Depending on the objective of the study, MMC modeling in EMT simulation pro-grams can be done with different degrees of detail. For stress investigations in critical components of the converter during internal or external faults, it is impor-tant to follow the behavior of each individual submodule, capacitor or even a certain switch. For such studies, a detailed model of the MMC must be employed, in which it might even be necessary to represent the parasitic inductances and capacitances inside the submodules.
In contrast, for studies investigating power-system response under different fault conditions, whole MMCs may appear as adjustable voltage sources. For such stud-ies, the MMC model is required to reflect the correct dynamic behavior as seen from the power system and there is no need for data on the submodule level. Rather, to reduce the computational effort and simulation time, it is better to have an MMC simulation model which requires as few state variables as possible.
MMCs for HVDC transmission systems typically include several hundred sub-modules per valve-arm. This requires thousands of switching components to be represented if detailed MMC models should be employed. The computational bur-den for such models will be very high, resulting in unrealistically long simulation times. To avoid this, continuous or equivalent simulation models are needed. These models are required to provide a similar dynamic performance, from a system per-spective, to that of the detailed models. The main objective of the thesis is to develop reduced-order MMC models, which cannot only accurately describe the performance of the MMC in an HVDC transmission system, but are also efficient in terms of computational effort and simulation time.
14 CHAPTER 3. EFFICIENT MODELING OF MMCS
An accurate MMC model should have the capability to represent the blocked state of the submodules. Otherwise, it cannot represent the MMC’s behavior under certain conditions. The CM described below is the first MMC equivalent simulation model presented in the literature, which is capable of representing the blocked-mode operation of the MMC.
3.2
Continuous Model (CM)
The CM is based on a simplified representation of the valve-arm of an MMC, as a branch model. The valve-arm is designed in PSCAD as a user defined component calling an external subroutine written in FORTRAN. The component consists of five branches as shown in Figure 3.1. These branches can be described as:
• The resistance-inductance branch NANC, represents the valve-arm
induc-tance and its losses together with the losses in the semiconductor switches in the arm.
• The parallel-connected diode and switch branches NCND, represent diode D1
and switch T respectively.
• The branch NBNC represents the bypass diode D2, defining the current
by-pass path during blocked conditions.
• The branch NBND, represents an ideal voltage source, defining the submodule
capacitor chain in the arm of an MMC.
The parallel-connected diode and switch branches are used to adapt the model’s response to the blocking (BLK ) command, as will be discussed later. The source voltage represents the instantaneous voltage inserted by the submodules in the valve-arm. It is controlled during every simulation time-step ∆t, by calling an external subroutine for the valve-arm component that assigns a value to the internal PSCAD variable EBR.
The CM assumes an even voltage distribution among the valve-arm submodules. This allows the state of the MMC to be described in terms of the sum capacitor voltage (the sum of capacitor voltages of all the submodules) of each valve-arm, which is continuously updated based on the valve-arm current and the insertion index. This assumption also reduces the complexity of the MMC, especially if it is modeled for a large number of submodules. To develop the continuous branch model of a valve-arm, let C be the capacitance of each submodule and N be the number of submodules per valve-arm. The valve-arm capacitance then be given by
Carm=
C
N. (3.1)
The insertion index (narm), defined as the instantaneous ratio between the number
3.2. CONTINUOUS MODEL (CM) 15 1 T 2 T 1 C 2 C N C L R 1 T 2 T 1 T 2 T Bypass diode + -arm v 1 D 2 D T L A N R BLK B N D N C N Voltage source c i
Figure 3.1: Equivalent branch model of the valve-arm of an MMC.
voltage in the valve-arm. For the CM, the insertion index is assumed to be a continuous variable, varying from zero, meaning all submodules are bypassed, to 1, meaning all submodules are inserted. The change in the sum capacitor voltage caused by the branch current passing through a fraction of the submodules is the same as if the same fraction of the branch current (called the charging current ich)
passes through all submodule capacitors. If at any instant, ic is the current in the
branch then the charging current is given by
ich= narmic. (3.2)
To understand the function of the valve-arm model, the charging current and total capacitor voltage at consecutive instants in time are assumed to have the values shown in Table 3.1.
Table 3.1: Parameters for CM Valve-Arm
Time instant Charging current Sum capacitor voltage
tk−1 ich(tk−1) vcΣ(tk−1)
16 CHAPTER 3. EFFICIENT MODELING OF MMCS
Depending on the value of the charging current at instant tk−1, the total charge
that has passed through the capacitors during the interval (tk−1→ tk) is
Q(tk−1→ tk) =
ich(tk) + ich(tk−1)
2 ∆t. (3.3)
where ∆t is the integration time-step. Consequently, the sum capacitor voltage of the arm has increased by Q(tk−1 → tk)/Carm. Hence, the sum capacitor voltage
at instant tk is
vcΣ(tk) = vΣc(tk−1) + [ich(tk) + ich(tk−1)]
∆t 2Carm
. (3.4)
Depending on the value of the charging current, the sum capacitor voltage during the upcoming interval will be estimated as the average value of the sum capacitor voltage. It is assumed that the current will have the same derivative as during the past interval. Therefore, the average charging current during the upcoming interval becomes ich(avg)(tk → tk+1) = ich(tk) + ich(tk) − ich(tk−1) 2 = 3ich(tk) − ich(tk−1) 2 . (3.5)
Hence, the estimated charge for the upcoming interval becomes
Q(tk→ tk+1) =
[3ich(tk) − ich(tk−1)]
2 ∆t. (3.6)
The average increase in sum capacitor voltage caused by the charge, at the middle of the interval, is given by Q(tk → tk+1)∆t/2Carm. Thus, the estimated sum
capacitor voltage becomes
vc(avg)Σ (tk → tk+1) = vΣc(tk) + [3ich(tk) − ich(tk−1)] 2 ∆t 2Carm . (3.7)
Thus the estimated value of the source voltage (Ec) during the upcoming interval
will be given by EcΣ(tk → tk+1) = narm[vΣc(tk) + [3ich(tk) − ich(tk−1)] 2 ∆t 2Carm ]. (3.8)
The estimated source voltage is required to obtain the branch current current at the end of the upcoming interval. Depending on the value of icthe updated value of
the charging current and hence the sum capacitor voltage at the end of the interval is again updated. The inserted valve-arm voltage can now be obtained as
3.2. CONTINUOUS MODEL (CM) 17
3.2.1 Blocking capability of the CM
The equivalent models proposed in the literature before the CM and even sometime after it, lack the capability to represent the blocked state of the MMC [12–17], without which, the MMC simulation model can no longer describe its dynamic behavior during energization and fault conditions.
In the blocked state of the MMC, both switches T1 and T2 of the half-bridge
submodule are OFF, and current is only allowed to conduct through free-wheeling diodes. Hence, the output voltage of the submodule depends upon the direction of current. When the valve-arm current is positive, the capacitor will be inserted (and charged) to give the output voltage of the submodule. When the valve-arm current is negative the capacitor will be bypassed and the output voltage becomes zero. p i in 1 C 2 C N C 1 C 2 C N C L R 1 T 2 T 1 T 2 T 1 T 2 T 1 T 2 T 1 T 2 T 1 T 2 T Bypass diode + -arm v 1 D 2 D T L A N R BLK B N D N C N Voltage source p i p i in Bypass diode + -arm v 1 D 2 D T L A N R BLK B N D N C N Voltage source
Figure 3.2: Flow of positive (ip) and negative (in) current through the valve-arm
model during the blocked state.
To implement the blocked-mode representation of the valve-arm in the CM, branches NCNDand NBNC represent diodes D1and D2respectively. A
normally-closed switch T is also placed in the branch NCND parallel to diode D1. This
allows current to flow through the submodule capacitor chain in both directions during normal operation. The switch T opens, when the valve-arm is blocked, us-ing the BLK command. At the blockus-ing instant, the BLK command dictates that the insertion index becomes 1, resulting in the insertion of all submodules in the valve-arm. Hence, if blocking occurs at an instant when positive current is flowing through the valve-arm, it passes through the submodule capacitor chain through diode D1. Alternatively, if the arm is blocked when negative current is flowing
capaci-18 CHAPTER 3. EFFICIENT MODELING OF MMCS
tor chain. The schematic diagram of the implementation of the blocking capability of the CM is shown in Figure3.2.
3.2.2 Time Delay Block
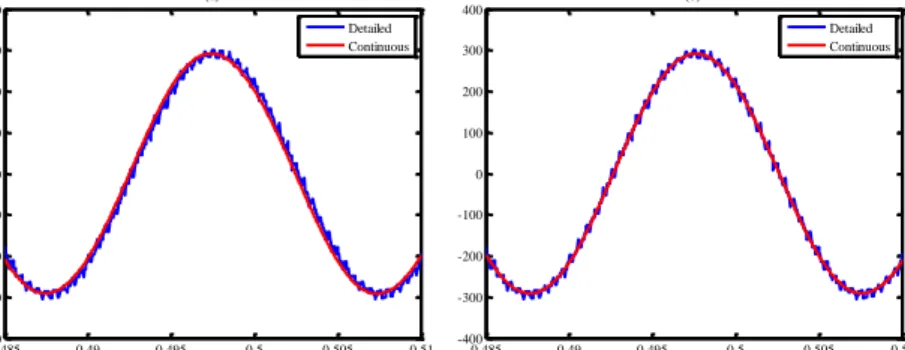
The detailed MMC simulation model (DM) utilizes a modulator to create switching pulse patterns. This process causes a time delay. As a consequence, the internal electromotive force (EMF) becomes slightly phase-shifted compared to the CM, as shown in Figure 3.3(a). In order to compensate for this effect, a time delay block has been introduced in the signal path of the CM. Hence, the insertion indices are time-delayed before they take action in the CM.
For carrier-based, phase disposition pulse-width modulation (PWM)-modulators, having a triangular carrier with the frequency, fc, the sampling time is 1/2fcand the
average delay becomes 1/4fc. For the detailed model, with 36 submodules per
valve-arm and carrier frequency 2 kHz, the resulting average switching frequency is 105 Hz per switch. This takes into account not only the carrier-reference crossing points, but also the level changes when using phase-disposition pulse-width modulation. The corresponding sampling time becomes 250 µs and an average delay of 125 µs could be expected. When insertion indices to the continuous model are delayed by 125 µs, a very good agreement between the converter’s internal EMFs produced by the two models is observed as shown in Figure 3.3(b). In a similar manner, this delay time can also be calculated for other carrier frequencies.
0.485 0.49 0.495 0.5 0.505 0.51 -400 -300 -200 -100 0 100 200 300 400 E M F ( kV ) time (s) (a) Detailed Continuous 0.485 0.49 0.495 0.5 0.505 0.51 -400 -300 -200 -100 0 100 200 300 400 time (s) (b) Detailed Continuous
Figure 3.3: Comparison of converter internal EMF for the DM and CM (a) without the time delay block (b)with the time delay block, in the CM.
The CM is capable of accurately replicating the MMC dynamics in HVDC trans-mission systems. However, it cannot be used to study the individual submodule behavior during both steady-state and fault conditions. Therefore, the approach used to develop the CM is extended to simulate a detailed equivalent MMC
simu-3.3. DETAILED EQUIVALENT MODEL (DEM) 19
lation model capable of representing the individual submodule behavior within the valve-arm.
3.3
Detailed Equivalent Model (DEM)
Similar to the CM, shown in Figure 3.1, the detailed equivalent model (DEM) of a valve-arm is also designed in PSCAD as a user defined component consisting of five branches. These branches are:
• The resistance-inductance branch NANC, represents the valve-arm
induc-tance and its losses together with the losses in the semiconductor switches in the arm.
• The parallel-connected diode and switch branches NCND, represent diode D1
and switch T respectively.
• The branch NBNC represents the bypass diode D2, defining the current
by-pass path during blocked conditions.
• The branch NBND, represents an ideal voltage source, defining the submodule
capacitor chain in the arm of an MMC.
The parallel-connected diode and switch branches are used to adapt the model’s response to the BLK command as already discussed in previous sections. The source voltage represents the sum of the capacitor voltages of the inserted submodules in the valve-arm and during the integration time-step ∆t, and is controlled by calling an external subroutine for the valve-arm component that assigns a value to the PSCAD internal variable EBR.
Compared to the CM, which utilizes the sum capacitor voltage of the valve-arm, the DEM utilizes the individual capacitor voltages, which are kept in a vector, and updated depending on the valve-arm current and the actual switching vector signal
S. In order to calculate the updated capacitor voltage of the nth submodule at the
end of each simulation time-step ∆t, the value of the branch current at the end of each interval is required. Once that current is obtained, the updated capacitor voltage can be calculated as described below.
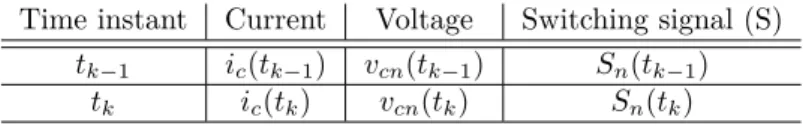
The branch current, capacitor voltage and the switching signal for the nth sub-module at consecutive time instants are shown in the Table 3.2.
Table 3.2: Parameters for DEM Valve-Arm Time instant Current Voltage Switching signal (S)
tk−1 ic(tk−1) vcn(tk−1) Sn(tk−1)
20 CHAPTER 3. EFFICIENT MODELING OF MMCS
Suppose that at time tk the current ic(tk) is obtained and the updated
capac-itor voltage vcn(tk) can be calculated. If the switching signal Sn(tk−1) for the nth submodule was 1, then the submodule has been inserted during the interval
(∆t = tk−1→ tk). Hence, the charge that has passed through the capacitor of the
submodule is
Qcn(tk−1→ tk) =
ic(tk) + ic(tk−1)
2 ∆t, (3.10)
where ∆t is the integration time-step. The voltage of the capacitor has raised by
Qcn(tk−1→ tk)/C. Hence, the capacitor voltage at instant tk is
vcn(tk) = vcn(tk−1) + [ic(tk) + ic(tk−1)]
∆t
2C. (3.11)
Alternatively, if Sn(tk−1) was zero, then the voltage of the submodule capacitor
has not been changed. Hence, vcn(tk) = vcn(tk−1).
Now, for the upcoming interval (∆t = tk → tk+1), the submodule capacitor
voltage (Ecn) is estimated. For the following interval, if Sn(tk) is equal to 1, the nth
submodule will again be inserted during the upcoming interval and contributes to the source voltage. The value of its contribution is estimated as the average voltage across the capacitor during the interval (∆t = tk → tk+1). Also, to estimate this
value, it is assumed that the current will have the same derivative as during the past interval (∆t = tk−1 → tk). Therefore, the average current during the upcoming
interval becomes ic(avg)(tk→ tk+1) = ic(tk) + ic(tk) − ic(tk−1) 2 = 3ic(tk) − ic(tk−1) 2 . (3.12)
The estimated charge for the upcoming interval becomes
Qcn(tk→ tk+1) =
[3ic(tk) − ic(tk−1)]
2 ∆t. (3.13)
This charge causes an average voltage increase during the interval, given by Qcn(tk→ tk+1)∆t/2C. Thus, the estimated voltage across the capacitor becomes
Ecn(tk → tk+1) = vcn(tk) +
[3ic(tk) − ic(tk−1)]
2
∆t
2C. (3.14) Alternatively, if during the upcoming interval, Sn(tk) is zero, the submodule will
not be inserted and will not contribute to the source voltage. It is important to mention that Ecnis the estimated voltage during any upcoming time-interval, while vcnis the updated capacitor voltage at the end of the interval. Hence, the estimated
source voltage EBR during the upcoming interval can be obtained as
EBR(tk → tk+1) =
N
X
n=1
3.4. VALIDATION OF CM AND DEM 21
The estimated voltage is required to obtain the branch current at the end of the upcoming interval. Based on that current, the capacitor voltage is again updated at the end of the interval using (3.11).
The inserted valve-arm voltage can then be obtained as
varm(tk) = N
X
n=1
Sn(tk)vcn(tk), (3.16)
and the sum capacitor voltage of the valve-arm is given by
vcΣ(tk) = N
X
n=1
vcn(tk). (3.17)
Describing the arm in such a way makes it possible to model it for any number of submodules in the valve-arm. For the DEM, the number of submodules per valve-arm, and the valve-arm capacitance, inductance and resistance are given as input parameters to the developed PSCAD component, hence they can be updated accordingly. 1.25 1.27 1.29 1.31 1.33 1.35 17 17.5 18 18.5 19 V ol ta ge ( kV ) time (s)
Figure 3.4: Individual capacitor voltages of a valve-arm.
The DEM includes the impact of individual capacitor voltages of each submodule in the valve-arm as shown in Figure 3.4. This allows to measure the maximum sub-module voltage during fault conditions. Also, it can be used to study the balancing control of the capacitor voltages in the valve-arm. In addition, the operation with redundant submodules can also be studied. The model can replicate the transients that occur when a faulty submodule is short-circuited in the valve-arm. Similarly to the CM, the DEM is also capable of representing the blocked state of an MMC.
3.4
Validation of CM and DEM
For equivalent MMC simulation models, it is very important to provide accurate re-sponses during both steady state and transient conditions. Both the CM and DEM
22 CHAPTER 3. EFFICIENT MODELING OF MMCS
are validated by comparing them with a 37-level component based DM. The DM in-cludes the detailed representation of IGBTs and diodes by using these components from the PSCAD master library. The comparison is performed in a simple study case where a 1000 MVA converter is fed from a stiff dc link and provides power to an ac-network as shown in Figure 3.5. The ac network has a 380-kV rms line-to-line voltage, and is connected to the converter through a YnD transformer, with delta connection on the converter side. The network has a short-circuit strength of 10000 MVA at the point of common coupling (PCC). The ac network is modeled using an ac source behind a lumped impedance.
The DM and DEM utilize phase disposition PWM with a 5-kHz carrier frequency. The pole-to-ground dc-link voltage is ±320 kV. The test circuit is outlined in Figure 3.5. The DM and DEM include a modulator that creates the pulse pattern using the insertion indices as references, while the CM directly utilizes the insertion indices after passing them through the time delay block.
The insertion indices are generated utilizing an open-loop approach using the estimation of stored energies. The term "open-loop" is used in the context that the control system does not measure the total capacitor voltage in the arm; instead these voltages are estimated using the desired alternating voltage and measured output currents. A detailed description of open-loop control can be found in [10]. In [18], it is also found that the open-loop control provides fast arm voltage response and dynamic performance. It is also found to be less complicated to implement than other control methods proposed for the MMC.
PCC AC Network T MMC YnD 380 kV Fault 1 PIR Main AC Breaker PIR Breaker Fault 2
Figure 3.5: Simulation test circuit for validation of proposed models.
3.4.1 MMC Energization
To validate that both proposed models are capable of simulating MMC behavior under all conditions, the energization procedure of the MMC is studied. The MMC is initially kept in the blocked state. During the energization, high inrush current is drawn from the ac network. To limit the inrush currents through the diodes of the MMC, a pre-insertion resistance (PIR) is used in series with the main ac
3.4. VALIDATION OF CM AND DEM 23
breaker. Figure 3.6 shows the simulation results for the energization of the MMC. It can be observed from the figure that within 50 ms of the start-up, the total capacitor voltage of the arm builds up from zero to 85% of the dc-link voltage. The PIR is then bypassed and the MMC is de-blocked. Comparison of output phase current, valve-arm voltage, valve-arm current and sum capacitor voltage of a valve-arm shows the excellent agreement of both proposed models with the detailed MMC model. This reveals that the proposed models are capable of simulating the energization response of the MMC.
-2 -1 0 1 2 C ur re nt ( kA )
Output phase current
DM CM DEM 0 200 400 600 V ol ta ge ( kV )
Upper valve-arm voltage
-2 -1 0 1 2 C ur re nt ( kA )
Upper valve-arm current
0 0.05 0.1 0.15 0.2 0.25 0 200 400 600 800 V ol ta ge ( kV )
Upper valve-arm sum capacitor voltage
time (s)
Figure 3.6: Simulation results of DM, CM and DEM during energization of the MMC.
24 CHAPTER 3. EFFICIENT MODELING OF MMCS
3.4.2 Single Phase-to-Ground Fault (Fault 1)
For a more detailed analysis of both DEM and CM, the dynamic behavior of the MMC is investigated during an unbalanced fault. For this purpose a single phase-to-ground fault is applied at the valve-side of the converter transformer at t=0.20 s. A comparison of all the MMC models’ output phase voltage, output phase current, dc-side current and valve-arm sum capacitor voltage is shown in Figure 3.7. Very good agreement of the CM and DEM with the DM can be observed for this case as well, validating the dynamic performance of both proposed models.
-400 -200 0 200 400 V ol ta ge ( kV )
Output phase voltage
DM CM DEM -40 -20 0 20 40 C ur re nt ( kA )
Output phase current
-20 0 20 C ur re nt ( kA ) DC-side current 0.15 0.2 0.25 0.3 0.35 0 500 1000 1500 2000 V ol ta ge ( kV )
Upper valve-arm sum capacitor voltage
time (s)
Figure 3.7: Simulation results of DM, CM and DEM for a single phase-to-ground at the valve-side of the converter transformer.
3.4. VALIDATION OF CM AND DEM 25
3.4.3 DC-Side Pole-to-Ground Fault (Fault 2)
For an MMC simulation model it is very important to give an accurate dynamic response during a dc-side fault. Hence, to observe the performance of the proposed models, a permanent pole-to-ground fault is applied at the negative pole of the MMC at t = 0.50 s. As soon as the valve-arm current of the MMC reaches the threshold of 2 kA the MMC is blocked. The main ac breaker is ordered to open after fault detection with a mechanical opening time of 30 ms. The upper valve-arm current, circulating current, dc-side current and the sum capacitor voltages for both the upper and lower valve-arms of all the models are compared. Simulation results are shown in Figure 3.8. It can be observed from the figure that both the CM and DEM equivalent MMC models show excellent agreement with the DM.
-2 0 2 C ur re nt ( kA )
Upper valve-arm current
DM CM DEM -3 -2 -1 0 1 C ur re nt ( kA ) Circulating current -2 0 2 4 6 C ur re nt ( kA ) DC-side current 0.45 0.47 0.49 0.51 0.53 0.55 550 600 650 V ol ta ge ( kV )
Upper and Lower valve-arms sum capacitor voltage
time (s)
Figure 3.8: Simulation results of DM, CM and DEM for a pole-to-ground fault at the negative pole of the MMC.
26 CHAPTER 3. EFFICIENT MODELING OF MMCS
3.5
Experimental Verification
The proposed CM and DEM are finally validated experimentally using a three-phase, 10 kVA MMC prototype in the laboratory. The prototype has 5 submodules per valve-arm, each having 100 V rated submodule capacitor voltage. The ac-side of the prototype is connected to an inductive load of 28 mH per valve-arm, using six inductors of 4.67 mH each in series.
The controller is implemented in a processing unit managing control algorithms, analog measurements, and a user interface. Modulation indices are processed di-rectly for each arm, by implementing the modulators in a field programmable gate array (FPGA). The relative measurements of the capacitor voltages for different submodules in a valve-arm are performed in the respective modulator containing sorting and selection mechanisms [10]. Direct modulation control [19] is used to ob-tain the insertion indices for the prototype. The parameters for the MMC prototype used for experimental verification are also used for the CM and DEM.
Figure 3.9 shows a comparison of the valve-arm currents, upper valve-arm voltage and the circulating current for phase A, obtained from the MMC prototype with the proposed MMC models, when the converter is blocked at t = 0.40 s. Figure 3.9(a) shows that at the instant when the converter was blocked, positive current was flowing through the upper valve-arm (blue), whereas the lower valve-arm current (green) was negative. Therefore, at the blocking instant, the upper valve-arm voltage goes to maximum, as all capacitors of the valve-arm become inserted, as shown in Figure 3.9(b). Circulating currents from the prototype and both the DEM and CM are compared in Figure 3.9(c). The zoomed-in-view of the upper valve-arm voltage in Figure 3.9(d) confirms that the proposed models are in very close agreement with the experimental results during the blocked mode.
3.6
Computational Speed of CM and DEM
The user-defined component developed to model the valve-arm for the CM and DEM consists of four nodes only (Figure 3.1). Consequently, to develop an MMC model, only twenty-four nodes are utilized in an EMT simulation programme, irre-spective of the number of submodules per valve-arm. Hence, utilizing these models, for simulating large HVDC transmission systems, greatly reduces the computational burden and increases the simulation speed significantly. This also permits the sim-ulation of multi-terminal HVDC systems in simsim-ulation programs with a limited permitted number of nodes like educational versions of EMT simulation programs. The simulation speed of CM and DEM are compared for the test circuit shown in Figure3.5 . The test system is simulated using PSCAD 4.6.0 on a computer with a 2.70-GHz Intel Core i7-4800MQ processor and 16-GB RAM. The computational times for different MMC-levels obtained for a 1-s simulation run, a solution time-step of 10 µs, and channel plot-time-step size of 10 µs are shown in Table 3.3.
3.6. COMPUTATIONAL SPEED OF CM AND DEM 27 0.3 0.33 0.36 -5 0 5 C ur re nt ( A ) Circulating current 0.3 0.33 0.36 -5 0 5 Circulating current 0.3 0.33 0.36 -5 0 5 Circulating current 0.32 0.33 0.34 0 200 400 time (s) V ol ta ge ( V ) Zoomed-in-view of upper arm voltage
0.32 0.33 0.34 0 200 400 time (s) Zoomed-in-view of
upper arm voltage
0.32 0.33 0.34 0 200 400 time (s) Zoomed-in-view of
upper arm voltage -20 -10 0 10 20 C ur re nt ( A ) Experimental results Arm currents -20 -10 0 10 20 Continuous model Arm currents -20 -10 0 10 20
Detailed equivalent model Arm currents 0 200 400 V ol ta ge ( V )
Upper arm voltage
0 200 400
Upper arm voltage
0 200 400
Upper arm voltage
Figure 3.9: Comparison of experimental and simulation results.
It is clear from the table, that the CM is more efficeint for developing MMC-based HVDC grids as its computational speed is independent of the number of submodules per valve-arm. However, if the study requires investigations on submodule-level then the DEM can also be used. The DEM requires slightly higher computational time as the length of the switching vector signal and capacitor voltages vector
28 CHAPTER 3. EFFICIENT MODELING OF MMCS
Table 3.3: Computational Times of the CM and DEM for Different MMC Levels
.
MMC Levels CM CPU Time (s) DEM CPU Time (s)
16 5.9 6.2 31 5.9 7.3 61 5.9 8.6 101 5.9 11.0 201 5.9 16.3 401 5.9 26.8
increases with the number of submodules per valve-arm.
3.7
Modeling with Redundant Submodules
In the MMC, submodule failures can occur for various reasons [20]. Fault-tolerant operation of the MMC requires that, in case of a submodule failure, the converter continues its operation without disturbing its performance. To accomplish this, additional submodules called redundant submodules, are integrated into the valve-arms of the MMC [21, 22]. This results in an increase in the number of submodules in the valve-arm. When a submodule fails, the faulty submodule is short-circuited and the converter continues its operation, without any interruption.
The equivalent circuit of the MMC with redundant submodules is shown in Fig-ure 3.10. The valve-arm of the MMC thus comprises a total number of submodules
N+NR, where NRrepresents the number of redundant submodules. At any instant,
if NF is the number of faulty submodules in the valve-arm, the total number of
active submodules in the valve-arm can be obtained as N+NR-NF, where NFvaries
from zero to NR. The valve-arm capacitance can now be given as
Carm=
C
N + NR− NF
. (3.18)
Hence, with redundant submodules in the valve-arm, the valve-arm capacitance decreases. It also varies with the number of faulty submodules. The performance of the MMC with redundant submodules in the valve-arm is studied using two different control methods as discussed below.
3.7.1 Constant Valve-arm Sum Capacitor Voltage (Method 1)
In this method the average sum capacitor voltage (sum of the capacitor voltages of the healthy submodules) across the valve-arm is kept constant. This value is se-lected to be equal to the dc-link voltage. Hence, the individual submodule capacitor voltage is given by
3.7. MODELING WITH REDUNDANT SUBMODULES 29 + ua i ub i uc i dc i d V sa v sc v sb v -L N SM R 1 SM N R SM L N SM R 1 SM N R SM L N SM R 1 SM N R SM la i L R N SM 1 SM N R SM lb i L R N SM 1 SM N R SM lc i L R N SM 1 SM N R SM sa i sb i sc i V a lv e A rm
Figure 3.10: Equivalent circuit diagram of a three-phase MMC with redundant submodules. vc= vΣ c N + NR− NF = Vd N + NR− NF . (3.19)
This indicates that the individual submodule capacitor voltages are lower than the reference case. However, submodule capacitor voltages increase with the num-ber of faulty submodules in the arm as the sum capacitor voltage in the valve-arm remains constant. This control strategy produces an ([ N+NR-NF)]+1-level
valve-arm voltage, which implies a higher number of levels than the MMC con-figuration without redundant submodules. Moreover, the number of levels in the valve-arm voltage also varies with the number of faulty submodules. The average energy stored in each valve-arm of the converter will be:
Earm= 1 2(N + NR− NF)C[ Vd N + NR− NF ]2. (3.20) This energy is lower than the energy stored in the valve-arm of the MMC without redundant submodules. However, this energy will increase with the number of faulty submodules.
30 CHAPTER 3. EFFICIENT MODELING OF MMCS
The insertion index for each valve-arm is given by
InsertionIndex = varm
vΣ
c
, (3.21)
and sent to the modulator which calculates the number of inserted submodules as the fraction of N+NR-NF that are instantly available. The individuals among
the N+NR-NF submodules, that will be inserted, are determined by the selection
mechanism based on the instantaneous value of the capacitor voltages and direction of the valve-arm current as discussed in [19].
Considering the above, the operation of the MMC during each time-step for this method can be summarized as:
• The sum of the voltages of the healthy capacitors in each valve-arm remains unchanged.
• The actual number of healthy submodules N+NR-NF is detected.
• The open-loop control system in each valve-arm will be given a reference for the total energy of the healthy capacitors which changes depending on the number because the resulting valve-arm capacitance will change accordingly. • The open-loop control for each valve-arm calculates the desired insertion
in-dex.
• The modulator for each valve-arm obtains the desired insertion index as well as the information of the number of healthy submodules.
• The modulator for each valve-arm accordingly inserts narmtimes N+NR-NF
submodules using a suitable sorting algorithm.
3.7.2 Constant Individual Submodule Capacitor Voltages (Method 2)
In this method the individual submodule capacitor voltages vc in the valve-arm are
kept constant [22] at the value:
vc = Vd
N, (3.22)
where Vd is the dc-link voltage. The average sum capacitor voltage (sum of the
capacitor voltages of the healthy submodules) across the valve-arm is thus given by
vΣc = (N + NR− NF) Vd
N. (3.23)
Clearly, the average sum capacitor voltage is greater than the dc-link voltage. However, it decreases with the number of faulty submodules in the valve-arm. The average energy stored in each valve-arm of the MMC in this case will be:
3.7. MODELING WITH REDUNDANT SUBMODULES 31 Earm= 1 2(N + NR− NF)C( Vd N) 2. (3.24)
It is obvious that the stored energy in the valve-arm is increased, compared to the case with only N submodules in the valve-arm. However, this energy decreases with the increase in the number of faulty submodules in the valve-arm. The generation of the insertion indices and the selection mechanism of submodules in the valve-arm work in the same manner as in the case of the constant sum capacitor voltage scheme. Method 2 generates a lower insertion index. Hence, among the N+NR-NF
submodules in the valve-arm, the submodules are selected in such a way to generate an N +1-level arm voltage. Thus, the number of levels in the valve-arm voltage remains constant irrespective of the number of redundant and faulty submodules in the valve-arm. Also, all submodules in the valve-arm are treated equally with reference to the balancing control of the capacitor voltage.
The operation of the MMC during each simulation time-step for this method can be summarized as:
• The reference voltage for each submodule remains unchanged. • The actual number of healthy submodules N+NR-NF is detected.
• Depending on the number of healthy submodules in the valve-arm, the sum voltage of the healthy submodule capacitors changes as vΣ
c = (N +NR−NF)vc.
• The open-loop control system in each valve-arm will be given a reference for the total energy of the healthy capacitors which changes depending on the number of submodules because the resulting valve-arm capacitance will change accordingly.
• The open-loop control for each valve-arm calculates the desired insertion in-dex.
• The modulator for each valve-arm obtains the desired insertion index as well as the information about the number of healthy submodules.
• The modulator for each valve-arm accordingly inserts narmtimes N+NR-NF
submodules using a suitable sorting algorithm.
3.7.3 Comparison of Method 1 and Method 2
Publication IX compares both control methods using the DEM when a submodule
is bypassed in a valve-arm. The transients following a submodule failure event are observed in particular.
32 CHAPTER 3. EFFICIENT MODELING OF MMCS
• has no impact on the valve-arm voltage following the bypass event of a sub-module. Transients in the valve-arm current are unavoidable as the capacitors of healthy submodules must be charged to a higher value. However, the tran-sient is well-damped and cannot be used as a criterion to choose one method over the other.
• creates more voltage levels, and therefore has less filtering requirements in normal operation (NF < NR).
• results in a lower individual submodule capacitor voltage (NF < NR), which
improves the reliability and expected lifetime of power semiconductor devices as well as submodule capacitors.
Constant Individual Submodule Capacitor Voltage method
• has no impact on the valve-arm voltage and current following the bypass event of a submodule.
• could work with a given reference value, without any need for information about the state of the other submodules.
Chapter 4
MMC-Based HVDC Transmission
and Multiterminal HVDC Systems
In this chapter, the contents of Publications III, V, VII and VIII are linked
together and presented briefly. Details can be found in the aforementioned publi-cations.
In order to observe the usability of the CM and DEM, the models were employed in different HVDC transmission system configurations. The objective is to study general short-circuit issues in HVDC systems and to observe the response of the MMC during transient conditions.
ref P meas P meas Q ref Q s v vs meas d v d V PLL , u l n meas Q ref Q vdref sdq i sabc i b v ref sq i ref sd i s i is Y AC1 T 1 T 2 AC 2 MMC 2 (Inverter) MMC 1 (Rectifier) Open-loop controller Current controller Reactive power controller DC link PLL PLL Reactive power controller Active power controller DC voltage controller abcdq abcdq Current controller Open-loop controller vs s v ref sd i ref sq i PLL , u l n PLL PLL sdq i sabc i b v s v s v Y
Figure 4.1: Point-to-point HVDC transmission system.
The point-to-point HVDC transmission system shown in Figure 4.1 is developed 33