THESIS
ANALYSIS OF THE DIURNAL CYCLE IN TAIWAN DURING THE TERRAIN-INFLUENCED MONSOON RAINFALL EXPERIMENT
Submitted by James Howard Ruppert, Jr. Department of Atmospheric Science
In partial fulfillment of the requirements For the Degree of Master of Science
Colorado State University Fort Collins, Colorado
Spring 2012
Master’s Committee:
Advisor: Richard H. Johnson V. Chandrasekar
Steven J. Fletcher Eric D. Maloney
ABSTRACT
ANALYSIS OF THE DIURNAL CYCLE IN TAIWAN DURING THE TERRAIN-INFLUENCED MONSOON RAINFALL EXPERIMENT
The diurnal cycle is investigated in Taiwan during the summer monsoon (“Mei-yu” or plum rain) season using enhanced observations from the 2008 Terrain-influenced Monsoon Rainfall Experiment (TiMREX). The diurnal cycle of an undisturbed period is compared with that of a disturbed period in an aim to 1) better understand the variability of the diurnal cycle as a function of large-scale forcing, 2) describe the complex relationships between rainfall and orographically modified flow, and 3) determine the governing environmental characteristics that distinguish disturbed and undisturbed periods. The study is performed using a regional reanalysis generated by employing three-dimensional variational data assimilation techniques, 0.5° 6-h forecasts from the NCEP GFS (National Centers for Environmental Prediction Global Forecast System), and multiple observation platforms (from TiMREX datasets and others).
The undisturbed period (UNDIST) was characterized by southwesterly monsoon flow at low levels, zonal flow in the upper troposphere, suppressed daily-mean rainfall, and unimpeded insolation. Accordingly, pronounced diurnal land–sea breeze (LSB) and mountain–valley (MV) circulations strongly controlled rainfall patterns, which exhibited patterns consistent with low-Froude-number (Fr) flow diverting around the mountainous island of Taiwan. Maximum daytime onshore/upslope flows were associated with enhanced rainfall along the coastal plains and foothills of Taiwan (as opposed to the high
peaks), until the nighttime transition brought offshore/downslope flows and development of offshore rainfall where nocturnal density currents converged with the impinging southwesterly monsoon flow.
During the disturbed period (DIST), the positioning of a prominent upper-tropospheric trough put Taiwan in a favorable area for large-scale ascent and convective organization, while a shallow, northerly cold intrusion (the Mei-yu front) provided a low-level triggering mechanism for vigorous deep convection. Although the amplitude of diurnal LSB/MV circulations was suppressed during this period (in association with reduced insolation), rainfall diurnal variability was noteworthy, suggesting heightened sensitivity of rainfall to diurnal flows. Consistent with moist conditions and higher-Fr flow, rainfall during this period was maximized over the high mountain peaks.
Analysis of vertical profiles of vertical motion and apparent heat sources and moisture sinks for UNDIST demonstrates a predominance of shallow vertical circulations and bottom-heavy convection. In contrast, vigorous deep convection was the dominant rainfall mode during DIST. That the environment was more conducive for vigorous deep convection during DIST explains the increased sensitivity of rainfall to diurnal flows.
Common to both periods was an afternoon transition from shallow to deep convection to stratiform rainfall (heating above the freezing level and cooling below; consistent with previous studies). The evolution of rainfall prior to, during, and following DIST exhibited a similar transition. This reflects the “self-similar” nature of tropical convective rainfall systems across spatial and temporal scales.
ACKNOWLEDGEMENTS
First and foremost, I thank my advisor, Dr. Richard H. Johnson, for his unwavering support and enthusiasm in both the work culminating in my Master’s thesis as well as my scientific education in general. His enthusiasm has made my pursuit of a Master’s degree as well as my overall experience at Colorado State University (CSU) remarkably fulfilling. I thank my MS committee members, Drs. V. Chandrasekar, Steven J. Fletcher, and Eric D. Maloney, for their constructive comments on and critique of this work.
I am indebted to Dr. Lance F. Bosart of the University at Albany, who since my days in undergraduate study has provided me endless mentoring advice, without which I would have surely lost my way. I thank many staff and students of the CSU Johnson Research Group, both past and present, for their valuable support, comments, and advice – Paul Ciesielski, Rick Taft, Brian McNoldy, Mike Toy, Andy Newman, Zack Finch, and Gail Cordova. I thank the many helpful administrative staff of the CSU Department of Atmospheric Science, who have assisted me in numerous ways since I arrived at CSU. I thank John Forsyth of CSU for his helpful comments. I acknowledge the helpful advice of several staff from the National Center for Atmospheric Research – Jenny Sun, Hongli Wang, and Xin Zhang.
Last but certainly not least, I wholeheartedly thank all of my friends and family, many of which I have only known since arriving at CSU in 2009. They have shown me that my success in life rests as much on their camaraderie and support as on my own academic and professional performance.
TABLE OF CONTENTS !
1 Introduction...1
1.1 The Asian monsoon ...2
1.2 The Mei-yu season...5
i). Subseasonal variability and monsoon onset...6
ii). Mesoscale overview of the Mei-yu season ...9
iii). The diurnal cycle during the Mei-yu season ...15
2 Data and Methods ...19
2.1 Observations from TiMREX and other sources...19
2.2 Reanalysis methodology ...22
2.3 Gridded datasets...26
2.4 Diagnostic quantities...27
3 Overview of the TiMREX Field Experiment...29
3.1 Overview of the SOP ...29
3.2 Comparison between an undisturbed and disturbed period ...36
4 Analysis of the Diurnal Cycle During TiMREX ...43
4.1 Diurnal cycle during UNDIST (22–29 May 2008)...47
i). Surface flows and rainfall ...47
ii). Vertical circulations and heating ...55
iii). Vertical profiles from the TiMREX Land Enhanced Sounding Array (ESA) ...63
4.2 Diurnal cycle during DIST (1–6 June 2008)...69
i). Surface flows and rainfall ...69
ii). Vertical circulations and heating ...73
iii). Vertical profiles from the TiMREX Land Enhanced Sounding Array (ESA) ...78
5 Discussion ...84
5.1 Characteristics of the diurnal cycle and relationships with rainfall...84
5.2 Impacts of topography ...87
6 Summary and Conclusions ...89
Bibliography ...93
1. INTRODUCTION
The tropical and subtropical Asian monsoon region has historically been a fervent target area of study in atmospheric science. This has largely been driven by a need for improved atmospheric predictions in an area of the globe that serves as home to the majority of the world’s population. Comprehensive understanding and accurate
prediction of monsoon rainfall variability, from diurnal through interannual timescales, are essential for global-societal concerns such as agriculture, water basin control, and flood and drought preparedness.
The analysis of Trenberth et al. (2000) demonstrates that the global divergent circulation is dominated by the seasonally varying global monsoon system, explaining 60% of the total variance. Thus, understanding the global monsoon system and its
regional constituents is inherent in description of Earth’s atmospheric general circulation, which is responsible for the majority of the poleward transport of energy received from the sun (Oort and Vonder Haar 1976; Trenberth and Caron 2001). Furthermore, since annual rainfall variability in the tropics is dominated by the global monsoon system (Wang and Ding 2008), understanding this major component of the hydrologic cycle involves understanding the local and mesoscale convective processes that, in their cumulative effect, comprise the monsoon.
The important role of diurnal variability in exerting a strong control on the timing of precipitation, particularly moist convection, has been recognized for some time
(Wallace 1975; Gray and Jacobson 1977; Dai 2001; Johnson 2011). Yet many details concerning particular aspects of diurnal variability, such as nocturnal rainfall maxima
over open oceans (e.g., Mapes and Houze 1993; Nesbitt and Zipser 2003), subseasonal variability in the diurnal cycle of monsoon convection (as in China; Yu et al. 2007; Chen et al. 2009), and substantial surface diurnal flow anomalies over open oceans (e.g., Dai and Deser 1999), have continued to elude full understanding. Much of the difficulty in studying such aspects of the diurnal cycle relates to a lack of observations over many parts of the world. Thus, many field campaigns have been conducted in recent decades in an effort to fill such gaps in understanding and learn more about, e.g., the relationships between diurnal variability, mesoscale patterns of precipitation, and the broader monsoon system.
1.1 The Asian monsoon
The Tibetan Plateau, with an average elevation exceeding 4.5 km, exerts a major control on the seasonal cycle and general climate in Asia and the surrounding regions. Sensible heating of its elevated surface and diabatic heating from convection cause a positive local buoyancy anomaly throughout the warm season, which is conducive for large-scale ascent locally and sinking motion remotely (largely accounting for the
surrounding desert/arid climates; He et al. 1987; Yanai et al. 1992; Rodwell and Hoskins 1996). With northward migration of peak shortwave heating in late spring, the northward-migrating eastern-hemispheric monsoon rainbelt works in concert with intensifying heating on/over the Tibetan Plateau to cause a planetary-scale circulation change and associated intensification of rainfall throughout a significant portion of Asia (He et al. 1987; Yanai et al. 1992). The large-scale circulation changes surrounding onset of the
Asian monsoon, which to a large degree occurs in distinct steps, can be summarized as follows (He et al. 1987; Yanai et al. 1992):
1. Mid-May – the northward-migrating monsoon rainbelt couples with the ascending branch of the vertical circulation associated with Tibetan Plateau heating;
associated with this coupling, dramatically enhanced heating (from convection and vertical/horizontal advection) extending from the eastern Plateau to the South China Plain causes northward propagation of the South Asian 200-hPa
anticyclone, reversal of the mid–upper-tropospheric meridional temperature gradient over Southeast Asia, and onset of the moist lower-tropospheric (e.g., 850-hPa) Southeast Asian southwesterly flow; in association with the latter is the commencement of heavy Southeast Asian monsoon rainfall.
2. Mid-June – as the primary monsoon rainbelt progresses northward in East Asia, intense heating commences over the western Plateau and westward as a result of adiabatic sinking and warming in the descending branch of the amplifying large-scale coupled monsoon–Plateau vertical circulation; accordingly, the 200-hPa anticyclone builds westward, the meridional temperature gradient reverses west of the Plateau, moist southwesterly flow is established in the Arabian Sea, and heavy monsoon rainfall commences in western India.
Figure 1.1, taken from Johnson 1992 (his Fig. 1b), provides a broad overview of the Asian summer monsoon circulation and rainfall pattern, roughly corresponding to June–September. Note the continuous lower-tropospheric flow connecting from the
southern-hemispheric southeasterly trades, via southerly cross-equatorial flow, to the broad region of west-southwesterly flow spanning the northern Indian Ocean, Bay of Bengal, Arabian Sea, and much of the southern Asian landmass. Heavy rainfall is present in southwestern India, the southern Plateau region, and the Indochina Peninsula. Though omitted from Fig. 1.1, heavy rainfall is also extensive in most of Southeast and East Asia during this period (e.g., Lau et al. 1988).
Fig. 1.1. Schematic of lower-tropospheric circulation and rainfall characteristics of the Asian summer monsoon (from Johnson 1992; their Fig. 1b). The hatching denotes areas of rainfall exceeding 100 cm during the June–September period. Areas of rainfall over water and east of 100°E are omitted (note that heavy rainfall is also present throughout Southeast and East Asia during this period; Lau et al. 1988). The Mei-yu region of East China is indicated near the Yangtze River valley, though the Mei-yu region studied here corresponds to that of the northern South China Sea (SCS), southern China, and Taiwan.
Superimposed on the general circulation and rainfall patterns of the Asian summer monsoon pattern discussed above is a prominent diurnal cycle. Mesoscale features such as land–sea contrast and topographic gradients cause myriad complex local
there is an important diurnal variation of the large-scale monsoonal system. Yanai et al. (1992) describe the diurnal cycle in a very deep, well-mixed boundary layer over the Plateau, which maximizes in the evening hours (coincident with maximum daytime heating). This diurnal cycle in heating over the Plateau drives a continental scale diurnal cycle in divergent circulation (Krishnamurti and Kishtawal 2000).
1.2 The Mei-yu season
Though “Mei-yu” (plum rain) is the nomenclature used for the heavy monsoon rainfall period of East China (e.g., in the Yangtze River valley; Fig. 1.1), the Mei-yu season studied here corresponds to the mid-May–mid-June heavy rainfall period in the northern South China Sea (SCS), southern China, and Taiwan (termed the “pre-summer” rainy period by Chinese meteorologists, and yu by Taiwanese). The start of the Mei-yu in Southeast Asia represents one of the early onset stages of the broader East Asian summer monsoon and, broader yet, marks the rapid-intensification stage of the entire Asian summer monsoon system (Ding and Chan 2005). Ding and Chan (2005) provide a large-scale overview of this onset period based on a 21-yr climatology generated from global reanalysis data. A synopsis of the sequence of events is as follows (Ding and Chan 2005): weak low-level southwesterly flow is first observed in the eastern Indian Ocean with convection present in the southern Indochina Peninsula and offshore (early–mid-May); around mid-May, marked cross-equatorial moisture transports are rapidly
established via the Somali jet in the western Indian Ocean (noted in Fig. 1.1) and another stream just west of the Maritime Continent; low-level westerly flow develops across the
northern Indian Ocean as the southwesterlies extend eastward across the Indochina Peninsula, such that a moisture connection is established between the southern
hemisphere, Indian Ocean, and the SCS; this marks the start of summer monsoon rainfall (Mei-yu) for Southeast Asia.
i). Subseasonal variability and monsoon onset
It has been shown that the abrupt circulation changes marking the onset of the Mei-yu season and rapid intensification of the Asian monsoon are connected with subseasonal periodic tropical modes of variability (Chen and Chen 1995; Wang and Xu 1997; Chan et al. 2002; Johnson and Ciesielski 2002; Mao and Chan 2005; Hung and Hsu 2008; Tong et al. 2009; Chen and Sui 2010). Wang and Xu (1997) demonstrate the
presence of an annually recurring northward-propagating intraseasonal oscillation (with spectral peaks from 30–60 days) in the Asian monsoon region that is characterized by a first-baroclinic-mode structure (i.e., enhanced convection connected with low-level convergence and upper-level divergence). Wang and Xu (1997) show that this mode, which they denote the climatological intraseasonal oscillation (CISO), exhibits phase locking between the annual cycle (defined as the “smooth base annual cycle” with periods >90 days) and the transient, eastward-propagating Madden–Julian oscillation (MJO; Madden and Julian 1971). Similarly, Hung and Hsu (2008) show that during years when abrupt onset of the Asian monsoon is observed (as defined by a singular sign reversal in the first principal component of 850-hPa flow in the Asian monsoon basin), there is a marked connection between the MJO propagating eastward across the Indian
Ocean and rapid enhancement of the northern Indian Ocean westerlies, northeastward extension of the southwesterly flow across the Indochina Peninsula and into the SCS, and enhanced moisture convergence in the SCS.
Mao and Chan (2005) analyze ~30 yrs of reanalysis data to describe dominant composite modes of intraseasonal wave activity connected with the SCS monsoon, which exhibits peaks in spectral power at 10–20 and 30–60 days. They discuss a composite 30– 60-day monsoon mode (hereafter, the 3060-MM) characterized by a
northward-propagating trough–ridge seesaw pattern in which the monsoon trough (i.e., the cyclonic shear side of enhanced southwesterly flow) and West Pacific subtropical ridge exist alternatively over the SCS, with anomalous cyclonic (anticyclonic) flow within the trough (ridge) coinciding with enhanced (suppressed) convection. In terms of vertical structure and associated coupling with monsoon activity, this northward-propagating mode closely resembles the CISO that Wang and Xu (1997) and Hung and Hsu (2008) connect with MJO activity. According to Tong et al. (2009), a stationary 40-day heating centered over the equator results in poleward emanation of Rossby gyres (as the heating dissipates) that modify the meridional height gradient in the SCS region and, as a result, cause an alternation of the monsoonal southwesterly flow. The implication of this study is that diabatic heating associated with the MJO, or any other convectively coupled
equatorial wave, might be sufficient to spawn the northward propagating 3060-MM. Mao and Chan (2005) also describe a composite 10–20-day monsoon mode (1020-MM), which is characterized by a low-level westward-propagating cyclone– anticyclone system with upper-level divergence (convergence) coupled to the low-level cyclone (anticyclone). They note that this “biweekly” mode, which has components
originating in both the tropical West Pacific and midlatitudes, resembles a mixed
Rossby–gravity wave train. Chen and Sui (2010) demonstrate that diabatic heating in the western tropical Pacific can generate a northwestward-propagating Rossby wave train, and further note that in the presence of westerly flow extending deep into the tropics (e.g., along the northern periphery of the West Pacific subtropical high), a “wave duct” (Webster and Holton 1982) permits Rossby wave trains to propagate southward from midlatitudes. Johnson and Ciesielski (2002) describe the passage of a prominent mixed Rossby–gravity wave over the Maritime Continent during the onset of the 1998 summer monsoon in the SCS, which originated from the east. Johnson and Ciesielski further note the presence of a westerly duct as this mode passed, which opens the possibility that the wave was forced either from the deep tropics or from midlatitudes (e.g., features
connected to the subtropical westerly jet). In fact, in their composite analysis of 30–60-day variability in 850-hPa height over the SCS, Tong et al. (2009) note that, aside from poleward-propagating Rossby wave trains from the equatorial region, there is clear equatorward propagation of features. Though they are not able to rectify the latter using their idealized simulations, these northward-originating features add to the possible origins of the 3060-MM.
The studies discussed above demonstrate the importance of subseasonal variability – namely, the 1020-MM and 3060-MM – in the initial onset of moist
southwesterly flow and convection in Southeast Asia (Wang and Xu 1997; Johnson and Ciesielski 2002; Mao and Chan 2005; Hung and Hsu 2008). Though there is an apparent tendency for the CISO and associated rapid ramp up of the Asian monsoon to occur at a similar time each year (Wang and Xu 1997; Hung and Hsu 2008), it is not obvious
whether or not one of these mode has a dominant part to play in the process of monsoon onset. The study of Mao and Chan (2005) demonstrates that the relative roles of the 1020-MM and 3060-MM vary from year to year in the SCS monsoon region (in terms of variance explained), so it is plausible that relative roles of the different wave modes in onset processes also vary from year to year. Studies have also shown connection of the above wave modes to the circulation changes observed during transitions between active and break periods in monsoon convection, which are notoriously difficult to predict (Krishnamurti and Ardanuy 1980; Chen and Chen 1995; Chan et al. 2002). Difficulties in understanding and predicting these features relates to a lack of understanding in their generation (which evidently occurs both in the deep tropics and in midlatitudes) and fundamental dynamics.
ii). Mesoscale overview of the Mei-yu season
Onset of the Mei-yu season occurs when the flow pattern exhibits a large-scale adjustment, such that a channel of moisture is established across the northern Indian Ocean, the Indochina Peninsula, and the SCS that results in an environment more
conducive for moist convection (e.g., Ding and Chan 2005). Still, the convective activity and character during a given Mei-yu season fluctuates markedly. Studies have
demonstrated a connection of these fluctuations with subseasonal modes such as the 1020-MM and 3060-MM, which evidently have both tropical and subtropical origins (e.g., Krishnamurti and Ardanuy 1980; Chen and Chen 1995; Chan et al. 2002; Johnson and Ciesielski 2002; Mao and Chan 2005). These modes are connected with anomalous
patterns in lower- and upper-tropospheric divergence and vorticity, and thus, at the most basic level, are important for controlling the southwesterly stream of moisture and instability that seeds convection in the Mei-yu region (e.g., Mao and Chan 2005).
Johnson and Bresch (1991) describe the evolution of rainfall systems during the 1987 Mei-yu season in Taiwan based on special observations from the May–June 1987 Taiwan Area Mesoscale Experiment (TAMEX). They note that there are periods during the season in which the environment was conditionally unstable and deep convection predominated, while other periods were characterized by surface northerly cold
intrusions, stable conditions, and more stratiform- and shallow-type precipitation regimes (consistent with frontal overrunning and/or stable orographic lifting). Such cold
intrusions are manifestation of the southward movement of the marked boundary between the northeasterly wintertime flow regime to the north and southwesterly summer
monsoon flow to the south (the “Mei-yu front;” Chen 2004). The roughly east–west-oriented Mei-yu front in the northern SCS region is described as a semitropical,
equivalent-barotropic warm-core feature, as it is often characterized by a quasi-stationary zone of enhanced convergence and cyclonic vorticity with weak thermal contrast (Chen 2004). It is the southwestward extension of a cold-core baroclinic frontal system (i.e., tilted westward with height) in Japan (the “Baiu front”), which is more in line with the character of the Mei-yu front situated over the Yangtze River valley later in the East Asian summer monsoon season (Fig. 1.1; Chen 2004).
The Mei-yu fronts play a major role in rainfall during the Mei-yu season (e.g., Johnson and Bresch 1991), as mesoscale convective systems (MCSs) routinely spawn, amplify, and propagate downstream along and just south of the frontal convergence line
and result in copious rainfall rates and totals in Taiwan (Chen 2004). There is a frequent amplification observed in the local Mei-yu circulation system – e.g., coincident
strengthening of the Mei-yu front with enhancement of convection, moisture flux convergence, cyclonic vorticity, and level southwesterly flow in the form of a low-level jet (e.g., at 850 hPa). A barotropic-type feedback process has been attributed to this systematic amplification in several cases (e.g., Chen et al. 2008; Lai et al. 2011). Chen et al. (2008) describe an intense case (6–7 June 2003) in which the different components of this feedback process were particularly robust: a train of mesoscale vortices developed along the Mei-yu frontal vorticity band in the presence of barotropic instability, which subsequently developed into large MCSs; convective heating and associated mesoscale ascent enhanced frontal vorticity though stretching and developed an ageostrophic, thermally-direct transverse circulation south of the front; geostrophic adjustment of the lower-branch of this circulation generated an intense (i.e., >22.5-m s-1) 850-hPa
southwesterly low-level jet (which might have then supplied more moisture to the convection; Lai et al. 2011).
Though the shallow Mei-yu front often exhibits density current-like structure (Trier et al. 1990) and is often maintained by barotropic-convective feedbacks once situated over the northern SCS region (Chen et al. 2008; Lai et al. 2011), the study by Chen (1993) suggests that Mei-yu fronts can exhibit tilted baroclinic structure,
particularly during the early stages of their development over mainland China. Observed connections of the Mei-yu front with a southward-advancing upper-level trough and low-level jet with a balanced geopotential height field (Chen 1993) suggest that the Mei-yu fronts are (at least in early stages) maintained by baroclinic processes. It is plausible that
southward advancement of the Mei-yu front is initiated by subtropical baroclinic processes, until sensible heating from the warm water surface weakens the thermal contrast and density current- and tropical barotropic-type maintenance processes take over farther south (Trier et al. 1990).
An important factor in the distribution of Mei-yu seasonal rainfall in Taiwan is related to the effects of orography on the flow dynamics. Figure 1.2, a topographic map of Taiwan, reveals the steep terrain on the island, with the coastal plains separating the west coast from the steepest slopes of the Central Mountain Range (CMR). Classical theory demonstrates that the key parameter determining whether a barrier is
hydrodynamically steep, such that it will strongly modify the flow, is the Burger number B = (h/L)(N/f), where h is the characteristic mountain height, L the flow-parallel mountain half-width, N the static stability, and f the Coriolis parameter (Overland and Bond 1995).
B represents the effective “steepness” of the barrier, such that when B << 1, the slope is mild and the flow remains in quasi-geostrophic balance, and for B >> 1, the slope is significant and ageostrophic flows divert around the barrier (Pierrehumbert and Wyman 1985; Smolarkiewicz et al. 1988; Overland and Bond 1995). For Taiwan, h ~ 2 km, L ~ 50 km, N ~ 10-2 s-1, and f ~ 10-4 s-1, resulting in B ~ 4; this suggests that the CMR of Taiwan presents a steep barrier to the flow (Li and Chen 1998). In this case, the Froude number (Fr = U/Nh), whose square represents a ratio of the kinetic energy of the ambient flow to the potential energy required to cross the barrier, can be used to assess the
characteristics of flow blocking by the steep barrier (Pierrehumbert and Wyman 1985). For U ~ 10 m s-1 (and assuming the other scales from above), Fr ~ 0.5, suggesting that the kinetic energy of the flow is small relative to the potential energy needed to cross the barrier, and thus, that the flow will be blocked and divert around the barrier (e.g., Smolarkiewicz et al. 1988; Li and Chen 1998).
Studies from TAMEX demonstrate that, consistent with low-Fr flow and the steep barrier of the CMR, there is a frequent occurrence of lower-tropospheric orographically induced barrier jets under the southwesterly monsoon flow (Li and Chen 1998). Li and Chen (1998) and Yeh and Chen (2003) demonstrate that these barrier jets, which are characterized by locally enhanced ~southerly flow over the northwestern coastal plains, result from parcel acceleration down a pressure gradient associated with an
orographically generated pressure couplet across the CMR (high pressure along the upwind slope and low pressure along the leeward slope). Fundamentally, this pressure couplet can be understood as a surplus of mass on the upwind side of the barrier and a mass deficit downwind (Smolarkiewicz et al. 1988; Carbone et al. 1995). It can
alternatively be understood from theory as forced adiabatic cooling (and hydrostatic compression) along the upwind slope, where the momentum of the ambient flow drives stable parcels upwards against gravity, and adiabatic warming (and hydrostatic
decompression) along the leeward slope where air descends to fill the mass deficit (Epifanio and Rotunno 2005).
The approach described above for diagnosing the characteristics of flow blocking (via B and Fr) is not without limit. As demonstrated by Yeh and Chen (2003), the
magnitude of the cross-CMR pressure couplet and resulting southerly barrier jet are proportional to the flow speed. This is consistent with higher momentum causing greater ascent and adiabatic cooling upwind and a greater mass deficit downwind (and associated sinking and adiabatic warming). An increase in U results in an increase in Fr, which suggests weaker blocking. Weaker blocking is evident in one sense: with increased U, the higher increased momentum enables the flow to traverse the barrier rather than divert around it. On the other hand, the observed increase in cross-CMR pressure couplet and associated barrier jet (i.e., split flow pattern) is indicative of enhanced blocking. This paradox in Fr stems from applying a two-dimensional concept to a three-dimensional problem (e.g., Pierrehumbert and Wyman 1985). Further, there are complications excluded from the above diagnosis that come with the effects of latent heating. Yeh and Chen (2003) analyze the impacts on the Taiwan barrier jet after turning off latent processes. The simulation without latent heating shows a stronger pressure couplet and associated barrier jet, suggesting that effect of the latent heating is to reduce adiabatic temperature changes associated with the orographically forced ascent [either by reducing vertical perturbations from the topography or by reducing N; consistent with Chen and
Feng (2001)]. Finally, studies have demonstrated the complicating effects of diabatic cooling-enhanced density currents, which can enhance convergence along the slopes of terrain and generate upstream- and downstream-propagating density currents with attendant convection at the leading edge (Carbone et al. 1995; Chen and Lin 2005; Asencio and Stein 2006; Miglietta and Rotunno 2009).
iii). The diurnal cycle during the Mei-yu season
It is impossible to fully understand the Mei-yu season in Taiwan and the surrounding area without considering local diurnal variability. Under strong daytime solar insolation in summer, the low-heat-capacity land surface of Taiwan heats as the thermally sluggish surface of the adjacent seas remains cool, thus causing a landward-directed horizontal buoyancy gradient that eventually generates a landward-propagating density current with attendant thermally-direct vertical circulation (sea breeze; e.g., Rotunno 1983). Likewise, the strongly sloped terrain of the CMR generates strong horizontal buoyancy gradients through a large depth as the sloped land surface heats up and adjacent air remains relatively cool, causing development of a positively buoyant upslope flow (anabatic wind; e.g., Orville 1964). The opposite patterns occur at night: the land surface cools, generating an offshore-propagating density current (land breeze), and the sloped surface of the CMR cools, causing a negatively buoyant downslope (katabatic) flow. The resulting diurnal cycle in rainfall can be summarized as follows (Johnson and Bresch 1991): as the daytime land–sea breeze (LSB) and anabatic–katabatic (or
increased rainfall develops along the coastal plains and foothills in the form of deep convection (maximizing in the early afternoon); convection evolves into stratiform rain (with heating aloft and cooling below), as likely evaporation-enhanced downslope flows develop coincident with nighttime surface cooling; offshore rainfall maximizes during the overnight/early morning hours, which is coincident with offshore-propagating density currents associated with the LSB/MV circulations.
A major consequence of the geographical layout of Taiwan (Fig. 1.2) is that the LSB/MV circulations work in tandem to exert major diurnal changes in surface flows, and thus, strong modifications to Mei-yu rainfall (Johnson and Bresch 1991; Chen and Li 1995; Kishtawal and Krishnamurti 2001; Kerns et al. 2010). The reversal of the LSB/MV circulations represents a prominent change, at least in magnitude, of the southwesterly monsoon flow impinging on the CMR (i.e., considering the diurnal circulations along western Taiwan). Consequently, the diurnal cycle of rainfall might be understood, at least in part, by considering the diurnal changes in moisture advection by the monsoonal southwesterly flow in connection with the LSB/MV circulations (Johnson and Bresch 1991).
Though the LSB/MV circulations are quite straightforward, the diurnal evolution in rainfall systems is complex, and that evolution evidently exerts its own impacts back on the diurnal circulations. For instance, though the early-afternoon peak in deep convection over Taiwan coincides well with maximum surface convergence associated with the diurnal circulations (as is expected), rainfall peaks slightly later in the afternoon (Chen and Li 1995; Kerns et al. 2010). This later peak in rainfall is related to upscale growth/maturing of convection, such that deep convective cells characterized by deep
heating maximize in the early-afternoon and subsequently evolve into more stratiform-type systems with upper-level heating and low-level cooling (Johnson and Bresch 1991). Further, evaporatively cooled downdrafts from mature convection likely enhance
nighttime katabatic flows, which might be responsible for the enhancement of rainfall along the coastal plains and/or offshore overnight (Johnson and Bresch 1991; Kerns et al. 2010). The upscale growth and transition from deep heating-dominated convection to more stratiform convection, with elevated heating and low-level cooling, is consistent with the evolution of convection observed throughout the tropics on numerous time and space scales (Kiladis et al. 2009).
The Terrain-influenced Monsoon Rainfall Experiment (TiMREX; Jou 2011) was conducted in concert with the Southwest Monsoon Experiment (SoWMEX; Jou 2011) in the northern SCS and Taiwan during the 2008 Mei-yu season. The over-arching goals of SoWMEX/TiMREX (hereafter, TiMREX) were to improve understanding and
predictability of severe-weather and heavy-rain-producing MCSs that are at times
disastrous for local societies in the extremely mountainous island of Taiwan. Involved in accomplishing these goals is developing a better understanding of the relationships between MCSs embedded in the southwesterly Southeast Asian summer monsoon flow, shallow surface frontal boundaries, and complex coastal and mountainous topography and associated diurnal variability. This study addresses these core TiMREX goals – namely, we employ TiMREX datasets to analyze the diurnal cycles of a disturbed and undisturbed period during the Mei-yu season. Through comparison of the diurnal cycle between disturbed and undisturbed periods, we aim to 1) describe the complex
variability of the diurnal cycle as a function of large-scale forcing, and 3) determine the defining mesoscale and large-scale characteristics that distinguish convectively active and inactive periods in the Southeast Asian summer monsoon.
The present study is organized as follows: procedures employed to generate a regional reanalysis based on TiMREX datasets will be described next (Chapter 2);
Chapter 3 will provide an overview of the evolution of large-scale circulation and rainfall patterns during TiMREX; Chapter 4 will present results of the diurnal cycle analysis; Chapter 5 will contain discussion; lastly, Chapter 6 will provide a summary, the principal conclusions of the study, and future work.
2. DATA AND METHODS
2.1 Observations from TiMREX and other sources
The 2008 TiMREX (Terrain-influenced Monsoon Rainfall Experiment) field campaign was conducted to better sample the flow fields characterizing the Mei-yu season in the region of Taiwan and the northern SCS (Jou 2011). The time period in which detailed observations were carried out in TiMREX, the special observing period (SOP), spans 15 May–26 June 2008, during which time networks of rawinsondes, dropsondes, and surface stations were deployed around Taiwan. The key scientific objectives of TiMREX were improved understanding of the following (Jou 2011): 1. The effects of steep terrain and characteristics of upstream flow on the
distribution and intensity of rainfall;
2. The role of the Mei-yu front and associated maintenance processes in the generation of heavy rain-producing MCSs that effect Taiwan;
3. The relationships between diurnal processes such as land–sea breeze and mountain–valley circulations and the timing, intensity, and distribution of rainfall.
In order to address the above goals, a data assimilation (DA) system was
employed to generate a regional reanalysis (hereafter, REANAL) for the TiMREX SOP using special observation datasets from TiMREX. As shown in Fig. 2.1, the domain over which REANAL was generated (with 0.25° grid spacing) includes a large area over southeastern China and the northern SCS west-southwest of Taiwan. This is important for
Fig. 2.1. Domain of the reanalysis (REANAL) based on data from the 2008 Terrain-influenced Monsoon Rainfall Experiment (TiMREX). The TiMREX enhanced sounding array (ESA) is indicated by the polygons (which include the Ocean and Land sub-domain ESAs). Color fill of sounding sites corresponds with sounding frequency, as indicated. Terrain is shaded according to the color bar.
capturing key aspects of the southwesterly summer monsoon flow. The most valuable data from TiMREX for this study are the tropospheric vertical profiles from the enhanced sounding array (ESA), which was composed of land sites in Taiwan as well as sites in the northern SCS and Taiwan Strait (Fig. 2.1). As indicated in Fig 2.1, all of the sounding stations in the ESA collected data at 4-day-1 frequency during the SOP (at 0000, 0600, 1200, and 1800 UTC). During an enhanced observing period (EOP) from 28 May–6 June, when the Mei-yu front was positioned over Taiwan and associated with heavy rainfall throughout the region, the sounding frequency at most sites was increased to 8 day-1, adding intermediate sampling at 0300, 0900, 1500, and 2100 UTC. Sixteen dropsonde
missions were also carried out during such periods of heightened activity. Along with the TiMREX sounding data, the following datasets were also employed in this study:
• Operational sounding observations from China (shown in Fig. 2.1)
• Satellite soundings from Constellation Observing System for Meteorology Ionosphere and Climate (COSMIC);
• Oceanic surface wind observations from QuikSCAT (Quick Scatterometer);
• Standard surface observations (wind, temperature, pressure, and humidity) from the Central Weather Bureau of Taiwan and Meteorological Assimilation Data Ingest System (MADIS);
• Vertical profiler wind data;
• Global Positioning System (GPS) precipitable water (PW) observations;
• Standard aircraft observations from Aircraft Meteorological Data Reporting (AMDAR) and Aircraft Communication Addressing and Reporting System (ACARS), distributed by MADIS.
Most of these datasets are operational and go through some degree of quality control prior to distribution, so no quality-control procedures were applied prior to running the DA procedures. The sounding data, however, went through extensive
correction procedures. As has been the case in previous field experiments such as TOGA COARE (Tropical Ocean Global Atmosphere Coupled Ocean–Atmosphere Response Experiment; Loehrer et al. 1996; Wang et al. 2002; Ciesielski et al. 2003), some of the sounding systems in the TiMREX ESA exhibited data accuracy issues (mostly in
humidity), which was complicated further by the fact that the TiMREX network was composed of four different sounding system types (Vaisala RS80, Vaisala RS92, Meisei, and GRAW; Ciesielski et al. 2010). Thus, issues varied slightly from one sounding site to another. Owing to early detection of these issues, a series of intercomparison launches were conducted with the Vaisala RS92 system (the most reliable instrument), which assisted with bias correction during post-processing. An in-depth discussion of the sounding issues, correction procedures, and the resulting improvements to the dataset is provided by Ciesielski et al. (2010).
2.2 Reanalysis methodology
Numerous studies have invoked interpolation methods for gridding observations from field experiments so that diagnostic quantities such as vertical motion and
divergence could be calculated over broad areas in order to analyze targeted phenomena (e.g., Nuss and Titley 1994; Ciesielski et al. 2003; Johnson et al. 2007; Johnson et al. 2010). Issues that come about with this approach are that resulting gridded fields 1) are unrealistically smooth due to the inevitable inadequacies in observation density, 2)
contain all the inherent error that is not removed by quality-control procedures, and 3) are not constrained by any sort of mass–wind balance relationship (though some studies apply mass-balance; e.g., Johnson et al. 2010). Formulating one of the key motivations of global and regional reanalysis projects, modern DA techniques can be employed to re-analyze previously observed environments by combining forecasts from modern numerical weather models with all available observations, which can include datasets
from field experiments. The use of enhanced observation datasets from field experiments can dramatically improve the representation of atmospheric processes in model analyses and forecasts (Kalnay et al. 1996; Miguex-Macho and Paegle 2000; Mo et al. 2005; Uppala et al. 2005; Mesinger et al. 2006; Mo et al. 2007). For instance, Faccani et al. (2009) demonstrate that the assimilation of sounding observations from AMMA (African Monsoon Multidisciplinary Analysis, 2006) subsequent to quality control procedures (removal of dry biases), results in dramatically improved model representation of the African easterly jet as well as moisture and precipitation fields over most of North Africa. Further, they show that forecasts improve as far as three days out over the European subcontinent when they include these sounding observations. Though this is an
encouraging finding, observations from field experiments often do not make it into the operational global analyses and forecasts, or even into the global reanalyses generated a posteriori. Further, even if the observations do make it into the reanalyses, computation limitations often mean that the reanalyses are generated on too coarse of domains for analyzing processes at the mesoscale. For instance, the dynamics of flows in Taiwan would be described by a total of about two grid points using the global reanalysis dataset described in Kalnay et al. (1996).
With recent advances in DA, which have resulted in more accurate and
computationally efficient procedures (e.g., Wang et al. 2008a, b; Meng and Zhang 2008; Huang et al. 2009; Zhang et al. 2009; Zhang et al. 2011), there is a new ability to invoke DA to create a better description of the phenomena targeted by field experiments. The Weather Research and Forecasting model, maintained by the National Center for Atmospheric Research, features a DA system (WRFDA) with the capability of
performing many of the widely accepted DA methods, such as three- and
four-dimensional variational (3DVAR and 4DVAR; Barker et al. 2004; Wang et al. 2008a, b; Huang et al. 2009). These DA methods, which originated from test bed studies, have been effectively worked into WRFDA and tested by WRFDA software architects prior to public distribution (e.g., Barker et al. 2004). Many studies have demonstrated the success of the WRFDA system and similar systems through intercomparison tests in large-scale and mesoscale modeling (e.g., Dirren et al. 2007; Meng and Zhang 2008; Torn and Hakim 2009; Majumdar et al. 2010; Torn 2010; Zhang et al. 2011).
The selected DA method for this study is 3DVAR because of its computational efficiency and long duration of employment within the operational numerical weather prediction community, which lends credence to its abilities [e.g., 3DVAR has been employed by NCEP (National Centers for Environmental Prediction) models since 1991; Derber et al 1991; Kleist et al. 2009]. It is generally understood that more advanced DA techniques (e.g., ensemble-based and 4DVAR methods) outperform 3DVAR in forecast applications (e.g., Whitaker et al. 2009), and most national numerical weather prediction centers have indeed switched to such methods (e.g., Rabier et al. 2000). However, the present study is greatly advantaged by the availability of a posteriori model forecasts for the entire time period of analysis, as will be explained below.
Like other variational DA systems, the 3DVAR system in WRFDA is formulated on the grounds that estimates of the true state of the atmosphere, as provided by
observations and model forecasts (serving as “background”), have error, and that the best estimate of the true atmospheric state (the “analysis” x) can be determined by minimizing the prescribed cost function J(x):
€ J x
( )
=Jb+Jo=1 2 x− x b(
)
T B−1(
x− xb)
+1 2 y o − h x( )
(
)
T R−1(
yo− h x( )
)
, where € Jb ( €Jo) is the distance of the sum of squares to the background state xb
(observations yo), B is the background error covariance matrix, h(x) is the observation operator used to convert between analysis and observation space, and R is the
representativeness error covariance matrix (Ide et al. 1997; Barker et al. 2004). While it is obvious that the best estimate, the resulting analysis xa, should be some “distance” from the background, it is worth noting that xa should indeed also be some distance away from observations, since they too are imperfect on account of representativeness errors (Ide et al. 1997; e.g., Ide et al. 1997). In our application, we use standard errors given in
WRFDA for the different observation platform types, though we generate a new B. 3DVAR is disadvantaged by sole dependence on a static estimate for B, whereas more advanced DA methods implicitly account for flow-dependent error in the B by either running a separate model to predict the error (4DVAR; e.g., Huang et al. 2009) or using an ensemble of prior forecasts to provide a sense of the error or spread between ensemble members (Wang et al. 2008a, b). Since our application of DA is in the generation of a reanalysis, however, and we have at our disposal all forecasts for the time period of interest, we can determine a “climatology” estimate of B specific to our time period and region based on these forecasts. We do this by iteratively measuring differences between all 12- and 24-h forecasts valid for the same time [the “National Meteorological Center method;” Parrish and Derber 1992]. We can then employ this new background error to improve the DA procedure over what would result by using a global–annual
climatological background error. In WRFDA–3DVAR, J is calculated in terms of the control variables streamfunction, velocity potential, unbalanced pressure, and either specific or relative humidity (Barker et al. 2004). Mass–wind balance is achieved by deriving a geostrophically and cyclostrophically balanced pressure from streamfunction. Balanced pressure is then latitudinally weighted to account for the breakdown of
geostrophy in the tropics.
2.3 Gridded datasets
For the generation of the TiMREX reanalysis (REANAL), the observations employed include all of the TiMREX and operational datasets described in Section 2.1, while operational 6-h forecasts from the 0.25° NCEP Global Forecasting System (GFS) served as background (which were linearly interpolated to match reanalysis grid spacing). We used 12- and 24-h forecasts from the GFS to generate the domain- and time period-specific background error estimates so that they would account for any model-period-specific biases. We also use GFS 0-h forecasts for comparison with REANAL, which sheds light on improvements made to the model by the DA procedures we invoke and special observations we employ. Yet another dataset (INTERP) was generated by gridding observations using the multiquadric interpolation scheme of Nuss and Titley (1994). This dataset is generated on the same spatial domain as REANAL (0.25° in latitude and longitude; Fig. 2.1). Generation of INTERP employed all of the observation datasets listed in Section 3.1 with the exception of the ACARS, AMDAR, and GPS PW datasets. Primarily based on observations, INTERP is used for comparison with REANAL to
demonstrate the robust meteorological features that are explained by observations, and also to reveal where the addition of model information in REANAL is beneficial in filling in gaps of data.
One issue found in REANAL was unrealistic moisture over Taiwan throughout the tropospheric column (relative to sounding observations). The unrealistic tropospheric humidity values, stemming from the background GFS datasets, were confined to areas of high terrain, which we suspect might be related to convective parameterization issues in the GFS. The humidity values were similarly unreliable in REANAL, since the
background humidity field was too different from moisture from observations. We thus use water vapor mixing ratio q from INTERP, since it represents the closest gridded product to observations.
2.4 Diagnostic quantities
Following Yanai et al. (1973), we use the gridded datasets to calculate vertical profiles of apparent heat source Q1 and apparent moisture sink Q2, which permit determination of the vertical structure of precipitating systems. These terms are calculated as follows (Johnson et al. 2010):
where s = cpT + gz is dry static energy, QR is the radiative heating rate, L is the latent heat
of condensation, c is the condensation rate, e is the evaporation rate, cp is the specific heat
of dry air, T is temperature, g is acceleration due to gravity, z is height, the overbar
denotes an area average, and the prime represents a departure from that average. All other variables are standard notation. Vertical motion ω is diagnosed in each of the datasets described in Section 3.2 by vertically integrating the horizontal divergence δ in spherical coordinates. The lower boundary condition for ω is determined by calculating the terrain slope flow following the procedure of Ciesielski and Johnson (2008). The divergence field is mass balanced in the vertical by assuming adiabatic flow at the tropopause and using a constant divergence correction as described by O’Brien (1970). The details on the computation of Q1 and Q2 are provided by Johnson and Ciesielski (2000).
3. OVERVIEW OF THE TiMREX FIELD EXPERIMENT
3.1 Overview of the SOP
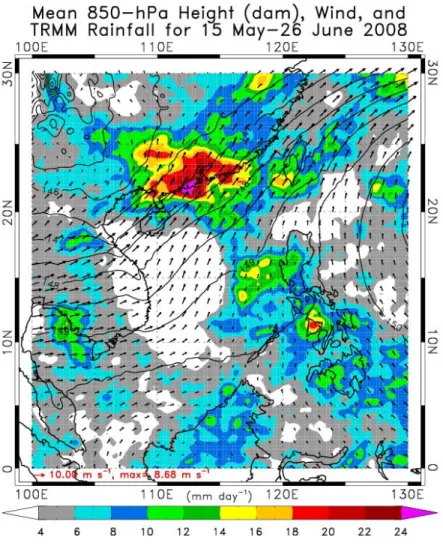
As shown in Fig. 3.1, a map of TiMREX SOP mean 850-hPa height, wind, and rainfall from the Tropical Rainfall Measuring Mission (TRMM; Kummerow et al. 2000) 3B42v6 algorithm (Huffman et al. 2007), the 2008 Mei-yu season was characterized by extensive regions of rainfall in excess of 10 mm day-1 in the southern China and northern
Fig. 3.1. Mean rainfall (mm day-1) from the 3B42v6 algorithm from Tropical Rainfall Measurement
Mission (TRMM) for the special observing period (SOP; 15 May–26 June 2008) of TiMREX (shaded
according to the color bar; mm day-1). 850-hPa height (contours; dam) and wind (vectors, reference and
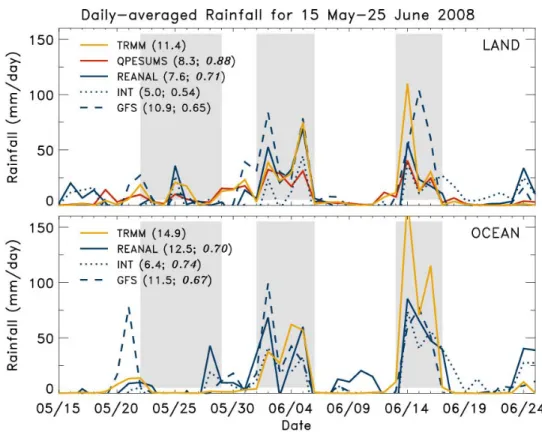
SCS regions, in the presence of predominant southwesterly low-level flow. Though Fig. 3.1 provides a sense of the regional coverage of mean 2008 Mei-yu season rainfall, notable temporal variability was observed. Next provided are comparisons between different rainfall estimates from REANAL, INTERP, 0-h forecasts from GFS, TRMM, and Quantitative Precipitation Estimation and Segregation Using Multiple Sensors (QPESUMS), which is a radar-derived and rain gauge-corrected rainfall product (data only available in a box around Taiwan). Rainfall rate is derived by vertically integrating Q2 (Eq. (3)) from REANAL, INTERP, and GFS. Surface latent heat flux is neglected from the vertically integrated moisture budget (e.g., Johnson and Ciesielski 2000) since no reliable sources for this quantity were available. Suspended liquid water in clouds is also neglected in this calculation. Nevertheless, the time series trends in rainfall rate can be compared to assess qualitative agreement and disagreement. Figure 3.2 provides SOP time series of daily-mean rainfall rate from the different estimates averaged over the Land and Ocean ESAs (with time-series mean values for and TRMM-correlations r), demonstrating that most of the Mei-yu season rainfall was received during two marked disturbed periods (ACTIVE1: 1–6 June; and ACTIVE2: 13–17 June). These disturbed periods exhibit persistent heavy rainfall (e.g., ~4 days of ~35 mm day-1 or greater), separated by roughly 10 days (Fig. 3.2). Also shown in Fig. 3.2 is an asymmetry in rainfall between the Land and Ocean ESAs (particularly during ACTIVE2), which is most strongly captured by differences in TRMM and REANAL between the two ESAs. This asymmetry is also evident in Fig. 3.1, which shows a local maximum in SOP-mean rainfall (exceeding 16 mm day-1) centered just southwest of Taiwan.
€
Figure 3.2. Domain-averaged (top: Land ESA; bottom: Ocean ESA) time series of daily-mean rainfall (mm
day-1) for the TiMREX SOP from TRMM, QPESUMS (Quantitative Precipitation Estimation and
Segregation Using Multiple Sensors), REANAL, the interpolated analysis (INTERP), and 6-h forecasts
from the National Centers for Environmental Prediction Global Forecasting System (GFS). All Q2-derived
rainfall estimates are in blue. The first numbers in parentheses are time series mean values , and the
second are correlation with TRMM r (95% confidence was established for the italicized r values using a Student’s t-test, though TRMM–QPESUMS correlation was tested to the 99% confidence level). Gray-shaded areas denote UNDIST (22–29 May), DIST (or ACTIVE1; 1–6 June), and ACTIVE2 (13–17 June).
Notable spread between the different rainfall estimates is demonstrated in Fig. 3.2, with TRMM being the wettest over both domains (i.e., note TRMM
€
x in both ESAs compared to the other estimates). Though the causes for the substantial magnitude differences between TRMM and QPESUMS over the Land ESA are unclear, it is encouraging that the temporal variability is very similar between the two datasets, as demonstrated by high TRMM–QPESUMS correlation (r = 0.88, significant to the 99% confidence level). Since TRMM is available over both domains, we use this estimate to compare and evaluate the Q -derived rainfall estimates through correlation, and consider
€
this to be warranted based on close agreement with QPESUMS over the Land ESA (assumed to be a more accurate rainfall estimate over Taiwan). Note that REANAL is the intermediate of the Q2-derived rainfall estimates in
€
x , with the highest TRMM correlation (r = 0.71) of these estimates. In contrast,
€
x from REANAL is higher than the other two Q2-derived estimates over the Ocean ESA, though all three correlate quite strongly with TRMM there. Neglecting internal TRMM error, agreement with TRMM in both ESAs (in terms of correlation) provides confidence in REANAL.
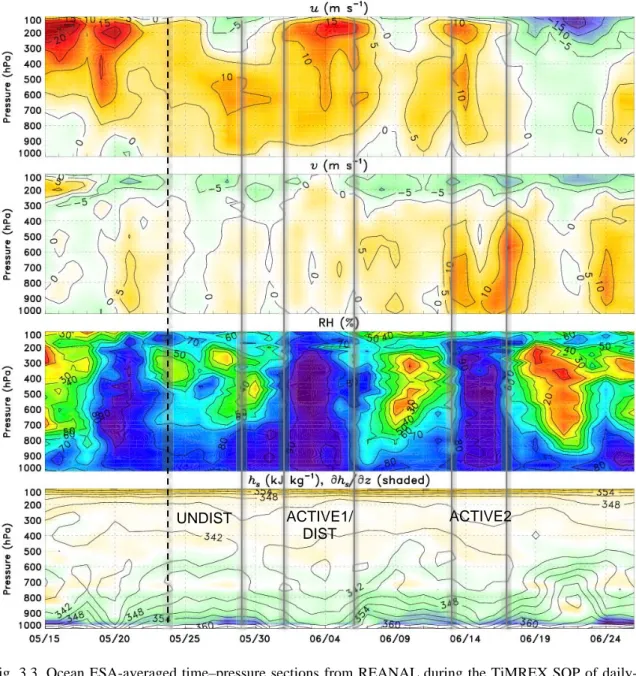
Figure 3.3 provides TiMREX SOP time–pressure sections from REANAL for the Ocean ESA, including daily-mean zonal wind u, meridional wind v, relative humidity RH (with respect to ice where <0°C), and saturation moist static energy hs = s + Lqs, where qs
is saturation water vapor mixing ratio. Onset of the monsoonal southwesterly low-level flow occurred on 22 May, and was not coincident with notable rainfall in the Ocean or Land ESAs (Fig. 3.2, disregarding the rainfall suggested solely by GFS in the Ocean ESA). Most of the SOP is characterized by lower-tropospheric conditional instability as suggested by the vertical gradient in hs. The two disturbed periods were characterized by
enhanced southwesterly flow within a deep layer extending from the surface (particularly ACTIVE2), with high RH extending into the upper troposphere. The slight reduction in low-level conditional instability during the two rainy periods is consistent with the vertical mixing of hs by convection, which has been observed in other regions of the
tropics (Thompson et al. 1979). That the period from 18–22 May, which was
characterized by deep moisture, did not coincide with heavy rainfall is consistent with a stable winter monsoon regime in the Taiwan vicinity. Evidence of this is provided by northeasterly surface flow and reduced conditional instability during the deep-moisture
Fig. 3.3. Ocean ESA-averaged time–pressure sections from REANAL during the TiMREX SOP of
daily-mean zonal wind u (top; m s-1), meridional wind v (upper-middle; m s-1), relative humidity RH (with
respect to ice where <0°C; lower-middle; %), saturated moist static energy hs (bottom; contours; kJ kg-1),
and vertical gradient in hs (bottom; shaded; kJ kg-1 km-1). Vertical dashed line denotes approximate onset of
southwesterly low-level flow (22 May 2008). UNDIST, ACTIVE1/DIST, and ACTIVE2 are indicated.
event, which was associated with the passage of a strong, deep trough, as suggested by the transitions in u and v (Fig. 3.3). Note the lowering of strengthened westerly
momentum during the period 22~28 May. Shortly following the time at which this flow reaches the surface, a period of gradual moistening (and deepening of moisture) in the
UNDIST ACTIVE1/
DIST
lower troposphere commences. Onset of this moistening also appears to be coincident with a switch to v > 0 through a deep layer. This development of deep southwesterly flow, which usually accounts for enhanced moisture flux convergence in the northern SCS region, likely reflects spin-up of the broader Asian summer monsoon system, as it appears to occur independent of a strong upper-level system (Ding and Chan 2005). The observed periodicity during the SOP, most notable in tropospheric RH (Fig. 3.3), is on the order of ~10 days. Mao and Chan (2005) note that summer monsoon variability in the SCS region is dominated in certain years by the 1020-MM (and by the 3060-MM in others). The periodic pattern in RH might be a reflection of predominance of this 1020-MM during the 2008 season.
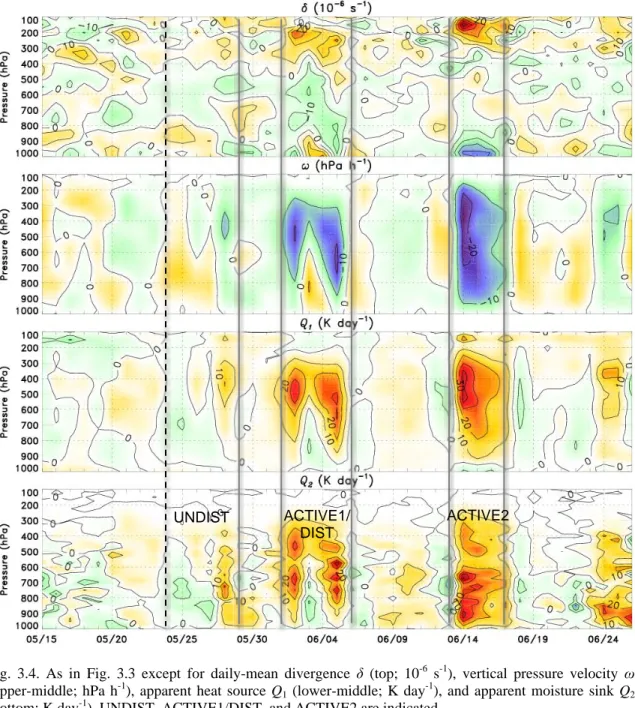
Figure 3.4 provides TiMREX SOP time–pressure sections of daily-mean δ, ω, Q1, and Q2 from REANAL for the Ocean ESA, revealing the marked signatures of deep moist convection during ACTIVE1 and ACTIVE2: vigorous deep-tropospheric ascent (consistent with the vertical profile in δ) coincident with deep apparent heating and drying. Together, Figs. 3.3 and 3.4 demonstrate patterns of convective evolution that resemble the “self-similar” nature of equatorial moist-convective modes, including the MJO (Kiladis et al. 2009). For instance, the moisture and convective evolution for the period 27 May–8 June can be summarized as follows (Figs. 3.3 and 3.4): gradual lower-tropospheric moistening and deepening of moisture coincides with predominantly weak/shallow, though deepening convection (e.g., note a divergence maximum centered near and above 800 hPa, with reduced upward motion above), while lower-tropospheric instability and mid–upper-tropospheric warm anomalies maximize (as inferred from patterns of hs; 27 May–1 June); tropospheric-deep moisture develops in association with
Fig. 3.4. As in Fig. 3.3 except for daily-mean divergence δ (top; 10-6 s-1), vertical pressure velocity ω
(upper-middle; hPa h-1), apparent heat source Q1 (lower-middle; K day-1), and apparent moisture sink Q2
(bottom; K day-1). UNDIST, ACTIVE1/DIST, and ACTIVE2 are indicated.
vigorous deep moist convection, as lower-tropospheric instability and mid–upper-level warm anomalies are substantially mixed out (1–5 June); upper-tropospheric moisture persists with rapid lower-tropospheric drying as deep moist convection subsides and convectively-cooled downdrafts take over (5–8 June). Following this roughly two-week
UNDIST ACTIVE1/
DIST
evolution, the pattern begins again as lower-tropospheric moistening primes the troposphere for deep moist convection during ACTIVE2.
Interestingly, deep moist convection appears to be more vigorous during
ACTIVE2 than ACTIVE1: note deeper and more intense ascent and apparent heating and moistening, a higher and stronger upper-tropospheric divergence peak, and stronger lower-tropospheric convergence during the later active period (Fig. 3.4). Figure 3.2 corroborates with this asymmetry in convective vigor, as most estimates exhibit greater rainfall during ACTIVE2 in the Ocean ESA. Note that the deep-tropospheric flow was more southerly and stronger during ACTIVE2 (Fig. 3.3), suggesting a more direct connection of low-level moisture transport from the southern hemisphere by the cross-equatorial flows (e.g., Ding and Chan 2005). Johnson and Ciesielski (2002) noted a similar trend in convective activity in their analysis of the 1998 Mei-yu season (which in fact exhibited similar week-to-ten-day breaks between active convection). They
demonstrated that sea surface temperature increased in the northern SCS with the progression of the season. It is possible that warmer sea surface results in increased convective instability during later periods which, combined with stronger southerly flow, might explain the increased convective vigor in the later 2008 active period (Fig. 3.4).
3.2 Comparison between an undisturbed and disturbed period
To demonstrate some of the key features that distinguished undisturbed and disturbed periods (i.e., convectively inactive and active periods) during TiMREX, we next compare some of the synoptic features associated with a characteristically
undisturbed period (UNDIST: 22–29 May 2008) and a characteristically disturbed period (DIST: 1–6 June 2008).
Figure 3.5 provides a map of mean 850-hPa height, wind, and TRMM rainfall for UNDIST. The most obvious difference from Fig. 3.1 is that rainfall is largely confined to land areas in the northern SCS region (with the exception of an area east of Taiwan), despite appreciable low-level conditional instability (Fig. 3.3) and a southwesterly flow pattern extending from the Indochina Peninsula (a favorable characteristic for convective
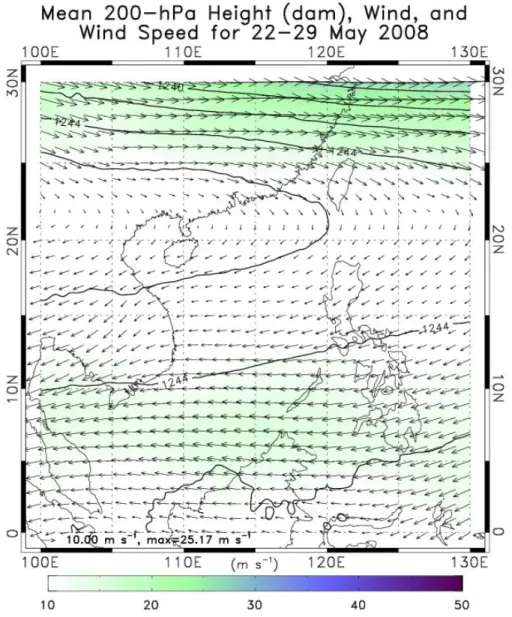
activity; e.g., Hung and Hsu 2008). It is possible that reduced tropospheric RH (Fig. 3.3) and a lack of large-scale forcing or triggering mechanism is cause for the lack of vigorous deep convection in the Taiwan vicinity during this period, which would suggest that local, e.g., diurnal variability would account for the observed rainfall. Figure 3.6 provides a map of mean 200-hPa height and wind for UNDIST, demonstrating the dominance of the characteristic 200-hPa Asian monsoon anticyclone (e.g., Ding and Chan 2005). Note that the flow is quite zonal and reaches up to ~25 m s-1 around and north of Taiwan.
Fig. 3.6. Map of 200-hPa height (dam), wind velocity (vectors; reference and maximum value at
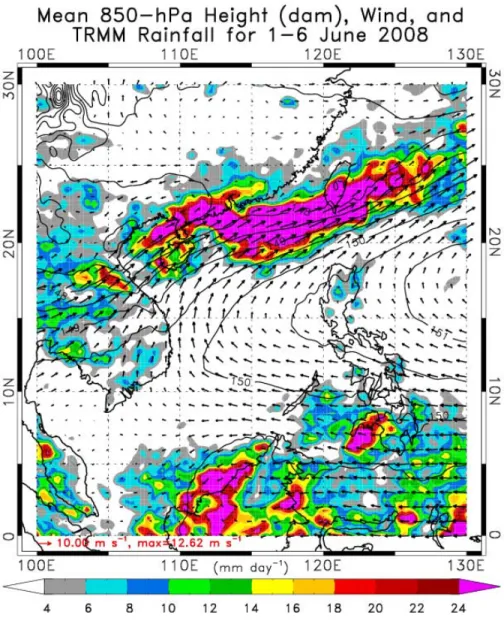
Figure 3.7 provides the mean rainfall and 850-hPa patterns for DIST, and
unmistakable is the dominance of an elongated zone of heavy rainfall in the northern SCS and across southern Taiwan. Interestingly, DIST is characterized by significant westward extension of the West Pacific subtropical anticyclone into the SCS (relative to the mean SOP and UNDIST patterns), which is associated with a focused region of enhanced southerly (west-southwesterly) flow along its western (northwestern) flank. In association with this concentrated west-southwesterly flow across the northern SCS is a band of
enhanced cyclonic shear (i.e., note the stark reduction in flow speed along the north side of the ~southwesterly stream). This band of enhanced cyclonic shear is the signature of the Mei-yu front, which was associated with northerly cold intrusions down into the Taiwan Strait and east of Taiwan during DIST (periodic near-surface northerly flow during this period in Fig. 3.3 reflects these cold intrusions). Consistent with previous studies of the Mei-yu front (e.g., Chen 2004), MCSs developed and propagated eastward along the concentrated frontal vortex line (not shown), which resulted in concentrated rainfall along and to the south of the line, including southern Taiwan (Fig. 3.7; Lai et al. 2011; Davis and Lee 2012). The 200-hPa flow pattern during DIST (Fig. 3.8) reveals much stronger westerly flow (e.g., ~45 m s-1) along the northern side of the monsoon anticyclone compared to UNDIST. Of particular interest is that the downstream side of an upper-level trough to the north of the anticyclone sits across the northern-SCS region. Through the implication of differential vorticity advection (increasing cyclonic vorticity advection with height), this suggests that large-scale forcing for ascent might have
assisted rainfall development during this period. In fact, the evolution of upper-level flow in Fig. 3.3 suggests that passage of the base of the trough (and subsequent positioning of Taiwan within the area of implied large-scale forcing for sinking motion) closely
coincides with the end of the period of deep moisture and active convection (Figs. 3.3 and 3.4). The slight lowering of maximum upper-tropospheric divergence during DIST (from 2–5 June) lends evidence to passage of the axis of a cold-core system (Fig. 3.4).
It is possible that, consistent with previous studies (Chen 1993), the Mei-yu front associated with heavy rainfall during DIST was initially (prior to DIST) connected to the upper-level trough (Fig. 3.8) while in subtropical China. Though, upon dropping
Fig. 3.8. As in Fig. 3.6 except for DIST.
southward and losing much of its baroclinicity (e.g., via sensible heating from a warmer sea surface; Trier et al. 1990), it became more of a shallow, density-current-type structure maintained by feedbacks with the diabatic heating in MCSs (Lai et al. 2011). The
positioning of the upper-level trough relative to the Taiwan region during DIST suggests that Taiwan was in a favorable area for synoptic-scale rising motion. Though perhaps not connected with the surface Mei-yu front, this trough could have served to precondition the environment for convection during DIST by enhancing free-tropospheric moistening.
In summary, the 2008 Mei-yu season was characterized by enhanced rainfall in southeastern China, Taiwan, and the northern SCS in the presence of predominant southwesterly flow (Fig. 3.1), as is typical of this stage of the East Asian summer monsoon (Ding and Chan 2005). Rainfall came mostly during two convectively active periods – ACTIVE1 (1–6 June) and ACTIVE2 (13–17 June) – which were separated by roughly 10 days (Figs. 3.2, 3.3, and 3,4). The evolution of tropospheric moisture
associated with ACTIVE1 can be summarized as follows: deepening of lower-tropospheric moisture precedes ACTIVE1 deep convection; moisture is established throughout the troposphere during ACTIVE1 deep convection; and a transition to lower-tropospheric drying is established with the end of ACTIVE1 deep convection and switch to deep sinking motion. This moisture evolution and its relationship with convection resembles the “self-similar” nature of equatorial moist-convective modes, including the MJO (Kiladis et al. 2009).
During a characteristic inactive period of the Mei-yu season (UNDIST: 22–29 May 2008), during which time mean rainfall in Taiwan was generally suppressed (Fig. 3.2), the rainfall that did occur was focused mainly over and near land areas under predominant southwesterly 850-hPa flow and a weak, zonal 200-hPa pattern (Figs. 3.5 and 3.6). During a convectively active period (DIST: 1–6 June 2008), in contrast, heavy rainfall in Taiwan (Fig. 3.2) was associated with a roughly west–east-oriented zone of enhanced convergence and vorticity at 850 hPa (Fig. 3.7), which marked the position of the Mei-yu front. During DIST, the 200-hPa flow was stronger and the Taiwan region was positioned slightly east of a 200-hPa trough (Fig. 3.8), suggesting a favorable environment for large-scale ascending motion.
4. ANALYSIS OF THE DIURNAL CYCLE DURING TiMREX
A spectral time series of rainfall during TiMREX demonstrates the dominance of diurnal variability in Taiwan during the summer monsoon season (Fig. 4.1). This is consistent with the mountainous topography and abundance of coastline in Taiwan (Fig. 1.2), permitting development of land–sea breeze (LSB) and mountain–valley (MV) circulations in the presence of daytime solar heating and nighttime cooling. As discussed by Davis and Lee (2012), the diurnal cycle in Taiwan is not uniform throughout
TiMREX. It varies as a result of large-scale variability and associated impacts on, e.g., cloudiness, convective instability, and triggering mechanisms. Davis and Lee (2012) use the QPESUMS dataset to describe the TiMREX SOP rainfall characteristics in Taiwan. They demonstrate that afternoon convection over the terrain was commonplace during the early period of TiMREX (15 May–2 June), accounting for most May rainfall. In contrast, they note that much of the June rainfall was received in the form of intense, long-lasting events, during which time the diurnal cycle of rainfall was at times obscured.
Fig. 4.1. Spectral time series of QPESUMS rainfall averaged over Taiwan. 95% significance and red noise curves are overlaid for reference. 95% significance was calculated using the F statistic and two degrees of freedom.