This is the published version of a paper published in Science Advances.
Citation for the original published paper (version of record):
Akkaya, M., Bansal, A., Sheehan, P W., Pena, M., Molina-Cruz, A. et al. (2020)
A single-nucleotide polymorphism in a Plasmodium berghei ApiAP2 transcription
factor alters the development of host immunity
Science Advances, 6(6): eaaw6957
https://doi.org/10.1126/sciadv.aaw6957
Access to the published version may require subscription.
N.B. When citing this work, cite the original published paper.
Permanent link to this version:
I M M U N O L O G Y
A single-nucleotide polymorphism in a
Plasmodium berghei ApiAP2 transcription factor
alters the development of host immunity
Munir Akkaya1*, Abhisheka Bansal2†, Patrick W. Sheehan1‡, Mirna Pena1, Alvaro Molina-Cruz2,
Lindsey M. Orchard3, Clare K. Cimperman1, Chen-Feng Qi1, Philipp Ross3§, Takele Yazew1,
Daniel Sturdevant4, Sarah L. Anzick4, Girija Thiruvengadam2||, Thomas Dan Otto5,
Oliver Billker6,7, Manuel Llinás3,8, Louis H. Miller2, Susan K. Pierce1*
The acquisition of malaria immunity is both remarkably slow and unpredictable. At present, we know little about the malaria parasite genes that influence the host’s ability to mount a protective immune response. Here, we show that a single-nucleotide polymorphism (SNP) resulting in a single amino acid change (S to F) in an ApiAP2 transcription factor in the rodent malaria parasite Plasmodium berghei (Pb) NK65 allowed infected mice to mount a T helper cell 1 (TH1)–type immune response that controlled subsequent infections. As compared to PbNK65S,
PbNK65F parasites differentially expressed 46 genes, most of which are predicted to play roles in immune evasion.
PbNK65F infections resulted in an early interferon- response and a later expansion of germinal centers, resulting
in high levels of infected red blood cell–specific TH1-type immunoglobulin G2b (IgG2b) and IgG2c antibodies. Thus,
the Pb ApiAP2 transcription factor functions as a critical parasite virulence factor in malaria infections.
INTRODUCTION
Malaria is an infectious disease caused by parasites of the genus
Plasmodium. In humans, the most deadly parasite, Plasmodium falciparum,
is responsible for the deaths of nearly 400,000 individuals a year, mostly young African children. A recent report by the World Health Organization concluded that the progress achieved over recent years in reducing global malaria cases and deaths appears to have stalled (1). At present, there is no effective malaria vaccine and the need for one is all the more acute. A better understanding of the host-parasite interactions that influence the host’s ability to mount a protective immune response would aid in the development of an effective vaccine.
In previously unexposed individuals, blood-stage P. falciparum parasites rapidly replicate and induce fever and other symptoms of malaria, mediated by the parasite-induced production of pro- inflammatory cytokines, including interferon- (IFN-) and tumor necrosis factor– (TNF-), and chemokines by both innate immune cells and CD4+ T cells (2–5). Although responsible for the disease symptoms, this inflammatory response is critical for the control of
blood-stage parasites (6, 7). Over time in malaria endemic areas, individuals eventually acquire protective antibodies that control blood- stage parasites. Thus, control of parasites in humans has two phases: an immediate inflammatory response upon infection and a longer-term process of acquiring protective antibodies following repeated infec-tions. In nonlethal Plasmodium infections in mouse models, two similar phases, namely, an early IFN-–mediated control of blood-stage parasitemia followed by the later acquisition of protective antibodies, have been demonstrated (8–10). In lethal Plasmodium infections, these protective mechanisms are presumably not adequately induced, resulting in failure to control blood-stage parasitemia. At present, we have an incomplete understanding of the mechanisms that regulate the ability of Plasmodium parasites to induce the early inflammatory and later antibody responses in the host. Recent evi-dence suggests that Plasmodium parasites may disable the host’s immune response through dysregulation of B cell and CD4+ T cell functions (11, 12), although specific mechanisms have yet to be demonstrated. This raises the question: does the Plasmodium par-asite genome encode genes that function to control the host immune response, analogous to virulence factors in other pathogens. Cur-rently, there are only a few examples of candidate virulence genes (13, 14) and our understanding of the mechanisms by which such genes function is incomplete.
Here, we report on the impact of a single-nucleotide polymorphism (SNP) between the rodent parasites P. berghei (Pb) NK65 and PbANKA on the ability of mice to mount a protective immune response to infection. This SNP is in the gene that encodes a member of the apicomplexan homolog of plant Apetela2 (ApiAP2) transcription factor (TF) family. There are only 20 SNPs in the coding regions of the genes of PbNK65 and PbANKA parasites (14). It is remarkable that the two parasites differ in so few SNPs considering the extreme differences in the diseases they cause. PbNK65 infections result in anemia in mice that, with time, is lethal but not directly immune mediated. In contrast, PbANKA infections result in severe cerebral malaria that rapidly kills mice in a CD8+ T cell–dependent process.
1Laboratory of Immunogenetics, National Institute of Allergy and Infectious Diseases,
National Institutes of Health, Rockville, MD, USA. 2Laboratory of Malaria and Vector
Research, National Institute of Allergy and Infectious Diseases, National Institutes of Health, Rockville, MD, USA. 3Department of Biochemistry and Molecular Biology
and Huck Center for Malaria Research, The Pennsylvania State University, University Park, PA, USA. 4Research Technologies Branch, National Institute of Allergy and
Infectious Diseases, National Institutes of Health, Bethesda, MD, USA. 5Wellcome
Trust Sanger Institute, Hinxton, Cambridge CB10 1SA, UK. 6Department of Molecular
Biology, Umeå University, S-90187 Umeå, Sweden. 7Laboratory for Molecular Infection
Medicine Sweden, Umeå University, S-90187 Umeå, Sweden. 8Department of Chemistry,
Pennsylvania State University, University Park, PA, USA.
*Corresponding author. Email: spierce@nih.gov (S.K.P.); munir.akkaya@nih.gov (M.A.) †Present address: School of Life Sciences, Jawaharlal Nehru University, New Delhi, India.
‡Present address: Department of Neurology, Washington University School of Medicine in St. Louis, St. Louis, MO, USA.
§Present address: Genetics, Genomics and Systems Biology Program, University of Chicago, Chicago, IL, USA.
||Present address: Center for Genetic Medicine Research, Children’s National Medical Center, Washington, DC, USA.
Copyright © 2020 The Authors, some rights reserved; exclusive licensee American Association for the Advancement of Science. No claim to original U.S. Government Works. Distributed under a Creative Commons Attribution NonCommercial License 4.0 (CC BY-NC). on March 10, 2020 http://advances.sciencemag.org/ Downloaded from
Thus, in the evolution of Plasmodium, these SNPs may have had a profound effect. Most of the 20 PbNK65/PbANKA SNPs were in genes of unknown function. ApiAP2 was of interest because, as a TF, it likely controlled the expression of a variety of genes. We hypothesized that the PbNK65/PbANKA SNP in the gene encoding ApiAP2 may be a good candidate for a parasite virulence factor that controls host immune responses.
There are 26 members of the ApiAP2 TF family, and despite their similarities, each has unique features in terms of their DNA recognition motifs and their expression patterns during the life cycle of Plasmodium, suggesting distinct functional properties (15–17). PBANKA_011210 (referred to here as ApiAP2) is a Pb ApiAP2 family member predominantly expressed in schizonts in the blood stage of the parasite infection in mice and appears to be essential as Pb par-asites, in which the gene encoding ApiAP2 was knocked out, were not viable (18). Consequently, we have little knowledge of the func-tions that are dependent on the expression of this TF. Recent com-parative genetic screening of rodent Plasmodium strains (14, 19) revealed a nonsynonymous SNP (a T-to-C transition at position 5468) in the first DNA binding domain of the ApiAP2 gene. This SNP resulted in a phenylalanine (F) in PbANKA and PbSP11 strains and a serine (S) in PbNK65 and PbK173 strains at amino acid position 1823 of the ApiAP2 protein. Given that this polymorphism is located in the ApiAP2 DNA binding domain and that the biochemical dif-ferences between phenylalanine, a hydrophobic aromatic amino acid, and serine, a hydrophilic amino acid, we postulated that these two genes may encode functionally different ApiAP2 proteins.
Here, we provide evidence that the two polymorphic forms of ApiAP2 do bind to different DNA motifs, resulting in altered tran-scriptional profiles, and that infections of mice by PbNK65F versus
PbNK65S result in markedly different host immune responses, one
that is protective and one that is not. Thus, this ApiAP2 is a Pb vir-ulence factor.
RESULTS
The SNP in the DNA binding domain of Pb ApiAP2 alters its sequence specificity
We confirmed by DNA sequencing the presence of the SNP (T in
PbANKA and C in PbNK65-NYU at position 5468) in our laboratory
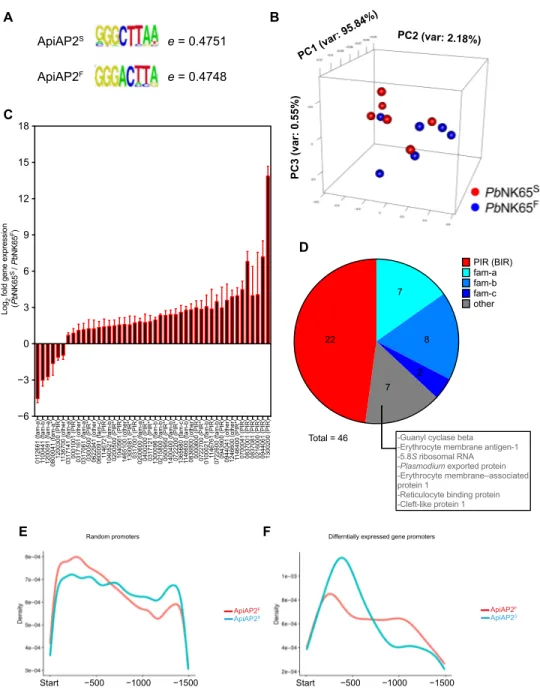
clones of PbANKA and PbNK65-NYU (fig. S1A). We cloned the sequences encoding the first AP2 DNA binding domain of each polymorphic form, expressed the genes in Escherichia coli, purified the proteins, and tested their DNA binding specificity using DNA binding microarrays composed of custom-made DNA sequences. The highest-scoring target DNA motifs for ApiAP2S and ApiAP2F were different: GGGCTTAA and GGGACTTA, respectively (Fig. 1A) (data file S1). To investigate the functional consequences of this ApiAP2 polymorphism, we generated PbNK65 parasites that differed only in the T5468C SNP using CRISPR-Cas9 (fig. S1, B and C). The whole-genome sequence analysis of wild-type (WT) PbNK65 and CRISPR-edited PbNK65 parasites confirmed that the only 10 SNP regions that were consistently different between the two parasites were the target-specific alterations generated by the CRISPR strategy. This included nine silent mutations generated by the guide sequence and one missense mutation, resulting in the desired S-to-F alteration (table S1). SNPs that were observed only in a fraction of reads of the same gene were excluded, as alternate sequences were similarly present in both parasites.
We refer to the PbNK65 strain that carries C at nucleotide position 5468 resulting in an S at amino acid position 1823 in the ApiAP2 protein as PbNK65S and, conversely, the PbNK65 strain that has a T at position 5468 resulting in an F at position 1823 in the ApiAP2 protein as PbNK65F. We infected mice with either PbNK65F or
PbNK65S and carried out an RNA-sequencing (RNA-seq) analysis on
blood drawn from each when parasitemias reached approximately 10% and the distributions of various blood-stage forms were com-parable. A principal components analysis of the data showed that the transcriptomes of the PbNK65S and PbNK65F parasites overlapped (Fig. 1B). However, a detailed RNA-seq analysis showed differential expression of 46 Plasmodium genes, 40 of which were down-regulated in PbNK65F compared to PbNK65S (Fig. 1C). Among these differ-entially expressed 46 genes, 22 belonged to the interspersed repeat (IR) of the Berghei IR (BIR) gene family (Fig. 1D). The Plasmodium IR family (PIR), the largest gene family in Plasmodium, consists of subtelomeric genes that are thought to encode proteins expressed on the infected red blood cell (iRBC) surface and play a major role in antigenic variation in the parasite (20). The RNA-seq data also showed differences in the expression levels of Plasmodium genes belonging to three additional gene families, fam-a (7 of 46), fam-b (8 of 46), and fam-c (2 of 46) (Fig. 1D). These genes, like the BIRs, are expressed predominantly in blood stage and are thought to be exported to the iRBC surface and possibly play roles in invasion, antigenic variation, and immune evasion (14, 21, 22).
We carried out a genome-wide analysis to determine whether the DNA binding motifs of ApiAP2S and ApiAP2F were present in the promoter regions of the differentially expressed genes identified by RNA-seq. Because of high redundancy in the first and the eighth nucleotides of the identified DNA binding motifs (Fig. 1A), we focused on the middle six nucleotides and tested the presence of these two motifs within the promoter regions arbitrarily defined as the 1500 base pairs (bp) before the start site of each gene, in all genes in the Pb genome. This algorithm identified 113 possible binding sites for ApiAP2S and 75 for ApiAP2F in the promoters of the 46 differentially regulated genes (data file S1). Thus, the ApiAP2S motif was in higher frequency as compared to the ApiAP2F motif. Among these 46 genes, 42 contained at least one ApiAP2S or ApiAP2F DNA binding motifs, providing a link between the SNP and the differential regulation of these genes. An in-depth analysis of the promoter regions that contained these motifs showed that although the distri-bution of the two motifs within the promoters of all Pb genes was comparable (Fig. 1E), within the differentially expressed genes, the ApiAP2S motifs tended to be located more proximal to the tran-scription start site as compared to the ApiAP2F motifs (Fig. 1F), suggesting possible differences in transcriptional regulation of these genes by ApiAP2S and ApiAP2F. Together, these analyses provide a link between the presence of the ApiAP2S and ApiAP2F DNA binding motifs in the promoter regions and the differential expression of these genes in PbNK65S and PbNK65F parasites.
PbNK65F parasites are able to complete both the sexual
stages in the mosquito host and the pre-erythrocytic stage in the mouse
We determined whether the PbNK65F parasite was able to complete the full life cycle of the parasite. The cycle begins with the differen-tiation of sexual-stage gametocytes in the mouse host that are taken up in a blood meal by mosquitoes. In the mosquito midgut, the gametes form oocysts that then develop into sporozoites, a highly motile form
on March 10, 2020
http://advances.sciencemag.org/
of the parasite that accumulates in the mosquito salivary glands. The sporozoites are injected into the mouse host as the mosquito takes a blood meal and travel through the blood to the liver where they infect hepatocytes. In the liver, the sporozoites expand and differentiate to merozoites that exit the liver and begin the blood-stage infection, thus completing the life cycle. To determine whether the SNP in ApiAP2 affected the ability of the parasite to complete its life cycle, we devised an experimental model that included the sexual and pre-erythrocytic stages of the Pb infection (fig. S2A). Mice were
infected with PbNK65S or PbNK65F (106 iRBCs intraperitoneally), and once the parasitemia reached approximately 1.2%, mosquitoes were fed on these mice. At 14 days after feeding, a subset of mos-quitoes was dissected and the oocysts in midgut were evaluated both qualitatively (fig. S2B) and quantitatively (fig. S2C). A portion of the remaining mosquitoes were dissected at day 21 after feeding; sporozoites in their salivary glands were harvested and counted (fig. S2D). Sporozoites (5 × 10³) were injected into uninfected mice, and the progression to liver-stage malaria was observed by harvesting
Total = 46 fam-a fam-b fam-c other PIR (BIR) 22 2 7 8 7
-Guanyl cyclase beta -Erythrocyte membrane antigen-1 -5.8S ribosomal RNA -Plasmodium exported protein -Erythrocyte membrane–associated protein 1
-Reticulocyte binding protein -Cleft-like protein 1
01
12661 (fam-a)
11
00441 (fam-b)
1200091 (fam-a) 0800041 (fam-a*)1200300 (PIR) 1136700 (other)0317141 (fam-a)0001001 (PIR) 0317161 (other) 0317061 (fam-a) 0300500 (PIR*) 0622941 (other) 0600091 (fam-c) 11
46721 (PIR)
1040521 (fam-b) 0200500 (PIR*)1040561 (PIR) 1465100 (other) 1300081 (PIR*) 0317001 (PIR) 0200600 (fam-a) 0400200 (PIR*) 0317121 (PIR*) 1300096 (fam-b) 0215800 (fam-b) 0500950 (PIR*) 1400400 (fam-b) 0722200 (PIR*) 1365680 (fam-c) 1146600 (fam-b) 0836800 (other) 0000600 (PIR) 0722700 (PIR*) 0100021 (fam-b)11
46761 (PIR)
0722600 (fam-b)0943900 (PIR) 0944041 (other) 1246600 (other) 11
46400 (PIR*)
0700041 (PIR) 0837001 (PIR) 0837081 (PIR) 0216000 (PIR) 0944061 (PIR) 1300200 (PIR) −6 −3 0 3 6 9 12 15 18 Log 2
fold gene expression
(Pb NK65 S / Pb NK65 F) PC3 (var: 0.55%) PC2 (var: 2.18%) PC1 (var: 95.84%) A B C D E F ApiAP2S ApiAP2F e = 0.4751 e = 0.4748 Start −500 −1000 −1500 Start −500 −1000 −1500 ApiAP2F ApiAP2S ApiAP2F ApiAP2S
Random promoters Differntially expressed gene promoters
Fig. 1. ApiAP2F mutation alters the DNA sequence specificity of the PBANKA_011210 ApiAP2 protein. (A) DNA sequences that received the highest hit in DNA binding microarray analysis of the first domain of ApiAP2S- and ApiAP2F-mutated PBANKA_011210 ApiAP2 proteins. (B to D) PbNK65S or PbNK65F parasites were used to
infect C57BL/6 mice. RNA-seq analysis was carried out from blood samples of infected mice. Principal components analysis (B), genes whose expressions were significantly altered between the two groups (C), and the pie chart representation of multigene families that these genes belong to (D) are shown. Numbers under bar graphs in (C) indicate the gene annotation in (PBANKA_######) format. Gene families for each gene are indicated in parenthesis. Pseudogenes are shown with asterisks. (E and
F) Density graphs showing the relative distribution of the middle hexamer regions of DNA sequences in (A) in the 1500-bp promoter region of randomly sampled (E) or
differentially regulated (F) genes.
on March 10, 2020
http://advances.sciencemag.org/
liver at 46 hours after injection and comparing the parasite levels by quantitative polymerase chain reaction (qPCR) (fig. S2E). None of these parameters showed variation between PbNK65S and PbNK65F. Last, the Plasmodium-infected mosquitoes were fed on uninfected mice, and the progression of disease was observed. While notable experimental variation existed in disease progression either due to the inability to control the inoculum size or due to an unidentified difference in sporozoite function, all infected mice eventually devel-oped blood-stage infection, as confirmed by repeated parasitemia checks (data not shown). These findings indicate that the SNP in
the ApiAP2 does not prevent the completion of the full plasmodium life cycle.
Infection with PbNK65F drives a strong T
H1-type
immune response
To explore the impact of the SNP in ApiAP2 on the outcome of blood- stage infection, we infected mice with either PbNK65S- or
PbNK65F-infected RBCs at 106 parasites per mouse. The hemoglobin
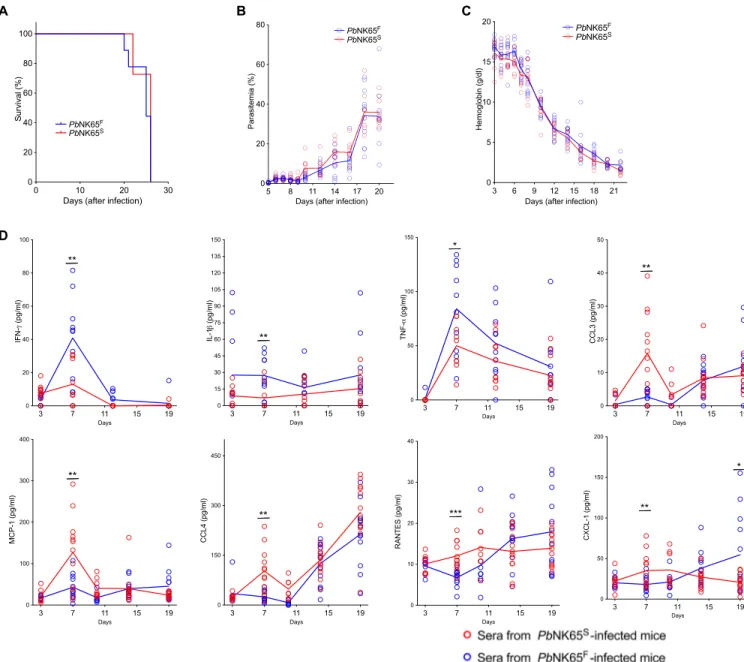
levels, parasitemias, and survival for mice infected with the two dif-ferent parasites were similar (Fig. 2, A to C). All mice died because
D A B C 5 8 11 14 17 20 0 20 40 60 80
Days (after infection)
Parasitemia (%) PbNK65F PbNK65S 3 6 9 12 15 18 21 0 5 10 15 20
Days (after infection)
Hemoglobin (g/dl) PbNK65F PbNK65S 0 10 20 30 0 20 40 60 80 100
Days (after infection)
Survival (%) PbNK65F PbNK65S 3 7 11 15 19 0 150 300 450 Days CCL4 (pg/ml) ** 3 7 11 15 19 0 100 200 300 400 Days MCP-1 (pg/ml ) ** 3 7 11 15 19 0 20 40 60 80 100 Days (pg/ml) ** 3 7 11 15 19 0 15 30 45 60 75 90 105 120 135 150 Days IL-1 (pg/ml) ** 3 7 11 15 19 0 10 20 30 40 50 Days CCL3 (pg/ml) ** 3 7 11 15 19 0 50 100 150 Days (pg/ml) * 3 7 11 15 19 0 10 20 30 40 RANTES (pg/ml) *** 3 7 11 15 19 0 50 100 150 200 Days CXCL-1 (pg/ml) ** * Days
Fig. 2. PbNK65F infection leads to stronger IFN- and TNF- responses in infected mice. (A to C) C57BL/6 mice were infected with either PbNK65F or PbNK65S using
106 iRBCs per mouse delivered intraperitoneally. Changes in survival (A), parasitemia (B), and hemoglobin levels (C) were monitored during the course of infection. Each
circle represents an individual mouse. Data represent three independent experiments each carried out with at least 10 animals per group. (D) Sera collected at different time points of mice infected, as described above. Time-dependent changes in serum levels of various cytokines and chemokines are quantified using a multiplex enzyme-linked immunosorbent assay (ELISA) strategy. Data represent two independent experiments. Each circle refers to a single mouse and lines denote mean values. Statistically significant differences are shown with asterisk (* = 0.01 < P ≤ 0.05; ** = 0.001 < P ≤ 0.01; *** = 0.0001 < P ≤ 0.001). Statistical significance was calculated using Welch’s t test (F)
on March 10, 2020
http://advances.sciencemag.org/
of severe anemia between days 20 and 26 after infection, with para-sitemias between 30 and 60% and hemoglobin levels below 3 g/dl. To characterize the early immune response in PbNK65S- and PbNK65F- infected mice, we collected sera on days 3, 7, 11, 15, and 19 after infection and assayed these for various cytokines and chemokines (Fig. 2D). The serum levels of IFN-, the master enhancer of T helper cell 1 (TH1) differentiation, were higher in PbNK65F-infected mice as compared to PbNK65S-infected mice, peaking on day 7 after in-fection. Similarly, on day 7 after infection, the levels of interleukin-1 (IL-1) and TNF-, cytokines that also enhance TH1 cell differenti-ation, were higher in PbNK65F-infected mice. Conversely, on day 7 after infection, the levels of the proinflammatory regulators and chemoattractants such as CXCL-1, CCL3, CCL4, MCP-1, and RANTES were higher in PbNK65S-infected mice as compared to PbNK65F- infected mice. With time after infection, the levels of CCL4 became equivalent in the two groups of mice and continued to increase through day 19 after infection. For CCL3, MCP-1, RANTES, and CXCL-1, as the infection progressed to day 19 after infection, the level of these cytokines tended to reverse and increased more in PbNK65F-infected mice as compared to PbNK65S-infected mice. Levels of IL-10 and IL-12 p40 were also increased with infection but were not significantly different between the two groups of mice (fig. S3).
Infection with PbNK65F results in a persistent adaptive
immune response
To characterize the immune response to infection by PbNK65F and
PbNK65S, we collected spleens of the mice at day 6, 10, 15, or 19
after infection and quantified the total numbers of germinal center (GC) B cells (Fig. 3A), B cells of the plasma cell (PC) lineage (Fig. 3B), and follicular helper T (TFH) cells (Fig. 3C) using the gating strategy outlined in fig. S3A. The numbers of GC B cells, PC lineage cells, and TFH cells peaked similarly around day 10 to 15 after infection in both PbNK65S- and PbNK65F-infected mice. However, in the late stage of the infection on day 19 after infection, although all three cell populations decreased in numbers in both PbNK65S- and PbNK65F- infected mice, the numbers of GC B cells, PC lineage cells, and TFH cells were significantly higher in PbNK65F-infected mice as compared to PbNK65S-infected mice, indicating a more persistent immune response (Fig. 3, A to C). We also assessed the total number of CD8+ T cells, as well as the numbers of CD8+ effector memory and central memory T cells 10 and 19 days after infection and observed no differences in these numbers in PbNK65S-infected versus PbNK65F- infected mice (fig. S3B).
To determine whether the persistent increases in GC B cells, PC, and TFH in response to PbNK65F infections were dependent on IFN-, we compared responses to infection by either PbNK65S or
PbNK65F in IFN-–deficient mice (IFNKO mice) and WT mice at
day 19 after infection. Although infections with PbNK65S and
PbNK65F (106 parasites per mouse) were fatal in both mouse
strains, we observed differences in the expansion of GC B cells, PC lineage cells, and TFH cells in IFNKO mice as compared to WT mice 19 days after infection. In IFNKO mice, PbNK65F infection resulted in fewer GC B cells, PC lineage B cells, and TFH cells as compared to
PbNK65S infection (Fig. 3, D to F), a reversal of the phenomenon
observed in infection of WT mice (Fig. 3, A to C). Thus, the ability of PbNK65F infections to expand lymphocyte populations was IFN- dependent. In addition, we observed differences in the mag-nitude of the expansion of cells in WT versus IFN- knockout (KO) mice (Fig. 3, D to F) that may be explained by the
immunomodula-tory role of B cell–intrinsic IFN- signaling as recently shown by Guthmiller et al. (23).
The splenic architecture has been shown to be disrupted in the acute blood stage of malaria, primarily due to a combination of the burden of iRBC in the spleen and erythropoiesis (24–26). We carried out a histopathological evaluation of spleens taken from
PbNK65S- and PbNK65F-infected mice. On day 10 after infection,
the spleens of PbNK65S- and PbNK65F-infected mice were similar with well-organized B cell follicles, as visualized by double staining with CD4- and B220-specific antibodies (Fig. 4, A and C). Numerous peanut agglutinin (PNA)–stained GC foci with proliferative activity (Ki-67+) were also present in mice infected with PbNK65S and PbNK65F. However, at the late stage of infection, 19 days after infection, sig-nificant disruption of the B cell follicle structure was observed in
PbNK65S-infected mice with no visible B-T organization, no
typi-cal GCs, and no proliferative activity (Fig. 4, B and C). In contrast, in PbNK65F-infected mice, B-T organization, GCs, and prolifera-tive activity persisted, consistent with the flow cytometry data indi-cating a prolonged cellular response (Fig. 4, B and C).
Having observed a more persistent GC B cell and PC response in PbNK65S-infected versus PbNK65F-infected mice, we measured the levels of total and iRBC-specific immunoglobulin M (IgM) and IgG at days 7 and 19 after infection (Fig. 5A). The sera obtained on days 7 and 19 after infection showed similar levels of total IgM in PbNK65S- and PbNK65F-infected mice (Fig. 5A). However, on day 19 after infection, the levels of total IgG were significantly higher in the PbNK65F-infected mice compared to PbNK65S-infected mice (Fig. 5A). We also measured the levels of IgM and IgG that bound to lysates of uninfected RBCs or to lysates prepared from either
PbNK65F- or PbNK65S-infected RBCs. Antibody reactivity against
uninfected RBC lysate was observed, indicating a degree of autore-activity consistent with earlier reports (fig. S4A) (27, 28). However, the levels of uninfected RBC binding antibodies were around 1/
5 to 1/
10 of the level of iRBC binding antibodies. We subtracted the values obtained from uninfected RBC lysate–coated wells from the values acquired from the corresponding iRBC lysate–coated wells and presented these values (Fig. 5, B to G). The levels of iRBC- specific IgM were similar between mice infected with PbNK65S or PbNK65F on both days 7 and 19 after infection (Fig. 5B). In con-trast, the iRBC-specific IgG was significantly higher on day 19 after infection (but not on day 7 after infection) in PbNK65F-infected mice as compared to PbNK65S-infected mice regardless of the source of the iRBC lysate (Fig. 5C). The higher total levels of iRBC-specific IgG reflected increases in the levels of IgG2b (Fig. 5E) and IgG2c (Fig. 5F) but not of IgG1 (Fig. 5D) or IgG3 (Fig. 5G), indicating a predominant TH1-type immune response to the PbNK65F parasites, consistent with the observation of an early TH1-type inflammatory response. Differences in anti-iRBC antibody levels between PbNK65F- and PbNK65S-infected mice may reflect increases in antibodies against the same parasite target molecules and/or differential ex-pression of immunogenic molecules between the parasite strains, leading to different antibody repertoires.
Reduction in parasite burdens in PbNK65F infections, but not
in PbNK65S infections, allows development of
protective immunity
Having observed that lethal infection of mice with PbNK65F resulted in immune responses late in the infection just before death of the mice, we determined whether reducing the parasite burden during
on March 10, 2020
http://advances.sciencemag.org/
the initial infection would allow protective immunity to fully develop in PbNK65F-infected mice and promote survival. We reduced the parasite burden by either treating infected mice with a nonsterilizing dose of chloroquine (Fig. 6, A to D) or by reducing the parasite inoculum (Fig. 6, E to G).
For chloroquine-mediated reduction in parasite load, as depicted (Fig. 6A), mice were infected with either PbNK65S or PbNK65F, the infections were allowed to progress for 8 days, and parasitemias were quantified by flow cytometry and confirmed blood smears. At day 8 after infection, mice were randomly divided into two groups
Day 6 Day 10 Day 15 Day 19 0 6 6 6 × 10 4 × 10 2 × 10 8 × 10 6 × 10 4 × 10 2 × 10 2.0 × 10 1.5 × 10 1.0 × 10 5.0 × 10 6 Number of GC cell s ***
Day 6 Day 10 Day 15 Day 19 0
6 6 6 6
Number of PC lineage cell
s
**
Day 6 Day 10 Day 15 Day 19 0.0 5 6 6 6 Number of Tfh cell s *** CXCR5 PD1 CD138 B220 CD95 GL7
10 days p.i 19 days p.i
PbNK65S PbNK65F PbNK65S PbNK65F A B C D E F 0.0 5 6 1.5 × 10 1.0 × 10 5.0 × 10 1 × 10 2.5 × 10 2.0 × 10 1.5 × 10 1.0 × 10 5.0 × 10 5 × 10 6 Number of cell s * *** IFN- KO WT **** 0 6 7 Number of cell s * ** IFN- KO WT **** 0.0 4 5 5 5 5 Number of cells **** **** IFN- KO WT **** **** Germinal center B cells Plasma cell lineage cells Follicular helper T cells
Fig. 3. PbNK65F-induced IFN- is linked to formation of stronger adaptive immune responses. (A to C) C57BL/6 mice were infected with either PbNK65F or PbNK65S
using 106 iRBCs per mouse delivered intraperitoneally. Spleens were harvested at different time points, and GC B cells within the B cell gate (A), plasma cell (PC) lineage
cells within the splenocyte gate (B), and TFH within the TH gate (C) are analyzed in flow cytometry. Representative flow cytometry plots (left) and bar graphs of actual cell
numbers (right) are shown for each cell type. Data are pooled from four independent experiments. p.i., post-infection. (D to F) Age- and sex-matched IFN- KO and WT (C57BL/6) mice were infected side by side with either PbNK65F or PbNK65S as outlined above. Mice were sacrificed at day 19 after infection, and their spleens were
analyzed. Each circle represents an individual mouse. Bars indicate the mean values. Statistical significance was calculated using Welch’s t test (A to C) or one-way analysis of variance (ANOVA) with Sidak’s multiple comparison test (D to F). Significant values are shown with asterisks (* = 0.01 < P ≤ 0.05; ** = 0.001 < P ≤ 0.01; *** = 0.0001 < P ≤ 0.001).
on March 10, 2020
http://advances.sciencemag.org/
that were either left untreated or treated daily for 8 days with the anti-malarial chloroquine at nonsterilizing doses. Survival and par-asite levels were followed until day 75 after infection. In the absence of chloroquine, the parasite levels increased in both PbNK65S- and
PbNK65F-infected mice, reaching high levels (Fig. 6B), resulting in
the death of all the mice by day 23 (Fig. 6C). The 8-day chloroquine treatment reduced the parasitemia to nearly undetectable levels in both PbNK65S- and PbNK65F-infected mice (Fig. 6B). Once the daily chloroquine treatment was stopped, on day 16 after infection, recrudescent parasitemias were not controlled in most PbNK65S- infected mice and reached high levels (Fig. 6B), resulting in the death of 80% of the mice by day 40 after infection (Fig. 6C). In con-trast, most PbNK65F mice controlled the recrudescent parasitemia, maintaining it at low levels (Fig. 6B), resulting in survival of over 90% of these mice (Fig. 6C).
To determine whether PbNK65F-infected, chloroquine-treated mice that survived developed protective immunity, in a parallel ex-periment, we challenged a group of the surviving mice, which were free of parasite as confirmed by blood smear at day 37 after infection, with either PbNK65F or PbNK65S parasites (Fig. 6D). Age-matched mice that did not receive the first infection but were treated or not with chloroquine served as controls (Fig. 6D and fig. S4B). All infected control mice died by day 27 after infection (Fig. 6D). In contrast, 100% of mice that survived the first infection by PbNK65F following chloroquine treatment survived the challenge infection with
PbNK65F and 60% were protected against challenge with PbNK65S.
Repeated experiments confirmed these findings despite slight alter-ations in the duration of chloroquine treatment required to suffi-ciently limit parasitemia. Thus, PbNK65F infections in which the parasite burden was reduced resulted in complete protection against
H & E B220 / CD4 PNA / IgM Ki-67
Day 10 p.i. Day 19 p.i. A B Pb NK65 F Pb NK65 S Pb NK65 F Pb NK65 S C
Fig. 4. Infection with PbNK65F causes more persistent GC response and less disruption in splenic architecture. Mice were infected as outlined in Fig. 2. Spleens harvested at different time points were stained with hematoxylin and eosin (H&E) to show overall splenic structure, B220/CD4 to localize follicles, PNA/IgM to point out the GC foci, and Ki-67 to determine the proliferation activity in GCs. Representative spleen sections belonging to either PbNK65S parasite– or PbNK65F parasite–infected
mice are shown for day 10 (A) and day 19 (B). Arrowheads and dashed circles indicate GC foci and proliferative activity, respectively. (C) Histopathologic evaluation of the spleen samples taken on days 6, 10, 15, and 19 after infection of mice with either PbNK65S or PbNK65F and processed as described above. At least two mice were evaluated
per group per day. p.i., postinfection.
on March 10, 2020
http://advances.sciencemag.org/
challenge with PbNK65F and partial protection to the highly related
PbNK65S strain.
We reduced the parasite burden by reducing the parasite inoculum (Fig. 6, E to G). We first titrated the dose of iRBC from 106 to 101 in 10-fold increments to determine whether there was a dose of iRBCs at which PbNK65F-infected mice survived and PbNK65S- infected mice did not. We found that this occurred at a dose of 102 iRBCs per mouse and that, above this dose, both infections were lethal and, below this dose, mice survived both infections. At a dose of 102 iRBC per mouse, 70% of the PbNK65F-infected mice did not develop detectable levels of parasitemia (Fig. 6E), and these mice survived the infection (Fig. 6F). In contrast, all of the PbNK65S- infected mice developed parasitemias (Fig. 6E), and none of these mice survived. Thus, mice were able to mount a protective response against the PbNK65F parasites but not against PbNK65S. Moreover, survival of the PbNK65F infection was dependent on IFN-, as in IFNKO mice, parasitemias were not controlled in PbNK65S and
PbNK65F infections and all mice died (fig. S4C). This finding is
consistent with the observation that PbNK65F infections resulted
in higher IFN- responses as compared to PbNK65S infections at day 7 after infection.
To ensure that the differential progression of disease between
PbNK65F- and PbNK65S-infected mice was dependent on the
adap-tive immune response and not due to intrinsic growth properties of the parasites, we infected WT mice and mice deficient in RAG-2 (RAG-2KO) that lacked an adaptive immune system. In RAG-2KO mice, the parasitemias in PbNK65S and PbNK65F infection pro-gressed similarly to high levels (Fig. 6G). Thus, the ability to control parasitemia in the low-inoculum PbNK65F infection was lost in RAG-2KO mice.
DISCUSSION
Malaria continues to be a serious global health problem, affecting over 200 million people each year and causing over 400,000 deaths annually in Africa alone (29). At present, we do not have an effective malaria vaccine and a clear understanding of the genetic factors that govern Plasmodium virulence would likely contribute to development
0.0 5 6 6 6 IgG (ng/ml) Day 7 Day 19 n.s. * 0 2000 4000 6000 8000 10,000
IgM anti-NK65 (AU)
Day 7 Day 19 Day 7 Day 19
n.s. n.s. n.s. n.s. PbNK65 -S infected RBC lysate PbNK65 -F infected RBC lysate 0.0 5.0 × 10 2.5 × 10 2.0 × 10 2.0 × 10 1.5 × 10 1.0 × 10 5.0 × 10 1.5 × 10 1.0 × 10 5 6 6 6 6 Ig M (ng /m l) Day 7 Day 19 n.s. n.s. 0 500 1000 1500 2000
IgG anti-NK65 (AU)
Day 7 Day 19 Day 7 Day 19
n.s. ** *** n.s. PbNK65 -S infected RBC lysate PbNK65 -F infected RBC lysate 0 500 1000 1500 2000 2500
IgG1 anti-NK65 (AU)
Day 7 Day 19 Day 7 Day 19
n.s. n.s. n.s. n.s. PbNK65 -S infected RBC lysate Pb - NK65 -F infected RBC lysate 0 2000 4000 6000
IgG2b anti-NK65 (AU)
Day 7 Day 19 Day 7 Day 19
n.s. * ** n.s. PbNK65 -S infected RBC lysate PbNK65 -F infected RBC lysate 0 5000 10,000 15,000 20,000
IgG2c anti-NK65 (AU)
Day 7 Day 19 Day 7 Day 19
n.s. ** *** n.s. PbNK65 -S infected RBC lysate PbNK65 -F infected RBC lysate 0 1500 3000 4500
IgG3 anti-NK65 (AU)
Day 7 Day 19 Day 7 Day 19
n.s. n.s. n.s. n.s. PbNK65 -S infected RBC lysate PbNK65 -F infected RBC lysate A B C D F G E
Fig. 5. PbNK65F infection leads to a stronger T
H1 type immune response. (A to G) C57BL/6 mice were infected with either PbNK65F or PbNK65S as described in Fig. 2. Sera were collected at days 7 and 19 after infection and were assayed for total IgM and IgG (A) using ELISA kits. Parasite-specific IgM (B), IgG (C), IgG1 (D), IgG2b (E), IgG2c (F), and IgG3 `(G) were quantified on ELISA plates coated with iRBC lysates of WT parasite– or mutant parasite–infected mice. Arbitrary units (AU) were calculated using a titration curve generated by serially diluting a mixture of serum samples as explained in Materials and Methods. n.s. = P > 0.05; * = 0.01 < P ≤ 0.05; ** = 0.001 < P ≤ 0.01; *** = 0.0001 < P ≤ 0.001 (Welch’s t test).
on March 10, 2020
http://advances.sciencemag.org/
of a vaccine. Here, we provided evidence that a single SNP in the AP2 DNA binding domain of the TF ApiAP2 is a virulence factor in the mouse malaria parasite PbNK65. Mice are not able to mount a protective immune response to PbNK65S parasites and develop high parasitemias and die even at low-inoculum infections (100 par-asites per infection). In contrast, PbNK65F infections induce an early IFN- response and a later expansion of GC B cells, PCs, and TFH cells, resulting in high levels of iRBC-specific TH1-type IgG2b and
IgG2c antibodies. The expansion of B cells, PCs, and TFH and the ability to survive low-inoculum infections are IFN- dependent, as shown in IFN-KO mice.
In terms of possible mechanisms by which expression of ApiAP2F confers the ability of PbNK65F to induce a protective immune re-sponse, we showed that the nonsynonymous SNP altered the target DNA sequence of ApiAP2F, resulting in the differential expression of 46 Pb genes in the blood-stage infection. Although the individual
Infection Day 0 .... Days 8–16 Treatment Observe 0 10 20 30 40 50 60 70 0 10 20 30 40 50 60 70 80 90 100
Days (after infection)
Survival (% ) 5 7 9 11 13 15 17 19 21 23 25 27 29 31 33 35 0 20 40 60 80
Days (after infection)
Parasitemia (%) PbNK65S + CQ (d8–16) PbNK65F + CQ (d8–16) PbNK65S + No Tx PbNK65F + No Tx 5 10 15 20 25 30 35 0 0 10 20 30 40 50 60 70 80 90 100
Days (after infection/re-infection)
Survival (% ) A B C E F G D 0 10 20 30 40 0 20 40 60 80 Days Parasitemia (% ) PbNK65S PbNK65F 8 13 18 23 28 33 0 20 40 60 80 Days Parasitemia (% ) PbNK65S PbNK65F 0 20 40 60 0 10 20 30 40 50 60 70 80 90 100
Days (after infection)
Survival (%
)
PbNK65S
PbNK65F
102 parasites per mouse inoculum
106 parasites per mouse inoculum
Day 37 PbNK65S + CQ (d8–16) PbNK65F + CQ (d8–16) PbNK65S + No Tx No infection CQ PbNK65F + No Tx
Fig. 6. The SNP affects the disease progression and formation of immunologic memory in infected mice. (A to D) C57BL/6 mice were infected with 106 iRBCs
(intraperitoneally) coming from either PbNK65F- or PbNK65S-infected donors. A group of mice were treated with chloroquine (10 mg/kg) daily between days 8 and
16 after infection, after which the treatment was ceased and disease progression was observed. The experimental design is illustrated in (A). Progression of parasitemia (B) and Kaplan-Meier survival curve (C) for the initial infection are shown. (D) In a parallel experiment, some of the surviving mice (after being confirmed as parasite free by blood smear) were re-infected on day 37 and observed until day 80. Kaplan-Meier survival chart (left) of the groups of mice that were infected 106 iRBCs
(intra-peritoneally) as outlined in the table (right) is shown. (E to G) C57BL/6 (E and F) or RAG-2 KO (G) mice were infected with 102 iRBCs (intraperitoneally) taken from
either PbNK65S- or PbNK65F-infected donors. The parasitemia (E) and survival (F) curves of infected C57BL/6 mice and parasitemia curves of infected RAG-2 KO mice are
shown. Data represent two independent experiments each carried out with 10 to 15 mice per group. Circles refer to individual mice.
on March 10, 2020
http://advances.sciencemag.org/
functions and expression patterns of these genes are largely unknown, comparative genomic analyses predict expression on the RBC surface and thus involvement in host-pathogen interactions (14, 20). Twenty- two of the 46 differentially expressed genes are members of the BIR/ PIR family that are thought to play an important role in antigenic variation on the iRBC surface. The expression of ApiAP2F resulted in the down-regulation of the transcription of the majority of these genes in PbNK65F infection. Thus, our data suggest that these BIR genes may play a role in either suppressing or evading the immune response in PbNK65S infections. Spence et al. (30) recently provided evidence that vector transmission intrinsically modified the asexual blood-stage infection of P. chabaudi chabaudi, resulting in an en-hanced, protective immune response in mice. The attenuated viru-lence of vector-transmitted P. chabaudi chabaudi was associated with increased expression of members of the CIR/PIR family. Thus, in this case, the PIR genes appear to be a target of the immune response. The role of these gene families in parasite virulence will require a better understanding of their function and expression.
Our results suggest that ApiAP2S expression is beneficial to the parasite in preventing protective immune responses in the infected host. The ApiAP2S SNP is highly conserved in ApiAP2 orthologs in almost all Plasmodium strains, including the human parasite
P. falciparum. Moreover, the target DNA sequence we report here
for domain 1 of ApiAP2S is also conserved in the AP2 domain of the
P. falciparum ortholog, namely, PF3D7_0613800 (15), suggesting that
the conservation of this SNP is due to the immune invasion benefit it confers on the parasite.
Conversely, ApiAP2F expression is presumably deleterious to the parasite, as its expression evokes a parasite-specific immune response in the host. Nevertheless, ApiAP2F is encoded in at least two strains of Pb (19). It is of interest that whole-genome sequencing of multi-ple laboratory Plasmodium strains showed that parasite strains that differed in approximately 20 SNPs in their entire coding regions, in-cluding in the ApiAP2 SNP described here, had dramatically differ-ent outcomes in infection, resulting in severe anemia versus cerebral malaria (14). Understanding the relationship of the immune response to parasites expressing ApiAP2F in different parasite backgrounds and disease pathology will be of interest.
In conclusion, through in-depth functional characterization, we identify the ApiAP2 PBANKA_011210 as an important regulator of the Pb immune evasion machinery. To our knowledge, this is not only the first report of a role for any ApiAP2 family member in a mammalian host-pathogen interaction but also the first character-ization of a functional role for an essential ApiAP2. The approach described here may facilitate functional characterization of other essential members of the ApiAP2 family for which KO parasites are not viable.
MATERIALS AND METHODS
Mice and reagents
For all animal experiments, age-matched, 7- to 9-week-old female mice were used. C57BL/6 mice were purchased from The Jackson Laboratory. RAG-2 KO and IFN- KO mice were purchased Taconic Farms. Mice were maintained at the National Institute of Allergy and Infectious Diseases animal facility according to Animal Care and Use Committee Standards.
Fluorescent-conjugated monoclonal antibodies against mouse CD45 [allophycocyanin (APC)], Ter119 (APC-Cy7), CD19
[phyco-erythrin (PE)–Cy7], B220 (AF700), CD138 (PE), CD4 (BV605), CXCR5 (BV421), PD-1 (PE), CD8 (BV785), CD44 (AF700), and CD62L (PE-Dazzle 594) were purchased from BioLegend. Anti- mouse GL7 (e660) and CD95 (Percp-e710) were purchased from Thermo Fisher Scientific. Dead cells were excluded from flow cy-tometry analyses using a LIVE/DEAD Near-IR dye (Thermo Fisher Scientific). Horseradish peroxidase (HRP)–conjugated antibodies against mouse IgG, IgG1, IgG2a, IgG3, and IgM were purchased from Jackson ImmunoResearch. HRP-conjugated anti-mouse IgG2c was purchased from SouthernBiotech. Chloroquine used in in vivo experiments were purchased from Sigma and used at a dose of 10 mg/kg (intraperitoneally).
Infection of mice with parasitized RBCs
Parasites were grown from frozen infected RBC stocks in donor C57BL/6 mice. Peripheral blood parasitemia was checked using both blood smears and a flow cytometry–based strategy described else-where (31). Once parasitemia in donor mice reached a 5 to 10% range, blood drawn from the donor was diluted in phosphate-buffered saline (PBS) and injected to the experimental mice (intraperitoneally) at 106 infected RBC per mouse unless otherwise noted. To avoid gradual changes in virulence by repetitive passaging of parasite, stocks prepared from comparable passage numbers were used. Pro-gression of the blood-stage disease was monitored in the experimental mice by routine parasitemia checks as described above.
Construction of plasmid for editing AP2 (PBANKA_011210) in Pb NK65NYU
For editing the AP2 (PBANKA_011210) gene in Pb NK65NYU, re-placing serine-1823 with phenylalanine (S1823F), we used the CRISPR-Cas9 system (32). A guide sequence of 20 nucleotides (5′-GCTGAATTAAAACCCCAAAG-3′), with protospacer adjacent motif (5′-AGG-3′), was selected by manual curation for targeting the Cas9 endonuclease to result in the desired editing (5467 TCT to TTT) in the AP2 gene. The 900 nucleotides of synthetic sequence (given in supplementary information 2) with the mutated guide region and the desired SNP (5467 TCT to TTT) were subcloned in the pYC plasmid using Nco I and Xho I restriction enzyme sites. The resulting plasmid, pYC_NK65AP2ANKA, was used for the trans-fection of the Pb NK65NYU parasites.
Transfection of the Pb NK65NYU parasites
The Pb transfections were done as described earlier (33, 34). Briefly, a BALB/c mouse was infected with freshly revived frozen stock of
Pb NK65NYU parasites. Two naïve BALB/c mice were injected
in-traperitoneally with the infected blood from the donor mouse (two to three drops of ~10% parasitemia). The mice were sacrificed once the parasitemia reached ~5%, and the parasites were allowed to develop in vitro to the mature schizont stage in RPMI 1640 with l-glutamine, 25 mM Hepes, and hypoxanthine (50 g/ml;
KD Medical, Columbia, MD), 28 ml of 7.5% sodium bicarbonate (KD Medical, Columbia, MD), and gentamicin (10 g/ml; Gibco, Thermo Fisher Scientific, Grand Island, NY) supplemented with 20% fetal bovine serum. The mature schizont stage parasites were purified using Percoll purification method. The purified schi-zonts were washed twice with RPMI 1640 solution (KD Medicals, Columbia, MD). The schizonts (106 to 107) were then resuspended in 100 l of the Nucleofector solution prepared from Amaxa Basic Parasite Nucleofector Kit 1 (Lonza, USA) containing 10 g of the
on March 10, 2020
http://advances.sciencemag.org/
pYC_NK65AP2ANKA plasmid. The resuspended schizonts were transfected with Nucleofector II (Lonza, USA) using the program U33. The transfected parasites were mixed immediately with 100 l of RPMI 1640 solution and injected intravenously in a naïve BALB/c mouse. The drug-resistant parasites were selected with pyrimeth-amine (0.7 mg/ml) and dissolved in the drinking water against the human dihydrofolate reductase selection marker in the transfected plasmid. The pyrimethamine treatment was continued for 1 week, and the drug-resistant parasites were screened for the presence of the desired SNP by DNA sequencing. The clonal parasite was gen-erated by injecting 20 BALB/c mice with one parasite per mouse. The parasites were allowed to grow without pyrimethamine pres-sure. Once visible in the Giemsa smears, the parasites were passaged three times through C57BL/6 mice for the final study of the SNP in AP2. The WT NK65NYU parasites were also cycled in the BALB/ c and C57BL/6 mice just like the edited parasites for comparative study.
Confirmation of editing in the AP2 gene (PBANKA_011210) of NK65NYU parasites by DNA sequencing
After the appearance of pyrimethamine-resistant parasites, the intro-duction of SNP in the AP2 gene of NK65NYU was confirmed by DNA sequencing. The genomic DNA from the AP2-mutated NK65NYU (PbNK65F) parasites was amplified with the following primer pair outside the 900-bp homology arm: AP2F (5′-GATTATAGATACA-AATAATGAGAAAATGGG-3′) and AP2R (5′-GCATATGTGATAG-TGTTATTTCCATC-3′). The introduction of the SNP was confirmed with two sequencing reactions performed using internal primers, one in forward (primer AP2Seq1, 5′-CAATTATAATAATTTGAATGAA-GGGGAAC-3′) and another in reverse direction (primer AP2Seq2, 5′-GAGTAATCAAGAATCTCAAAATTGTGAT-3′).
To detect sequence inconsistencies between WT and CRISPR- modified samples, whole-genome sequencing was performed on TruSeq Nano (Illumina Inc.) paired-end libraries prepared from two WT (WT 81 and WT 83) and two mutant (AP2 76 and AP2 77) samples. Libraries were sequenced to a mean coverage of 172× on the NextSeq instrument using a 2× 150-cycle kit (Illumina Inc.).
Raw image files were converted to fastq files using bcl2fastq (v2.20.0.422, Illumina Inc., San Diego, CA), trimmed of adapter sequences, and quality-filtered for a minimum base quality score of 20 using cutadapt (v 1.12) (35) and FASTX (v 0.0.14) tools. Quality- trimmed reads were mapped to the Pb NK65e reference genome (assembly GCA_900088445.1) using Bowtie2 (version 2.2.9) (36). Bowtie2 default settings were used, with unpaired and discordant alignments suppressed. Reads were also mapped to mouse ref-erence GRCm38/mm10 to assess contaminating mouse se-quences. SAM files were converted to coordinate-sorted BAM files using SAMtools (37). Sequence read statistics are shown in table S1.
Duplicate reads were marked using Picard’s MarkDuplicates tool (v 2.18.7) (38), and variants were detected in multisample mode using SAMtools and BCFtools packages with -ploidy 1 (37). In SAMtools, --redo-BAQ was enabled in mpileup. SNPs and INDELs were extracted into separate VCF files using GATK SelectVariants, and then each VCF file was filtered for depth and quality using vcftools (v 0.1.15) and –min-meanDP 10 and –minQ 200 param-eters. The filtered multisample vcf file was annotated using SNPeff (39). Variants were also detected using GATK HaplotypeCaller and Freebayes, which yielded similar results.
Variants detected in the same position across all four samples, due to differences from the NK65e reference genome, were removed from further analysis. INDEL calls were concordant across all four samples, indicating that there were no differences in WT and mutant genomes. Raw sequences were submitted to the National Center for Biotechnology Information (NCBI) Sequence Read Archive database (accession no.: PRJNA548804).
Protein binding microarrays
Each Pb AP2 domain was PCR-amplified from Pb genomic DNA and cloned into the pGEX-4T1 vector (GE Healthcare) using Bam HI and Xho I restriction sites to create a gene fusion resulting in an N-terminal glutathione S-transferase (GST)–tagged recombinant protein. Protein expression was induced with 0.2 mM isopropyl-
-d-thiogalactopyranoside (IPTG) at 37°C for 4 hours in
BL21-Co-donPlus(DE3)-RIL cells (Agilent Technologies). Protein purification was carried out using Glutathione-Superflow Resin (Clontech), as previously described (15) and verified by Coomassie blue staining.
Purified recombinant proteins were run on protein binding micro-arrays (PBMs) to assess DNA binding activity, as previously described (15). Briefly, custom DNA microarrays (Agilent Technologies) were double-stranded, incubated with GST-tagged recombinant protein, incubated with Alexa 488–conjugated anti-GST antibody (Thermo Fisher Scientific, A11131), and scanned using an Axon 4300A scanner (Molecular Devices). Enrichment scores and position weight matrices (PWMs) were generated using seed-and-wobble algorithms from an earlier publication (40). Scores greater than 0.45 were considered significant and indicate specific binding.
Each GST-tagged protein was run on two PBM versions: AMADID 016060 (v9) and AMADID 015681 (v11). Each version contains the same oligonucleotide probes in a different order. PWMs from the two arrays were combined to generate the final results (data file S1).
Analysis of PWMs generated by in vitro PBMs was used to scan
Pb promoter regions. First, PWMs were trimmed to their six most
informative base pairs, or their core motifs. PlasmoDB version 34 (41) of the Pb ANKA reference genome and gene annotations were downloaded and used to generate promoters of 1500 nucleotides in length. Promoters were defined as 1500 bp upstream of the translation start site (ATG) of protein-coding genes only. These promoter regions were then scanned using FIMO version 4.12.0 (42) and a motif hit significance threshold of 0.001. Data analysis was performed in R version 3.4.1 (https://www.r-project.org). Analysis code is available at https://github.com/pzross/pberghei_ ap2mutant.
Pb infection of mosquitoes
Anopheles stephensi female mosquitoes (5 to 6 days old) were infected
with Pb by feeding on anesthetized infected C57BL/6 mice. The in-fectivity of the mice was established by determining the parasitemia in a blood smear. In all the studies, mice having parasitemias be-tween 1 and 3% parasitemia were used to infect mosquitoes. Blood- fed infected mosquitoes were kept at 20°C and 80% humidity. Pb midgut infection was quantified by light microscopy 11 days after blood feeding with mercurochrome staining (0.1% in water). Sporozoite load was determined in salivary glands 21 days after blood feeding. The salivary glands of mosquitoes were dissected in PBS, and pools of 9 or 10 pairs of glands were homogenized by passaging through a
on March 10, 2020
http://advances.sciencemag.org/
27-gauge needle 15 times. Sporozoites were counted under the micro-scope in a hemocytometer.
ELISA and serum cytokine analyses
To measure the relative amount of antibodies specific to parasite antigens, infected animals were bled at day 19 after infection. Blood was collected in anticoagulant tubes, spun down, washed with PBS, and then resuspended in approximately 4 ml of PBS. This solution was slowly added on top of a double Percoll gradient containing 40% Percoll (top) and 72% Percoll (bottom). Following ultracentrifugation, the middle layer containing enriched infected RBCs was harvested. Percoll was removed by washing the RBCs with RPMI mixed with 10× PBS at 10:1 and 20:1 ratios and RPMI alone for the first-second and third washes, respectively. iRBCs were pelleted and lysed in a buffer containing 100 mM tris (pH7.4), 150 mM NaCl, 1 mM phenylmethylsulfonyl fluoride, 1 mM EDTA, 1% Triton X-100, 0.5% sodium deoxycholate, and protease in-hibitor cocktail (Roche) for 20 min on ice. Lysed cells were diluted with equal amount of PBS at the end of the procedure. For control group, RBCs from uninfected mice were harvested and lysed simi-larly. PBS solution containing 1:400 dilution of lysed RBC was used to coat Nunc Maxisorp enzyme-linked immunosorbent assay (ELISA) plates (Thermo Fisher Scientific). Upon overnight incu-bation at 4°C, plates were washed and blocked with bovine serum albumin–containing solution. Diluted sera harvested from infected animals were added to the wells followed by washing and incu-bation with HRP-conjugated secondary antibodies. Plates were developed using trimethylboron (TMB) solution, and reaction was terminated using 0.16 M H2SO4 solution. Plates were read at an op-tical density of 450 nm using a SpectraMax plate reader (Molecular Devices). Arbitrary units were calculated using a standard curve generated by applying serial dilutions of a mixed serum sample onto infected RBC lysate–coated wells.
Cytokine levels in sera of the infected animals were measured using relevant LEGENDplex kits (BioLegend) according to the manu-facturer’s guidelines.
Flow cytometry and histopathologic evaluation
For flow cytometry, samples were stained in Hanks’ balanced salt solution supplemented with 2% fetal calf serum, 1% Hepes, and 10 mM sodium azide (Sigma-Aldrich). Analyses were carried out using a BD LSR-2 or a BD X20 cytometer. Data analysis was carried out using FlowJo software. Gating strategy for identifying different cell sub-sets was adapted from a previous study (43).
For histopathologic evaluation, spleens from infected mice were harvested at various time points after infection and immediately fixed in 10% formalin solution followed by embedding into paraffin. Tissue sections were either hematoxylin and eosin–stained or immunostained following a previously described protocol (44).
Quantitative reverse transcription PCR
Parasite loads in livers of sporozoite-injected (5 × 10³ sporozoites per mouse, intravenously) mice were measured 45 hours after injection. Livers were flushed under anesthesia, and liver specimens were im-mediately frozen in liquid nitrogen. Livers were homogenized in RLT buffer using 2.3-mm zirconia/slica beads (Biospec) under agitation in a Biospec bead beater. Homogenate was further passed through QIAShredder (Qiagen) columns, and RNA was isolated using the RNeasy Plus Mini Kit (Qiagen) according to the manufacturer’s
guidelines. Complementary DNA (cDNA) synthesis was carried out using the iScript cDNA Synthesis Kit (Bio-Rad). qPCR was carried out using the IQ SYBR Green Kit (Bio-Rad). Pb 18S was amplified using two sets of primers: set 1 (5′-ATTAATCTTGAACGAG-GAATGGCT-3′ and 5′-TCAATCGGTAGGAGCGACG-3′) and set 2 (5′-AAGCATTAAATAAAGCGAATACATCCTTAC-3′ and 5′-GGAGATTGGTTTTGACGTTTATGTG-3′). Three housekeeping genes murine HPRT (5′-TGCTCGAGATGTGATGAAGG-3′ and 5′-TCCCCTGTTGACTGGTCATT-3′), murine GAPDH (5′-GTG-GAGTCATACTGGAACATGTAG-3′ and 5′-AATGGTGAAGGTC-GGTGTG-3′), and murine PPIA (5′-TTCACCTTCCCAAAGAC-CAC-3′ and 5′-CAAACACAAACGGTTCCCAG-3′) were used for normalization. Delta Ct values were calculated by subtracting the geometric mean of Ct values of the three housekeeping genes from the Ct value of 18S for each sample.
RNA sequencing
For RNA sequencing, 250 l of purified mouse cheek blood cells was mixed with 750 l of Trizol LS (Thermo Fisher Scientific) and RNA was isolated according to the manufacturer’s recommendations.
Twelve samples each containing 4 g of total RNA were treated with the Globin-Zero Gold rRNA Removal Kit (Illumina Inc.) fol-lowed by TruSeq mRNA Sequencing Library Preparation (Illumina Inc.). The resulting single-indexed libraries were fragment-sized on a Bioanalyzer DNA1000 chip and quantitated using a Kapa Library Quant kit (Illumina) and Universal qPCR mix (Roche) to facilitate the creation of a normalized, 2 nM multiplexed pool. This multi-plexed pool was clustered across two lanes of a RAPID flow cell at a concentration of 10 pM, followed by paired-end sequencing on an Illumina HiSeq 2500 for 100 cycles from each fragment end plus an additional 7 cycles to sequence the index.
Raw next generation sequencing (NGS) reads were processed by first removing any Illumina adapter sequences using Cutadapt v1.12 (35) and then trimmed and filtered for quality and length (min-imum length of 35 bp) using FastX Tool Kit v0.0.14 (Hannon Lab, Cold Spring Harbor Laboratory). Trimmed reads for each replicate were then mapped using Hisat2 v2.0.5 (45) set to report only matched pairs. Final transcripts based on the combined replicates and then differentials for each comparison were generated using Deseq2 (10.18129/B9.bioc.DESeq2) for each experimental condition. RNA-seq data were uploaded to the NCBI Gene Expression Omnibus repository with the accession number GSE111333.
SUPPLEMENTARY MATERIALS
Supplementary material for this article is available at http://advances.sciencemag.org/cgi/ content/full/6/6/eaaw6957/DC1
Fig. S1. CRISPR-Cas9 gene modification strategy is outlined.
Fig. S2. The SNP in PBANKA_011210 ApiAP2 TF does not interfere with the progression of sexual and pre-erythrocytic stages of the P. berghei life cycle.
Fig. S3. Flow cytometry gating strategy.
Fig. S4. Graphs comparing mice infected with PbNK65F and PbNK65S.
Table S1. Summary of changes observed between the WT and CRISPR-Cas9–mutated parasites based on whole-genome sequencing analysis.
Supplementary information 2. The 900-nucleotide synthetic sequence.
Data file S1. Supplementary information 1: DNA binding analysis of ApiAP2 domain 1.
REFERENCES AND NOTES
1. World Health Organization, WHO World Malaria Report (World Health Organization, 2017). 2. W. E. Collins, G. M. Jeffery, A retrospective examination of secondary sporozoite- and
trophozoite-induced infections with Plasmodium falciparum: Development of
on March 10, 2020
http://advances.sciencemag.org/