Thesis
Analysis Of Riprap Design Methods Using Predictive Equations For Maximum And Average Velocities At The Tips Of Transverse In-Stream
Structures
Submitted by Thomas Richard Parker
Department of Civil and Environmental Engineering
In partial fulfillment of the requirements For the Degree of Master of Science
Colorado State University Fort Collins, Colorado
Spring 2014
Master’s Committee:
Advisor: Christopher Thornton Steven Abt
Abstract
Analysis Of Riprap Design Methods Using Predictive Equations For Maximum And Average Velocities At The Tips Of Transverse In-Stream
Structures
Transverse in-stream structures are used to enhance navigation, improve flood control, and reduce stream bank erosion. These structures are defined as elongated obstructions having one end along the bank of a channel and the other projecting into the channel center and o↵er protection of erodible banks by deflecting flow from the bank to the channel center. Redirection of the flow moves erosive forces away from the bank, which enhances bank stability. The design, e↵ectiveness, and performance of transverse in-stream structures have not been well documented, but recent e↵orts have begun to study the flow fields and profiles around and over transverse in-stream structures. It is essential for channel flow characteristics to be quantified and correlated to geometric structure parameters in order for proposed in-stream structure designs to perform e↵ectively. Areas adjacent to the tips of in-stream transverse structures are particularly susceptible to strong approach flows, and an increase in shear stress can cause instability in the in-stream structure. As a result, the tips of the structures are a major focus in design and must be protected. Riprap size is a significant component of the design and stability of transverse in-stream structures, and guidance is needed to select the appropriate size such that the structure remains stable throughout its design life.
The U.S. Bureau of Reclamation contracted the Engineering Research Center at Colorado State University to construct an undistorted 1:12 Froude scale, fixed bed, physical model of
two channel bend geometries that are characteristic of a reach of the Rio Grande River south of the Cochiti Dam in central New Mexico. A series of factors including the construction of the Cochiti Dam and control levees has caused the historically braided river to meander and become more sinuous. Bank erosion threatens farmlands, irrigation systems, levee function, aquatic habitat, and riparian vegetation. The purpose of the model was to determine the e↵ectiveness of in-stream structures in di↵using the magnitude of forces related to bank erosion. Multiple configurations of transverse in-stream structures with varying x, y, and z parameters were installed in the model, and velocity and shear stress data were collected. A series of twenty-two di↵erent configurations of transverse in-stream structures were tested.
An analysis of the average and maximum velocities at the tips of the transverse in-stream structures was performed. Utilizing a channel bend approach velocity, average and maximum velocity ratios were calculated using physical model data. A set of dimensionless parameters consisting of influential structure design parameters was organized and arranged for regres-sion analysis. Predictive equations were developed that describe the ratios of maximum and average velocity at the tips of the in-stream structures to bend-averaged velocities. The pre-dictive equations for maximum and average velocity ratios function as a first approximation of in-stream structure riprap design for configurations that are within the range of tested data. Velocity data were used to assess the suitability of current riprap sizing techniques for transverse in-stream structures.
Bank revetment design methodologies were found to be dependable methods for in-stream structure riprap design. Methodologies developed by the United States Army Corps (US-ACE) and the United States Bureau of Reclamation (USBR) were recommended for the sizing of riprap for in-stream structures. Velocity adjustment procedures were created for
use in the USACE and USBR methods. The velocity adjustment procedures include a veloc-ity factor for the determination of a riprap sizing design velocveloc-ity. The riprap sizing design velocity produces a conservative riprap size for bank revetment, but an appropriate riprap size for in-stream transverse structures. Two velocity factors are provided: one for natural channels and the one for uniform, trapezoidal channels. Limitations and recommendations of the proposed tip velocity ratios and riprap sizing techniques are provided.
Acknowledgements
First, I would like to thank my parents and brother for their continual and unyielding support with everything I do. Next, I would like to thank Dr. Abt for providing me guidance throughout my graduate study and in my thesis research and writing. I would like to thank the rest of my committee members (Dr. Christopher Thornton and Dr. John Williams) for their guidance and feedback during the completion of my thesis. The research for the thesis could not have been done without the tremendous help and support of my Ph.D. mentors: Michael Scurlock and Natalie Youngblood.
The Engineering Research Center sta↵ was essential in making this all possible including: Patrick Noonan, Janice Barman, Ryan Zilly, Molly Sullivan, Shane Ritchie, Ryne Pearce, and Tyler Sobieck. Lastly, I would like to thank all of my friends and colleagues for their advice and support over the last few years. In particular, Ami Cobb has been one of the most inspirational and helpful people I have ever had the honor of working with. My graduate school studies and research could not have been completed without her continuous support and encouragement.
Table of Contents
Abstract . . . ii
Acknowledgements . . . v
List of Tables . . . ix
List of Figures . . . xii
Chapter 1. Introduction . . . 1
1.1. General Background . . . 1
1.2. Project Background . . . 2
1.3. Research Objectives. . . 4
Chapter 2. Literature Review . . . 5
2.1. Rock Riprap Sizing . . . 5
2.2. Description of Riprap Sizing Methods . . . 6
2.3. Types of In-Stream Structures . . . 35
Chapter 3. Physical Model Description. . . 43
3.1. Introduction . . . 43
3.2. Model Geometry and Flow Conditions . . . 43
3.3. Model Construction, Components and Startup . . . 46
3.4. Instrumentation and Measurements . . . 50
Chapter 4. Data Collection . . . 56
4.1. Baseline Data Collection . . . 56
Chapter 5. Data Analysis . . . 74
5.1. Terms for Analysis . . . 74
5.2. Maximum and Average Velocity Ratios (MVR & AVR) . . . 76
5.3. Regression Analysis . . . 79
5.4. M V Rtip & AV Rtip Results . . . 81
Chapter 6. Bernalillo Priority Site Case Study . . . 91
6.1. Introduction . . . 91
6.2. Bernalillo Priority Site Background . . . 91
6.3. HEC-RASR Model . . . 94
6.4. USBR Velocity Data and Observed M V Rtip’s . . . 96
6.5. Design Velocity Calculation from M V Rtip’s . . . 100
6.6. Summary . . . 101
Chapter 7. Analysis of Riprap Sizing Relationships. . . 103
7.1. Introduction . . . 103
7.2. Median Riprap Size Results . . . 103
7.3. Comparison of Methods . . . 110
7.4. Discussion of Results . . . 112
7.5. Average Velocity Adjustment Procedures for the USACE EM-1601 (1991) and USBR EM-25 (1984) Methods. . . 114
7.6. Example Procedures for In-stream Structure Riprap Design . . . 117
Chapter 8. Conclusion and Recommendations . . . 123
8.1. Overview . . . 123
8.3. Recommendations for Further Research . . . 125
Bibliography . . . 128
Appendix A. Velocity and Weir Data for Regression Analyses . . . 134
Appendix B. Regression Analyses Results . . . 152
Appendix C. Velocities for Riprap Design Analysis . . . 160
List of Tables
2.1 Agency, publication title, and abbreviated title of various rock riprap design
procedures . . . 19
2.2 Guide for selecting stability factors . . . 21
2.3 Guidelines for selection of Shields parameter and safety factor . . . 25
3.1 Similitude Scaling Used for the Physical Model (1:12 Froude Scale). . . 44
3.2 Geometric characteristics of Type 1 and 3 bends in the field . . . 44
3.3 Geometric characteristics of Type 1 and 3 bends in the model . . . 44
4.1 In-stream Structure Design Program . . . 59
4.2 Velocity Results from Data Collection . . . 67
5.1 Material Properties . . . 75
5.2 Channel Properties . . . 75
5.3 Flow Properties. . . 75
5.4 Weir Properties . . . 75
5.5 Parameters used for analysis . . . 78
5.6 M V Rtip Regression Results . . . 82
5.7 AV Rtip Regression Results . . . 82
5.8 Observed vs. Predicted M V Rtip Percent Errors . . . 87
5.9 Observed vs. Predicted AV Rtip Percent Errors . . . 87
6.2 Cox (2012) Observed Field M V Rtip’s (Natural Channel) . . . 99
6.3 CSU Physical Model Data M V Rtip’s (Trapezoidal Channel) . . . 100
7.1 USACE EM-1601 (1991) Median Riprap Size Results . . . 105
7.2 FHWA HEC-11 (1989) Median Riprap Size Results . . . 106
7.3 CALTRANS Cal-B&SP (2000) Median Riprap Size Results . . . 107
7.4 ASCE Man-110 (2006) Median Riprap Size Results . . . 108
7.5 USBR EM-25 (1984) Median Riprap Size Results . . . 108
7.6 USGS Vol. 2 (1986) Median Riprap Size Results . . . 109
7.7 Isbash Median Riprap Size Results . . . 110
7.8 Extrapolated Median Riprap Size Results for a Design Velocity of 10 f t/s. . . 110
7.9 Methodology Groups for Analysis . . . 113
7.10 Hydraulic Parameters of San Ildefonso Priority Site [2] . . . 118
A.1 Weir Data for Regression Analysis . . . 134
A.2 Velocity Data for Regression Analysis . . . 142
B.1 Regression Statistics Results for M V Rtip,total. . . 152
B.2 Regression Line Results for M V Rtip,total. . . 152
B.3 Regression Statistics Results for AV Rtip,total. . . 153
B.4 Regression Line Results for AV Rtip,total . . . 153
B.5 Regression Statistics Results for M V Rtip,spur. . . 154
B.7 Regression Statistics Results for AV Rtip,spur. . . 155
B.8 Regression Line Results for AV Rtip,spur . . . 155
B.9 Regression Statistics Results for M V Rtip,BW . . . 156
B.10 Regression Line Results for M V Rtip,BW. . . 156
B.11 Regression Statistics Results for AV Rtip,BW. . . 157
B.12 Regression Line Results for AV Rtip,BW. . . 157
B.13 Regression Statistics Results for M V Rtip,vanes. . . 158
B.14 Regression Line Results for M V Rtip,vanes. . . 158
B.15 Regression Statistics Results for AV Rtip,vanes. . . 159
B.16 Regression Line Results for AV Rtip,vanes . . . 159
C.1 Weir Data for Regression Analysis . . . 160
D.1 USACE EM-1601 (1991) Median Riprap Size Results . . . 167
D.2 FHWA HEC-11 (1989) Median Riprap Size Results . . . 174
D.3 CALTRANS Cal-B&SP (2000) Median Riprap Size Results . . . 176
D.4 ASCE Man-110 (2006) Median Riprap Size Results . . . 178
D.5 USBR EM-25 (1984) Median Riprap Size Results . . . 180
D.6 USGS Vol. 2 (1986) Median Riprap Size Results . . . 182
List of Figures
1.1 Planview of Middle Rio Grande River [3] . . . 2
2.1 Design curves to size riprap protection on embankments of various slopes (no safety factor included) . . . 11
2.2 Curve to determine maximum stone size in riprap mixture . . . 33
2.3 Series of bendway weirs in the field during low flow conditions [4] . . . 36
2.4 Planview of Bendway Weir Parameters [5] . . . 40
2.5 Cross-Section View of Bendway Weir Parameters [5] . . . 40
2.6 Schematic of a Spur Dike [5] . . . 41
2.7 Schematic of a Vane [5] . . . 41
3.1 Planview of Model Layout of Type 1 and 3 Bends [4]. . . 45
3.2 Physical Model Headbox for Flow Delivery [4]. . . 46
3.3 Finishing of Concrete for Desired Channel Roughness [4] . . . 47
3.4 Constructed Benway Weir during Testing [4] . . . 49
3.5 Bendway Weir Series in Model [4] . . . 49
3.6 Planview of model with labeled cross-sections [4] . . . 50
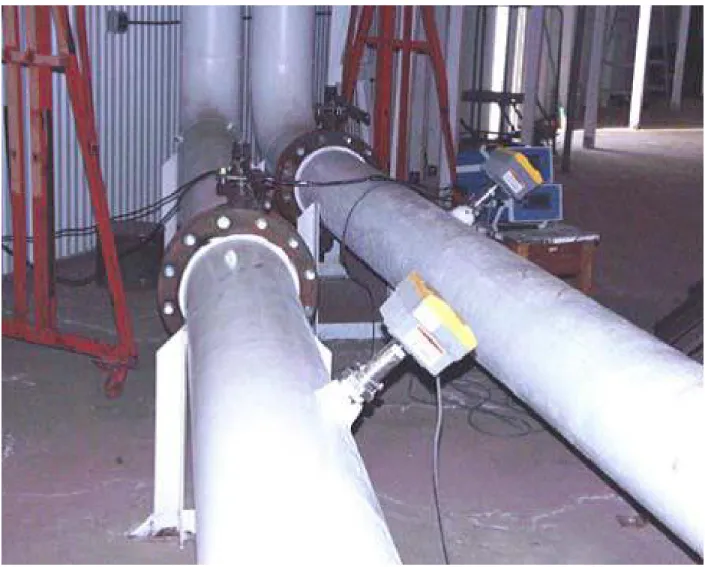
3.7 SIGNET Meters . . . 51
3.8 Electronic Display Boxes . . . 52
3.9 Piezometer locations for upstream and downstream bends [4]. . . 53
3.10 Stilling wells to measure water surface elevations [4] . . . 53
3.12 ADV Setup [4] . . . 55
4.1 Upstream bend of model during baseline testing [4] . . . 57
4.2 Data collection locations [4] . . . 66
5.1 Observed vs. predicted M V Rtip and AV Rtip for all in-stream structure types. . . 84
5.2 Observed vs. predicted M V Rtip and AV Rtip for spur dikes . . . 85
5.3 Observed vs. predicted M V Rtip and AV Rtip for bendway weirs . . . 85
5.4 Observed vs. predicted M V Rtip and AV Rtip for vanes . . . 86
6.1 Map of Bernalillo Site [1] . . . 92
6.2 Pre-construction aerial photograph date March 31, 2006 (left) and post-construction aerial photograph dated Feburary 25, 2007 (right) . . . 92
6.3 Planview of Bernalillo Site Weir Configuration [1] . . . 93
6.4 Planview sketch of bendway weir field design [? ] . . . 94
6.5 Bendway weir design planview [? ] . . . 94
6.6 Bendway weir design cross-section view [? ] . . . 95
6.7 Middle Rio Grande cross-section surveyed for HEC-RAS model [1] . . . 97
6.8 Structure Tip Velocity Measurement Area . . . 99
CHAPTER 1
Introduction
1.1. General Background
As the United States population continues to grow, the demand for water continues to increase for such things as municipal supply, power production, irrigation, and recreation [6]. The demand for water in the United States has a↵ected the balance of natural river systems and caused channel stability to be the subject of extensive research e↵orts. Channel stability can include protecting the property and land along the river banks, maintaining water quality, protecting aquatic habitats, and improving the aesthetics of areas near rivers. Two natural e↵ects that may occur when altering the flow of water and sediment in rivers are bank erosion and channel migration [7]. The magnitude of damage caused by these two mechanisms may be catastrophic if not managed; therefore, techniques such as armored revetment, in-stream structure placement, and bioengineering have traditionally been used to stabilize stream banks and river channels. In particular, traverse in-stream structures have been used to protect rivers from the harmful erosive e↵ects of high velocity flows and the subsequent high shear stresses. In theory, a transverse in-stream structure redirects high velocity flows away from the outer bank of a channel, decreases bank erosion, and enhances aquatic habitats for native species when designed properly.
Despite the e↵ectiveness of these structures, complete reliable design criteria for trans-verse in-stream structures have not been developed. Many of the past designs are site specific and dependent upon site specific conditions. The applicability of site specific criteria to other channel sites is questionable. A comprehensive riprap design method applicable to in-stream structures would allow for consistency in transverse in-stream structure design.
1.2. Project Background
The United States Bureau of Reclamation (USBR) commissioned Colorado State Uni-versity Engineering Research Center to construct a physical model to investigate structure-induced hydraulic conditions in two representative channel bends of the Middle Rio Grande River. The Middle Rio Grande is a 29-mi reach of the Rio Grande River in central New Mexico that extends from the Cochiti Dam downstream to Bernalillo, New Mexico. Figure 1.1 presents a map of the Middle Rio Grande reach.
Figure 1.1. Planview of Middle Rio Grande River [3]
In 1973, the Cochiti Dam was installed upstream of Albuquerque, New Mexico for flood and sediment control. The dam was installed in a portion of the river that was classified as braiding, which is typical of channel systems with its characteristic slope, vegetation, and sediment gradation properties. The dam e↵ectively controlled the sediment supply
available to the downstream reach of the channel and resulted in a geomorphic alteration of the channel from braided to meandering. The meandering nature of the stream resulted in natural changes such as bank erosion and channel migration. In turn, this placed valuable land properties and infrastructure in the path of the newly meandering river [3].
Numerous methods have been developed to combat the unwanted bank instability and channel migration. For example, the use of rock riprap blankets and rigid armor structures have been popular methods used to stabilize banks and prevent channel migration; however, these methods are not e↵ective at enhancing the habitat for vegetation and fish alike. The use of riprap as a blanket along the outer bank of a stream subdues the growth of riparian vegetation and advantageous aquatic habitat features such as pools [7]. To combat the potential for undesired channel migration while possibly enhancing the habitat, the USBR in Albuquerque, NM identified a set of in-stream structures that could be implemented along the outside banks of the meanders.
In recent years, the Middle Rio Grande has continued to be the focus of channel-restoration techniques including the use of native material and rock weir structures in the attempt to control bank-erosion rates, channel-migration rates, and habitat degradation [6]. The construction and testing of a physical model will help to alleviate the general lack of knowledge of flow properties around in-stream structures and aid in the development of de-sign criteria for rock and native weir structures. In response, an undistorted 1:12 Froude scale hard boundary model with two characteristic bends was designed and built for the development of appropriate design guidelines for in-stream structures.
1.3. Research Objectives
The application of stone-sizing criteria is subjective and generally non-applicable to tradi-tional bendway weir and spur dike design. For this study, stone-sizing criteria were evaluated for in-stream transverse structure design applicability. Specifically, the research objectives for this particular project are as follows:
(1) Observe and collect flow depth and time-averaged velocity data from twenty-two structure configurations including bendway weirs, spur-dikes, and vanes
(2) Determine bend-averaged and maximum velocity values for each structure configu-ration
(3) Identify influential structure design parameters for all structure configurations (4) Develop predictive bend-averaged and maximum velocity ratio equations for all
structure configurations
(5) Identify existing riprap sizing relationships, as well as, design criteria for in-stream transverse structure design, and
(6) Provide recommendations for modifying applicable existing equation(s) for specific use in in-stream transverse structure design
To address these objectives, a literature review of stone-sizing relationships for bank revetments, overtopping, and in-stream structure design and types of in-stream structures was conducted. An existing 1:12 Froude scale hard boundary model was used to test and collect flow depth and velocity data for twenty-two structure configurations. Channel sites currently utilizing in-stream structures for bank protection along the Middle Rio Grande were analyzed, and velocity and riprap size data were collected and analyzed.
CHAPTER 2
Literature Review
2.1. Rock Riprap Sizing
Rock riprap is one of the most commonly used methods to prevent the erosion and degradation of channel banks, embankments, levees, spillways, and in-stream structures that are subjected to high-velocity flow conditions [8]. Channel protection practices address the use of rock as individual stones or part of an integrated system. Many federal and state agencies have developed methods and approaches for the sizing of riprap. Most of the stone sizing methods are developed for specific applications and caution must be given in their application [9]. The majority of rock sizing methods are based on empirical data and can be considered empirical techniques; therefore, physical models, field data, and theoretical data have contributed to the variety of approaches used to determine stable riprap design [9]. Currently, empirically derived equations o↵er the best approach to design in-stream structures.
Most rock sizing methods have been developed for either high-energy or low-energy envi-ronments. Low-energy conditions are characterized by mild slops, low turbulence, subcritical flow, and uniform or gradually varied steady flows. High energy conditions are characterized by steep slopes, high turbulence, supercritical flow, and rapidly varied unsteady flow. There are many techniques that can be used with advantages and disadvantages depending on site specific conditions. A literature review was conducted to identify current stone-sizing relationships used for riprap design and how the relationships were developed.
2.2. Description of Riprap Sizing Methods
Twenty eight stone-sizing relationships were identified for the design of a protective riprap layer. The applications of these stone-sizing criteria were flow overtopping and bank stabi-liziation and revetment. Of the twenty-eight relationships identified, twenty-one relationships were developed for use in flow overtopping conditions. Eleven of the twenty-one flow over-topping relationships will be reviewed. The remaining seven relationships were developed by United State’s agencies for bank stabilization and revetment.
• Overtopping flow methods (1) Isbash (1936)
(2) Knauss (1979)
(3) Wittler and Abt (1997) (4) Mishra (1998) (5) Frizell et al. (1998) (6) Chang (1998) (7) Robinson et al. (1998) (8) Siebel (2007) (9) Peirson et al. (2008) (10) Khan and Ahmad (2011) (11) Thornton et al. (2013)
• Agency methodologies for bank stabilization (1) Federal Highway Administration techniques
(a) HEC-11 (1989) (b) HEC-15 (2005)
(2) California Department of Transportation (CALTRANS) Cal-B&SP (2000) method (3) USACE EM-1601 (1991) method
(4) American Society of Civil Engineers (ASCE) Man-110 (2006) method (5) U.S. Bureau of Reclamation (USBR) EM-25 (1984) method
(6) U.S. Geological Survey (USGS) Vol. 2 (1986) method
2.2.1. Overtopping Flow Methods.
2.2.1.1. Isbash (1936). Isbash (1936) developed a riprap sizing relationship for the con-struction of dams by studying the ability of water to flow over rocks in a river channel. A series of in-channel experiments was undertaken to develop the rock sizing relationship. The experiments consisted of depositing rock of known size and weight into a flowing channel. The shape of the cross-section was described, and a relationship between the rock size and the minimum velocity necessary for movement was developed. His e↵orts focused on sizing individual stones to resist displacement due to overtopping flow and percolation through the rock mass. Isbash developed his relationship on principle hydraulic variables such as stone size, bed slope, and unit discharge. The results of his studies have become the foundation of many other riprap sizing studies including Olivier (1967), Hartung and Scheurelein (1970), Knauss (1979), and Stephenson (1979) [8]. A coefficient is utilized such that high and low turbulence conditions are both applicable. Information required for sizing riprap includes the channel velocity, specific gravity of the stone, and choice of turbulence coefficients. The Isbash equation is provided in Equation 1.
(1) Vc = C ⇤ ✓ 2⇤ g ⇤ s w w ◆0.5 ⇤ (D50)0.5 Where: Vc = critical velocity (f t/s);
C = 0.86 for high turbulence, or 1.20 for low turbulence; g = 32.2 f t/s2; s = stone density (lb/f t 3 ); w = water density (lb/f t 3 ); and D50 = median stone diameter (f t)
2.2.1.2. Knauss (1979). Knauss (1979) compared the Olivier (1967) equation and the Hartung and Scheuerlein (1970) equation which are both used to determine the maximum admissible discharge capacity for the overspilling of rockfill dams. Using flume studies, Olivier developed his rock stability theory through the overtopping of rock dams. An em-pirical equation for crushed and rough stones was derived that related the overtopping flow to the following parameters: unit flow, slope, and median rock size. Hartung and Scheuerlin (1970) presented a set of rock stability equations for angular stones on steep slopes that in-cluded consideration of aerated flow. The stone stability relationship relates maximum unit discharge, roughness height, specific weight of water and stone, and slope. The Hartung and Scheuerlein (1970) equation was derived from the previously developed Isbash equation and extensive observations of aerated flow over fixed rock beds. Knauss determined that both empirical relationships were valid for crushed stones with angular shapes with a specific mass density around 2.7 t/m3. Equation 2 provides the Knauss relationship developed from work
by Olivier (1967), and Equation 3 provides the Knauss relationship developed from work by Hartung and Scheuerlein (1970).
(2) pqmax g ⇤ d3/2s = 0.18 ✓ 1.2 p ◆5/3 ⇤ J 7/6 (3) pqmax g⇤ d3/2s = 1.9 + 0.8⇤ 3sin✓ Where:
g = 9.81 m/s2;
ds = equivalent diameter of the stone in the rock fill layer (m);
p = porosity (0-1);
J = slope of downstream face (for example, 1V:2H equals 0.5) (m/m); = packing factor of stones = 0.0575 Gs N3/2;
Gs = weight of the average stone (kN );
N = number of stones per unit area (stones/m2); and
✓ = angle of slope ( )
2.2.1.3. Wittler and Abt (1997). A study by Wittler and Abt (1990) investigated the influence of material gradation on the stability of a riprap layer during overtopping flow conditions. In general, uniformly graded riprap displays a greater stability for overtopping flows but fails suddenly, while well-graded riprap resists sudden failure as voids are filled with smaller material from upstream. Additional studies at CSU from 1994 to 1997 provided more details on the di↵erent types of failure for di↵erent gradations. Failure of the riprap slope was defined as removal or dislodgement of enough material to expose the bedding material. It was observed during testing that the failure of the riprap layer occurred when the measured water depth was within the thickness of the rock layer. Using failure observations, an empirical relationship was developed for the sizing of rock riprap, which is provided in Equation 4.
(4) D50= 0.6q0.56Cs 0.67(tan↵) 0.683
sin↵
(2.65cos↵ 1)(cos↵⇤ tan sin↵)
1.11
(5) Cs = 0.75 + (logCu6) 2
Where:
q = flow discharge per unit width (f t3/f t); Cs = stability coefficient;
↵ = angle of the embankment with the horizontal;
= angle of repose of riprap (42 for all angular rocks with diameter 5 cm); and Cu = coefficient of uniformity
2.2.1.4. Mishra (1998). Through a cooperative agreement between the U.S. Bureau of Reclamation (USBR) and Colorado State University (CSU), Mishra (1998) experimented with rock stability by subjecting angular stones 10” to 25” in diameter to overtopping flows on a 50% slope. He considered failure to be movement of rock riprap by erosion or high flows until the bed was exposed. Mishra found that the void sizes inside the riprap layer play a significant role in the interstitial velocity of water. In turn, the void sizes of the riprap layer are strongly influenced by the gradation of the rock. He applied a coefficient of uniformity Cu to his resulting equation to account for these relationships and found that it provided a
good representation of the rock gradation and its e↵ects on the prediction of the interstitial velocity. He combined his results with the datasets of Abt and Johnson (1991) and Robinson et al. (1998) yielding an expression that sizes the stable rock size as a function of the stone coefficient of uniformity, unit discharge, and embankment slope. The relationship developed by Mishra is provided in Equation 6.
(6) D50Cu0.25 = 0.55qf0.52S 0.75
sin↵
(2.65cos↵ 1)(cos↵⇤ tan sin↵)
1.11
Where:
D50 = median stone diameter (m);
Cu = coefficient of uniformity;
qf = unit discharge at failure (m2/s);
↵ = angle of the embankment with the horizontal; and
= angle of repose of riprap material (42 for all angular rocks with diameter 5 cm)
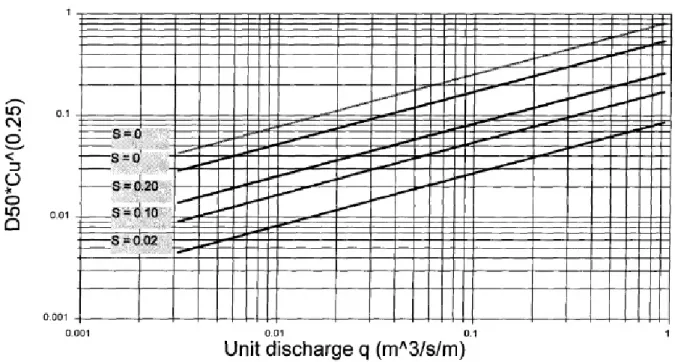
2.2.1.5. Frizell et al. (1998). Frizell et al. (1998) addressed the need for a reliable riprap sizing method during flow conditions associated with dam overtopping. The objectives of the study were to perform large scale testing of riprap on steep slopes and determine criteria for riprap size and layer thickness necessary to protect an embankment dam during overtopping flows. A design procedure to predict median stone size for a protective riprap layer was developed. The curves in Figure 2.1 shows Frizell’s relationship that relates the properties of the rock riprap, flow discharge, and embankment slope. Additionally, velocity data obtained from the test program were used to develop an analytical approach to determine the required riprap thickness. Equation 7 presents the non-dimensional relationship between interstitial velocity, median stone size, slope, and the coefficient of uniformity.
Figure 2.1. Design curves to size riprap protection on embankments of var-ious slopes (no safety factor included)
(7) pvi gD50
= 2.48S0.58Cu2.22
Where:
vi = interstitial velocity (m/s);
D50 = median stone size (m);
g = gravitational constant (9.81 m/s2);
S = embankment slope (m/m); and Cu = coefficient of uniformity = D60/D10
2.2.1.6. Chang (1998). Chang (1998) observed that rock slope failure occurred in two di↵erent stages. During the first stage, he found that individual stones initiated movement. The initial movement lead to the riprap layer becoming settled and interlocked. Thus, higher discharges were required to observe catastrophic failure. The two stages were termed the motion stage and failure stage by Abt and Johnson (1991). Chang developed a new design method for angular riprap with consideration to the two stages of rock slope failure. Interlocking e↵ects were included in his analysis through the implementation of an internal angle of friction. The Chang (1998) relationship relates the size of angular riprap to the slope and discharge at slope failure and is provided in Equation 8.
(8) D50 = 0.887⇤ q5/9 S5/18h1 S 1 tan(1+5S) i25/27 Where:
D50 = median rock riprap diameter (m);
q = discharge at slope failure per unit width (m3/s/m);
= angle of repose of riprap material or the internal angle of friction ( )
2.2.1.7. Robinson et al. (1998). Robinson et al. (1998) evaluated multiple rock chute design techniques in an attempt to provide a comprehensive rock chute design tool. Angular riprap with median stone sizes ranging from 15 to 278 mm were tested on rock chutes with slopes ranging from 2 to 40%. The loose riprap was installed in a 2⇤ D50 blanket
layer consisting of uniform, angular riprap and tested to overtopping failure. An empirical relationship was developed that predicts the highest stable discharge on a rock chute as a function of median stone size and bed slope. It is important to note that a factor of safety should be applied to the predicted rock size where appropriate. The predictive equations are provided in Equations 9 and 10. Both equations have not been verified for slopes lower than 2% or greater than 40%, and were developed for a rock specific gravity range of 2.54 to 2.82. for S < 0.1 (9) D50= 12(1.923qS1.5) 0.529 for 0.1 < S < 0.40 (10) D50= 12(0.233qS0.58) 0.529 Where:
D50 = median stone size (in);
q = highest stable unit discharge (f t3/s/f t); and S = channel slope (f t/f t)
2.2.1.8. Siebel (2007). Siebel (2007) performed a series of dam overtopping tests to ob-serve the performance of individual rock elements within a protection layer. He tested slope protection layers by individually placing stones on the slope of a large scale physical model in the hydraulics laboratory at Universtat Stuttgart. Experiments were completed for failure scenarios such as erosion of single stones, sliding of the protection layer, and disruption of the protection layer. Specifically, the experiments for the erosion of single stone elements were conducted on a flume with an adjustable slope from 1:26 to 1:3. A thin layer of concrete was placed on the bottom of the experiment’s flume and single stones were placed into the concrete before the drying process was complete. Multiple configurations of flow discharge and bed slope were tested to observe single stones within protection layer. A relationship for the design of multi-layer riprap protection layers was developed with an included factor of safety of 1.6. The relationship is provided in Equation 11.
(11) d50,req = 1.71S00.68q 2/3 0 ✓ ⇢w ⇢s ⇢w ◆1/3 Where:
d50,req = average stone diameter (m);
S0 = bed slope (m/m);
q0 = highest stable unit discharge (m3/s/m);
⇢s = stone density (kg/m3); and
⇢w = water density (kg/m3)
2.2.1.9. Peirson et al. (2008). In 2008, Peirson et al. quantified the additional resistance to erosion that can be accomplished by the individual placement of stones instead of the typical dumping construction process. A large-scale flume investigation for slopes of 0.2, 0.3, and 0.4 was performed. Two sizes of sandstone and basalt were installed such that
a maximum bulk density was reached. During experimentation, Peirson found that the failure flow rate for placed riprap was more than 30% higher than the failure flow rate of the same type of randomly dumped material. The total armor mass per unit surface area was increased by 35% for placed riprap. The relationships developed by Peirson et al. are provided in Equations 12, 13, 14, and 15.
(12) qover = ⇤ ye⇤ ve
Where:
qover = total overflow discharge per unit width;
= mean volumetric proportion of water in the air-water mixture; ye = representative flow depth; and
ve = representative mean velocity of the air-water mixture
and
(13) ye = y0+ d50/3
Where:
y0 = flow depth above the armor; and
d50/3 = characteristic hydraulic roughness
and
(14) = 1 1.3⇤ sin✓ + 0.24 ye
Where: ✓ = channel slope and (15) ve = 0.88 p 2g(⇢s ⇢)/ ⇢ p d50cos✓ p tan tan✓ Where: g = acceleration of gravity (9.81 m/s2); ⇢s = density of rock (kg/m3);
⇢w = density of water (kg/m3); and
= angle of friction of the rock ( )
2.2.1.10. Khan and Ahmad (2011). Khan and Ahmad (2011) used a series of 53 stability tests for angular riprap with a median stone size ranging from 15 to 278 mm and slope ranging from 1 to 40% to analyze rock stability in overtopping flows. Data were obtained from Abt and Johnson (1991) and Robinson et al. (1998) and used to evaluate the accuracy of the existing riprap sizing equations. The collaborative dataset had unit discharges of rock failure from 0.003 to 0.752 m2/s for rock sizes of 15 to 278 mm, respectively. Khan and
Ahmad used the dataset from the 53 stability tests to evaluate di↵erent stone sizing equations that are published including: Abt et al. (2008), Mishra (1998), Hartung and Scheuerlein (1970), Eli and Gray (2008), Robinson et al. (1998), and Abt et al. (1991). A multivariable power regression was performed with the dataset that included such parameters as median stone size, coefficient of uniformity, slope, layer thickness, and unit discharge at rock failure. The Khan and Ahmad relationship that was developed is provided in Equation 16. Equation 16 accurately predicted the desired angular stone size within an error of plus or minus 20% of the observed stone size.
(16) D50 = 0.66t0.58S0.22Cu0.45qf0.22
Where:
D50 = median stone size (mm);
t = rock layer thickness (n⇤ D50)(mm);
S = channel slope (m/m);
Cu = coefficient of uniformity = D60/D10; and
qf = unit discharge at rock failure (m2/s)
2.2.1.11. Thornton et al. (2013). Thornton et al. (2013) conducted a similar analysis to that of Khan and Ahmad (2011). Data were obtained from ten relevant studies that contained 102 discrete observations related to riprap failure under flow overtopping condi-tions. Variables within the overtopping flow dataset included stone size, discharge at move-ment/failure, bed/embankment slope, coefficient of uniformity, stone specific gravity, and riprap layer thickness. Median riprap sizes ranged from 0.59” to 25.76” and bed/embankment slopes from 0.2 to 50%. The unit discharges at riprap layer movement/failure for these types of channel/flow conditions ranged from 0.46 to 17.5 f t3/s/f t. Using the comprehen-sive dataset, a multivariate power regression analysis was performed in a manner similar to Khan and Ahmad (2011). The independent variables were defined as unit discharge at riprap failure, thickness, slope, coefficient of uniformity, and specific gravity, and the depen-dent variable was defined as the median rock riprap size. The predictive relation that was developed as a result of the analysis is provided in Equation 17.
(17) D50= 0.57S0.20Cu0.28qf0.21t0.62
⇥
Where:
D50 = median rock riprap size (in);
S = channel/embankment slope (f t/f t); Cu = coefficient of uniformity = D60/D10;
qf = unit discharge at riprap layer movement/failure (f t3/s/f t);
t = rock layer thickness (in); and SG = specific gravity
2.2.1.12. Summary of Overtopping Flow Methods. The stone-sizing relationships in Sec-tion 2.2.1 were developed to design revetment for dams, chutes, and spillways subjected to overtopping flows. Stone-sizing criteria for overtopping flows are remotely applicable for the sizing of riprap in in-stream structures. Riprap protection for overtopping flows consists of installing a layer of riprap on the slope of a dam or spillway to prevent undercutting. Over-topping methods routinely apply to slopes greater than or equal to 10%, where as channels with in-stream structures usually have channel bed slopes much less than 2%. The hydraulic forces and stresses applied to riprap on large slopes (i.e. dams or spillways) are significantly higher than forces impacting in-stream structures. Therefore, overtopping methods provide a highly conservative approach to stone-sizing for in-stream structure design. However, the Isbash (1936) method will be analyzed for in-stream structure riprap sizing because of its longetivity in the hydraulic design field and the significant number of procedures that are derived from the principles the Isbash method.
2.2.2. Agency Methodologies for Bank Stabilization. A number of agencies have developed procedures for the design of protective rock riprap layers for bank revetment including the Federal Highway Administration (FHWA), California Department of Trans-portation (CALTRANS), United States Army Corps of Engineers (USACE), American So-ciety of Civil Engineers (ASCE), United States Bureau of Reclamation (USBR), and United State Geological Survey (USGS). Table 2.1 summarizes each technique. A brief overview
of each procedure, how it was developed, and resultant design relationships is provided in Sections 2.2.2.1 through 2.2.2.6.
Table 2.1. Agency, publication title, and abbreviated title of various rock riprap design procedures
Agency Title and Date of Riprap Design Procedure Procedure Abbreviation FHWA Hydraulic Engineering Circulars: Design of
Riprap Revetment (1989), Design of Road-side Channels with Flexible Linings (2005)
HEC-11/HEC-15
CALTRANS California Bank and Shore Rock Slope Pro-tection Design (2000)
Cal-B&SP USACE Hydraulic Design of Flood Control Channels,
EM 1110-2-1601 (1991)
EM-1601 ASCE Sedimentation Engineering: Processes,
Mea-surements, Modelling, and Practice, Manual No. 110 (Garcia, 2006)
Man-110
USBR Hydraulic Design of Stilling Basins and En-ergy Dissipators (Peterka, 1984, Engineering monograph No. 25)
USBR EM-25
USGS Rock Riprap Design for Protection of Stream Channels near Highway Structures (1986)
USGS Vol. 2
2.2.2.1. Federal Highway Administration Techniques. The Federal Highway Administra-tion (FHWA) developed multiple techniques that discuss the use of riprap for a wide range of channel protection applications. Two of the techniques involving bridge scour, slope protec-tion, and maximum permissible depth of flow were reviewed and evaluated for applicability with in-stream structure riprap design. The two applicable methods reviewed were HEC-11 (1989) and HEC-15 (2005). HEC-HEC-11 (1989) presents a series of design procedures for bank revetments and channel linings on large rivers. HEC-15 (2005) presents a set of design procedures for flexible linings on small channels.
HEC-11 HEC-11 (1989) provides a methodology for the design of riprap revetments for channel bank protection and channel linings on large streams and rivers. The technique is primarily applicable to rivers where the average discharge exceeds 50 cf s (HEC-15 should be
used for smaller channels). In addition to the design procedure, the circular discusses many erosion and riprap topics including: erosion potential, erosion mechanisms, riprap failure modes, and common riprap types.
A boundary shear stress based riprap relationship is presented with the flow velocity remaining as the primary design parameter. Equation 18 assumes uniform, gradually varying flow as expressed:
(18) D50= C ⇤ 0.001 ⇤ Va3/(d0.5avgK11.5)
Where:
D50 = median riprap particle size (f t or m);
Va = average velocity in the main channel (f t/s or m/s);
C = correction factor (described below); and
davg = average flow depth in the main flow channel (f t or m)
K1 is defined with the equation below:
(19) K1 =
⇥
1 (sin2✓/sin2 )⇤0.5
Where:
✓ = the bank angle with the horizontal ( ); and = the riprap material’s angle of repose ( )
It is important to note that average flow depth and velocity values used in Equation 18 are main channel values, as in the area between the channel banks. Equation 18 assumes a rock riprap specific gravity of 2.65 and a stability factor of 1.2. If these assumptions are not applicable to a site specific location, then a correction factor must be used. The
specific gravity correction is for rock riprap with a specific gravity greater or less than 2.65 as presented in Equation 20.
(20) Csg = 2.12/(Sg 1)1.5
Where:
SG = the specific gravity of the rock riprap
The stability factor correction is for rock riprap with a stability factor greater or less than 1.2 and is provided in Equation 21.
(21) Csf = (SF /1.2)1.5
Where:
SF = the stability factor to be applied
The correction factors calculated in Equations 20 and 21 are multiplied forming a single correction factor, C. Correction factor C is integrated into Equation 18 for determining the median rock riprap size. Stability factors range from 1.0 to 2.0 depending on the flow conditions encountered along the reach. Table 2.2 presents the guidelines for the selection of the stability factors.
Table 2.2. Guide for selecting stability factors Conditions Stability Factor Range
Uniform flow 1.0 - 1.2
Gradually varying flow 1.3 - 1.6 Approaching rapidly varying flow 1.6 - 2.0
HEC-15 HEC-15 (2005) presents a riprap design procedure based on the concept of max-imum permissible depth of flow and hydraulic resistance of the lining material. The proce-dure was initially developed from reports published by Anderson et al. (1970) and Simon and Lewis (1971). Hydraulic modeling and field observations were used to verify the methods presented in HEC-15 (2005). It is important to note that the HEC-15 procedure is only applicable to: fully-lined channels carrying discharges up to 1,000 f t3/s, triangular channels with a maximum discharge of 100 f t3/s, and channels with maximum slopes of 0.10 f t/f t. As a key parameter in flow hydraulics, Mannings roughness is essential in determining the relationships between flow depth, velocity, slope, grain size, and friction slope. Blod-gett (1986) proposed the following relationship for Mannings roughness coefficient, n, as a function of flow depth and relative flow depth:
(22) n = ↵d 1/6 a 2.25 + 5.23log⇣ da D50 ⌘ Where:
n = Manning’s roughness coefficient (dimensionless); da = average flow depth in the main channel (f t, m);
D50 = median riprap/gravel size (f t, m); and
↵ = unit conversion constant, 0.319 (SI) and 0.262 (CU)
It is important to note that Equation 22 is applicable for flow conditions where 1.5 < da/D50 < 185 in small channel applications. If da/D50 is less than 1.5, the channel has flow
conditions in which the projection of the riprap into the flow field has a significant e↵ect on the roughness relationship as commonly observed in steep and moderate channels. Bathurst (1991) developed a relationship for steep and moderate slopes as presented in Equation 23.
(23) n = ↵d
1/6 a
pgf (F r)f (REG)f (CG)
Where:
g = acceleration due to gravity, 9.81 m/s2 (32.2 f t/s2);
F r = Froude number;
REG = roughness element geometry; CG = channel geometry; and
↵ = unit conversion constant, 1.0 (SI) and 1.49 (CU)
Equation 23 is semi-empirically based, therefore, it is applicable for 0.3 < da/D50 < 8.0.
The three functions in the denominator of Equation 23 are defined by Equations 24, 25, and 26. (24) f (F r) = ✓ 0.28F r b ◆log(0.755b ) (25) f (REG) = 13.43 ✓ T D50 ◆0.492 b1.025 ⇣ T D50 ⌘0.118 (26) f (CG) = ✓ T da ◆ b Where:
T = channel top width (f t, m); and
The parameter b defines a relationship between the e↵ective roughness concentration and relative submergence of the roughness bed. The relationship is:
(27) b = 1.14 ✓ D50 T ◆0.453✓ da D50 ◆0.814
HEC-15 (2005) also presents a ”hydraulic resistance of the lining” method that addresses the permissible shear stress approach for both riprap and gravel linings. The method is primarily based on field and laboratory experimental research. The permissible shear stress is defined as:
(28) ⌧p = F⇤( s )D50
Where:
⌧p = permissible shear stress(N /m2, lb/f t2);
F⇤ = Shield’s parameter (dimensionless);
s = specific weight of stone (N /m2, lb/f t2);
= specific weight of water, 9810 N /m2 or 62.4 lb/f t2; and
D50 = mean riprap size (f t, m)
Equation 28 can then be transformed into a rock sizing equation as:
(29) D50
SF ⇤ d ⇤ S0
F⇤⇤ (SG 1)
Where:
d = maximum channel depth (m, f t); and SG = specific gravity of rock (dimensionless)
Equation 29 integrates the importance of skin friction, form drag, and channel bed slope in developing a minimum design riprap size for the channel bottom. An important component of using this method is selecting the Shields parameter and safety factor. The selection of these parameters is normally based on the Reynolds number of the flow. Table 2.3 provides a guide for the selection process:
Table 2.3. Guidelines for selection of Shields parameter and safety factor
Reynolds number F⇤ SF
4 ⇤ 104 0.047 1
4⇤ 104 < R
e < 2⇤ 105 Linear interpolation Linear interpolation
2⇤ 105 0.15 1.5
Simons and Senturk (1977) derived a relationship that is applicable for channels with steeper slopes and is expressed as:
(30) D50
SF ⇤ d ⇤ S ⇤ F⇤⇤ (SG 1)
Where:
= function of channel geometry and riprap size (Equation 31)
The parameter is a function of the side slope angle, channel bottom slope, and riprap properties and is:
(31) = K1(1 + sin(↵ + ))tan
2(cos ✓tan SF sin ✓cos
Where:
↵ = angle of the channel bottom slope ( );
= angle of repose of the riprap ( ); and ✓ = angle of the channel side slope ( )
In addition, the angle between the weight vector and the weight/drag resultant vector in the plane of the side slope can be defined as:
(32) = tan 1 2sin ✓cos↵
⌘tan + sin ↵
!
Where:
⌘ = stability number (equation below) Finally,
(33) ⌘ = ⌧s
F⇤⇤ ( s )D50
The size of rock riprap increases dramatically as the discharge and channel gradient increase, and it is recommended that Equation 30 be used for channels with bed slopes greater than 10%. The equation is also helpful as its sizes riprap for both the channel bottom and side slopes. Equation 29 is recommended for slopes less than 5%. If channel slopes are between 5 to 10%, it is recommended that both methods be applied and the more conservative riprap size be selected.
It is important to recognize the di↵erence between HEC-11 (1989) and HEC-15 (2005). HEC-15 (2005) is intended for use in the design of small roadside drainage channels where the entire channel section is lined. The HEC-15 methods are applicable for channels carrying less than 50 cf s and flow conditions are generally uniform in a manner that average hydraulic
conditions are sufficient for design. HEC-11 (1989) design guidelines are appropriate for more uniform and dynamic streams and rivers with sizes much greater than small roadside canals.
2.2.2.2. California Department of Transportation method (B&SP). In 2000, the Cal-ifornia Department of Transportation re-evaluated and revised a rock slope protection pro-cedure that was introduced in the 1960 Bank and Shore Protection (BSP) manual. Sub-sequently, a California Bank and Shore Rock Slope Protection Design (2000) report was released that focuses on rock slope protection and redefines a bank and shore layered rock slope protection design method. An investigation was performed where sixty-five field sites in five states were analyzed and properties of the site were recorded. The rock slope pro-tection design relationship presented in 2000 is the same expression found in the California Bank and Shore Protection Design (1960) and is presented in Equation 34. Equation 34 provides the minimum standard rock weight for the surface layer of the layered rock slope protection. (34) W = 0.00002 (Gs 1)3 ⇤V M ⇤ V 6⇤ G s sin3(r a) Where:
W = minimum rock weight (lb); V = velocity (f t/s);
V M = velocity coefficient for types of flow; = 0.67 if flow is parallel
= 1.33 if flow is impinging
Gs = specific gravity of rock (typically 2.65);
r = angle of repose (70 for randomly placed rock); and
2.2.2.3. USACE EM-1601 Method. In 1991, the United States Army Corps of Engineers (USACE) published riprap design guidelines for ”open channels not immediately downstream of stilling basins or other highly turbulent areas” [10]. EM-1601 presents a low-energy technique for channel bank protection or revetments using riprap. USACE developed the EM-1601 method for application in the design of riprap in constructed and natural channels with a slope of 2% or less and Froude number less than or equal to 1.2. The method uses a depth-averaged local velocity based upon the assumption that a designer can obtain a better estimation of local velocity rather than local boundary shear stress. Equation 35 can be applied to both uniform and gradually varying flow.
(35) D30= d⇤ F S ⇤ Cs⇤ Cv⇤ CT ⇤ "✓ w s w ◆0.5 ⇤ p Vdes K1⇤ g ⇤ d #2.5 Where:
D30 = stone size (f t, m) of which 30% is finer by weight;
d = local depth of flow (f t, m);
F S = factor of safety (usually 1.1 to 1.5), suggested 1.2; Cs = stability coefficient;
= 0.30 for angular rock = 0.375 for rounded rock
Cv = velocity distribution coefficient;
= 1.0 for straight channels or the inside of bends
= Equation 36 below for outside of bends (1.0 for Rc/W > 26)
= 1.25 downstream from concrete channels = 1.25 at the end of dikes
CT = blanket thickness coefficient given as a function of the uniformity ratio d85/d15;
= 1.0, recommended because it is based on very limited data
w = specific weight of water (weight/volume); s = specific weight of stone (weight/volume);
Vdes = characteristic velocity for design as in Equations 37 and 38 (f t/s, m/s);
Rc = centerline radius of curvature of channel bend (f t, m);
W = width of water surface at upstream end of channel bend (f t, m); Sg = specific gravity of riprap (usually taken as 2.65);
g = acceleration due to gravity (32.2 f t/s2, 9.81 m/s2); and
K1 = side slope correction as computed in Equation 39
For outside bends, the velocity coefficient can be calculated as:
(36) Cv = 1.283 0.2log
Rc
W
The characteristic velocity (Vdes) is defined as the depth-averaged velocity at a point 20%
upslope from the toe of the revetment and is calculated di↵erently for natural and trapezoidal channels. For natural channels:
(37) Vdes = Vavg(1.74 0.52log(Rc/W ))
Vdes = Vavg for Rc/W > 26
For trapezoidal channels:
(38) Vdes = Vavg(1.71 0.78log(Rc/W ))
Vdes = Vavg for Rc/W > 8
The side slope correction factor K1 is calculated as:
(39) K1 =
⇥
1 (sin2✓/sin2 )⇤0.5
Where:
✓ = angle of rock from the horizontal ( ); and = angle of repose (typically 40 )
The flow depth y utilized in EM-1601 is defined as a local flow depth and can have two di↵erent meanings depending on the application of the equation. The flow depth at the toe of the channel side slope is used for bank revetment applications, while the average water depth is used for most other applications.
It is important to note that EM-1601 utilizes a D30 instead of D50 that is used in other
techniques. As a result, the resulting riprap size from EM-1601 is approximately 15% smaller than the riprap size calculated through other published riprap sizing techniques. If the median stone diameter is desired, the National Cooperative Highway Research Program (NCHRP) Report 568 (2006) provides a method for converting D30 to D50:
(40) D50= 1.2D30
Equation 35 was developed primarily for stream bank revetments, therefore application of Equation 35 to in-stream transverse structure design is an approximation. When designing for spur dikes, a Cv value of 1.25 is recommended, and a higher safety of factor and/or higher
average channel velocity should be considered. Riprap should be designed to extend below the bed elevation to a depth that is protected from long term scour and degradation. Special attention should focus on the tip of the spur where a riprap foundation should be considered for scour protection.
FHWA’s circular HEC-23 (2001) also discusses the EM-1601 method and its applicability in the field. HEC-23 (2001) identifies and provides design guidelines for countermeasures against bridge scour and stream instability. Nineteen detailed design guidelines are provided for stream instability, streambank and roadway embankment protection. Four of nineteen
design guidelines provide guidance on revetment riprap design including in-stream structure design.
2.2.2.4. American Society of Civil Engineers method (Man-110). In 1975, Vanoni and the American Society of Civil Engineering (ASCE) published Sedimentation Engineering (ASCE Manual No. 54). The manual was updated and renamed to Sedimentation Engi-neering (ASCE Manual No. 110) by Garcia in 2006. A section of ASCE Manual No. 110 (2006) discusses channel control structures for reducing/preventing erosion. One approach to prevent erosion is the use of a rock riprap layer. ASCE Manual No. 110 (2006) determines the median rock size D50 based on flow velocity and restricts the gradation of the riprap
such that the maximum stone size is 1.5 times the median stone size calculated. The median stone size is determined in units of weight similar to Cal-B&SP (2000). Equation 41, as proposed by Isbash, was modified in ASCE Manual No. 110 (2006) for sloping banks, and expressed as: (41) W = 0.000041GsV 6 (Gs 1)3cos3 Where: W = weight of stone (lb); Gs = specific gravity of stone;
V = velocity (f t/s); and
= angle of side slope to horizontal ( )
Unlike other methods, ASCE Manual No. 110 (2006) uses the flow velocity to estimate the hydraulic stresses on the bed and banks instead of parameters such as flow depth or hydraulic radius. The use of flow velocity simplifies Equation 41 since other parameters
used to determine boundary shear stress can be difficult to determine at field sites. Further, ASCE Manual No. 110 (2006) states that the thickness of the riprap layer should be 1.5 times the median rock size, and the use of rock riprap should be restricted to channels with flow depths less than 40 f t, and preferably less than 30 f t.
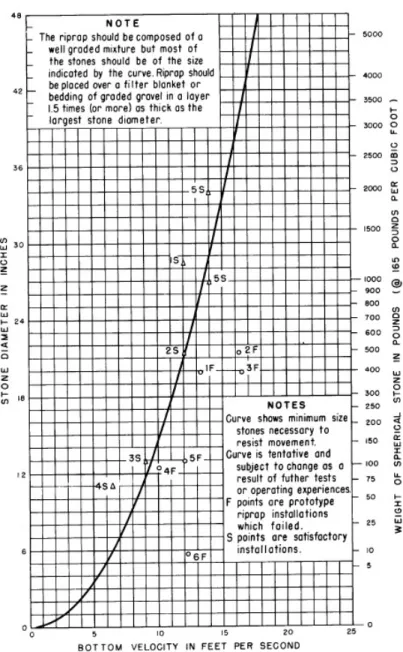
2.2.2.5. U.S. Bureau of Reclamation method (USBR EM-25). In 1958, Peterka and the United States Bureau of Reclamation (USBR) published Engineering Monograph No.25 ti-tled ”Hydraulic Design of Stilling Basins and Energy Dissipators” (1984) i.e. USBR EM-25. Two reasons for riprap failure are presented including (1) underestimation of stone size, and (2) availability of correctly sized riprap at site. USBR EM-25 presented a set of design procedures to determine the individual stone size required to resist a range of flow velocities impacting stilling basins at downstream locations. The stone size relationship is based on laboratory flume test data. A empirical relationship was developed from the flume dataset in which the stone diameter could be determined from the flow velocity on the channel bottom. Figure 2.2 presents the maximum stone size relationship.
The e↵ectiveness of the design curve was evaluated using field tests on constructed stilling basins. The USBR concluded that a well-graded riprap containing 40% of rocks smaller than required was more stable than a blanket of rock composed entirely of required size. This phenomena can be related to the interlocking of di↵erent sized rock and the flow turbulence caused by a rough boundary layer [11].
Figure 2.2 was logarithmically transformed and an analytical approach was produced for median rock riprap size. The analytical approach is expressed as:
Figure 2.2. Curve to determine maximum stone size in riprap mixture Where:
Va = average channel velocity (f t/s)
2.2.2.6. U.S. Geological Survey method (USGS Vol. 2). In 1986, The United States Geological Survey (USGS) published the report ”Rock Riprap Design for the Protection of Stream Channels Near Highway Structures” (USGS Vol. 2, 1986) that presents hydraulic characteristics of open channels and guidelines for rock riprap design. USGS Vol. 2 (1986) by Blodgett and McConaughy evaluates seven procedures being used for the design of rock
riprap. Four types of riprap failure are recognized in the report, and a new relationship between median riprap size and flow velocity is presented. Thirty-nine (39) flow events at twenty-six (26) sites were used for the development of the relationship. Seventeen (17) events initiated riprap movement causing damage. Particle erosion is identified as the primary cause of damage in these seventeen events. The velocity and median riprap relationship established by HEC-11 were correlated resulting in Equation 43.
(43) D50 = 0.01Va2.44
Where:
Va = average channel velocity (f t/s)
2.2.2.7. Summary of Agency Methodologies for Bank Stabilization. The agency bank sta-bilization methods presented in Section 2.2.2 are used for bank and toe revetments. Revet-ment protects the banks of a channel similar to in-stream structures, in that, a riprap layer is installed to dissipate high velocity flows and reduce or prevent the erosion of bank material. In-stream structures are subjected to stresses higher than bank revetment. In-stream struc-tures extend into the channel and encounter impacting flows creating zones of high shear stress, while bank revetments are contained along the channel bank resulting in high velocity flows impacting in a near parallel manner.
The HEC-11, Cal-B&SP, Man-110, USBR EM-25, and USGS methodologies utilize an average channel velocity in the computation of median riprap size. The principles behind using an in-stream structure for bank protection (further described in Section 2.3) suggests that flow velocities along in-stream structures are significantly higher than average channel
velocities. The riprap size for in-stream structures must be designed to account for higher flow velocities and shear stresses that occur along the structure and particularly at the structure tip. The implementation of an average flow velocity in agency bank revetment methodologies could underestimate the necessary riprap size for in-stream structure design. Thus, evidence strongly suggests that the design flow velocity utililzed in the agency relationships may require reevaluation to account for increased flow velocities impacting the structures.
2.3. Types of In-Stream Structures
2.3.1. Bendway Weirs. Bendway weirs are defined as submerged rock structures that protrude/extend into a channel reach at angles upstream, downstream, or perpendicular to the channel bank. These structures are placed in a series along the outer bank of a bend to provide protection from channel bank erosion. They serve as a channel bank protection measure by redirecting high flow velocities away from the outside bank and reducing the magnitude of secondary flows in channel bends [4]. Redirected flow accelerates around the weir, such that significant di↵erences have been observed between the average flow velocity and the velocities measured along bendway weirs, particularly at their tips [3]. The redirec-tion of flow shifts high shear stresses away from the bank towards the riverward ends of the bendway weirs.
Bank stabilization schemes that are primary constructed parallel to the channel bank (i.e. revetments, longitudinal dikes, and bulkheads) must be designed to protect against the undermining along the entire length of the bank, while localized protection at the weir tips is required for a bendway weir stabilization scheme. A catastrophic failure of a bendway weir stabilization scheme is less probable than other bank stabilization schemes because the tips
of the weirs are the most impacted at any given time. Failure of the weir tip leaves additional spur length to provide partial protection for the bank until repairs can be performed [12].
Bendway weirs are advantageous as they reduce construction right-of-way and bank al-teration compared to other countermeasures such as riprap revetment [12]. Aquatic species and riparian vegetation are supported by the installation of bendway weirs as eddies and pools are favorable for fish habitat and protect vegatative growth created behind the weirs. River navigation is significantly improved by the deepening of the channel and stabilization of the channel banks caused by bendway weirs [13]. An example of a series of bendway weirs in the field is provided in Figure 2.3.
There are five significant design parameters that have been defined for the development of bendway weir design criteria. These parameters include weir angle, height, profile, length, and spacing [4]. A plan and cross-section view of the significant bendway weir parameters is provided in Figure 2.4 and Figure 2.5. The weir angle, ✓, is defined as the angle between the weir orientation and the axis tangent to the channel bank. In this manner, a weir angle of 0 to 90 indicates a weir that is oriented upstream, while an weir angle of 90 to 180 describes a weir oriented downstream. The angle at which a bendway weir is installed is dependent upon the intended purpose of the structure. Brown (1985) presented a theory that upstream-oriented weirs repel flow, while downstream-upstream-oriented weirs attract flow. Downstream-facing weirs are less susceptible to scour at the toe of the structure and collect less debris than upstream-oriented weirs. An issue that has been observed with downstream-oriented weirs is the redirection of overtopping flow towards eroding channel banks [13]. Upstream-oriented weirs are more e↵ective at redirecting high velocity flows away from eroding channel banks. A movable bed study by Derrick et al. (1994) indicated that a weir angle of 60 was appropriate for efficient weir performance. Derrick et al. (1994) also concluded that an adjustment of weir angle as little as 5 can have a significant e↵ect on the efficiency of a bendway weir. As a result, the weir angle is a significant part of the design of a bendway weir system.
The weir height, Hw crest, is defined as the distance the crest of a weir rises above the
channel bed. Brown (1985) recommends weir heights be designed as a function of the height of channel bank to be protected. Five design guidelines have been presented for the design of weir height by Brown (1985) that include:
(1) Weir heights should be tall enough to adaquately protects the areas of the channel bank a↵ected by the erosion process
(2) Weir heights should be designed no more than three feet below the design flow stage if the design flow stage is lower than the channel bank height
(3) Weir heights should be designed to meet channel bank height when the design flow stage is higher than the channel bank height
(4) Permeable weirs should be designed at a height where heavy debris can pass over the weir crest without causing structural damage
(5) Impermeable weirs should be submerged by at least 3-f t below the worst design flow condition to protect against local scour and flow concentration at the weir tip
The profile of a weir is related to the weir height and is typically sloped or level. Sloping crests are advantageous because they allow for the adjustment of the meander trace and amount of flow constriction with flow stage. Brown (1985) recommends the use of a sloping crest for impermeable weirs. Sloping crests are typically used when the a↵ected channel has high banks. Brown (1985) recommends a level crest design for permeable weirs unless bank heights are sufficiently tall to warrant a sloping crest [12].
The bendway weir length, Lw proj, is defined as the projected length of the weir from
the channel bank to the tip of the weir crest perpendicular to the main direction of flow [4]. Brown (1985) investigated weir length for permeable and impermeable weirs and identified four trends. The four trends provided are:
(1) Scour depth at the tip of the weir increases with weir length
(2) Magnitude of flow concentration at the structure tip increases with weir length (3) Flow deflection increases with weir length
Brown (1985) recommends an impermeable weir less than 15% of the bankfull channel width. Permeable weirs are recommended to be less than 25% of the channel width at dominant discharge.
Bendway weir spacing, Larc, is defined as the arc distance between the weirs measured
from where the bendway weir meets the channel bank. Weir spacing is a significant design parameter because a compromise between economic efficiency and structure e↵ectiveness. Excessively large weir spacings may result in further bank erosion from high velocity flows; however, tightly-spaced weirs may result in economic inefficiency and incomplete e↵ectiveness of individual structures. Weir length, angle, permeablility, and channel bend geometry must also be considered in the design of weir spacing. Copeland (1983) and Brown (1985) investigated spacing ratios in bendway weir fields. Spacing ratios are defined by Brown (1985) as the ratio of the weir’s spacing length to the its projected length, Lw proj. Copeland (1983)
recommends spacing ratios up to 3, but expressed a need for additional bank protection in some cases. Copeland suggested that spacing ratios should be significantly influenced by observations in channels of similar nature or site-specific models. Spacing ratios of 4 to 6 and 3 to 4 were recommended for large and small radius bends, respectively [4]. Heintz (2002) asserts that a method of determining optimal bendway weir spacing ratios is not clearly defined, and most literature recommends basing spacing ratios on site-specific conditions.
Figure 2.4. Planview of Bendway Weir Parameters [5]
Figure 2.5. Cross-Section View of Bendway Weir Parameters [5]
2.3.2. Spur Dikes. Spur dikes are types of bendway weirs designed with a crest eleva-tion matching the cross-seceleva-tion averaged design flow depth. Spur dikes are placed on the outer bank of a channel bend to provide bank protection and to redirect high velocity flows towards the middle of the channel preventing unwanted migration. Spur dikes have been extensively used to manage and train rivers. Spur dikes can be permeable or impermeable depending upon their composition, i.e. concrete, earth, stone, etc. The guidelines presented
in Section 2.3.1 are applicable to spur dikes. Figure 2.6 provides a cross-section schematic of a spur dike.
Figure 2.6. Schematic of a Spur Dike [5]
2.3.3. Vanes. Vanes are types of bendway weirs designed with a crest that slopes down-ward from the bank to the thalweg of the channel. Therefore, the height of the weir at the toe of the structure is lower than where the vane ties into the outer bank. Flow is conveyed over the vane and away from the bank as it moves downstream. Similar to bendway weirs and spur dikes, vanes guide flow away from the bank, reduce bank erosion, and encourage vegetation growth. The guidelines presented in Section 2.3.1 are applicable to vanes. Figure 2.7 provides a cross-section schematic of a vane.
Figure 2.7. Schematic of a Vane [5]
2.3.4. Summary. In-stream structures are designed to protect banks by redirecting high velocity flows away from eroding channel banks. Multiple techniques have been used to protect channel banks, but in-stream structures are used extensively because of the secondary e↵ects resulting from their installation. These structures support the enhancement of riparian vegetation and fish habitats by creating pools and eddies in channel bends. Navigation is
![Figure 1.1. Planview of Middle Rio Grande River [3]](https://thumb-eu.123doks.com/thumbv2/5dokorg/5529303.144260/15.918.193.738.420.844/figure-planview-middle-rio-grande-river.webp)
![Figure 2.3. Series of bendway weirs in the field during low flow conditions [4]](https://thumb-eu.123doks.com/thumbv2/5dokorg/5529303.144260/49.918.114.811.508.1038/figure-series-bendway-weirs-field-low-flow-conditions.webp)
![Figure 2.4. Planview of Bendway Weir Parameters [5]](https://thumb-eu.123doks.com/thumbv2/5dokorg/5529303.144260/53.918.317.605.108.557/figure-planview-of-bendway-weir-parameters.webp)
![Figure 3.2. Physical Model Headbox for Flow Delivery [4]](https://thumb-eu.123doks.com/thumbv2/5dokorg/5529303.144260/59.918.210.707.640.1040/figure-physical-model-headbox-flow-delivery.webp)
![Figure 3.3. Finishing of Concrete for Desired Channel Roughness [4]](https://thumb-eu.123doks.com/thumbv2/5dokorg/5529303.144260/60.918.208.707.642.1041/figure-finishing-concrete-desired-channel-roughness.webp)
![Figure 3.4. Constructed Benway Weir during Testing [4]](https://thumb-eu.123doks.com/thumbv2/5dokorg/5529303.144260/62.918.179.742.105.614/figure-constructed-benway-weir-during-testing.webp)