ANALYSIS OF POST-WILDFIRE DEBRIS FLOWS:
CLIMATE CHANGE, THE RATIONAL EQUATION,
AND DESIGN OF A DEWATERING BRAKE.
by
ii
A thesis submitted to the Faculty and the Board of Trustees of the Colorado School of Mines in partial fulfillment of the requirements for the degree of Doctor of Philosophy in Geological Engineering.
Golden, Colorado
Date ________________________
Signed:_____________________________ Holly Ann Brunkal
Signed:_____________________________ Dr. Paul M. Santi Thesis Advisor Golden, Colorado Date _______________________ Signed:_____________________________ Dr. Paul M. Santi Professor and Head Department of Geology and Geological Engineering
iii ABSTRACT
This dissertation presents the results of two lines of inquiry into the frequency and
magnitude of post-wildfire debris flows, and a third investigation into the design parameters for a debris-flow mitigation structure are presented as an advancement of the current body of
knowledge on the hazards and risks of post-wildfire debris flows, and the consideration of a potential mitigation design. Increasing areas burned by wildfire and increasing intense precipitation events with predicted climate change will produce a significant increase in the occurrence of post-wildfire debris flows in the western United States. A positive correlation is shown between an increase in wildfire area and number of debris flows. The probability of a debris flow occurring from a burned watershed is influenced by climate change. With
conservative model interpretation, post-wildfire debris-flow probabilities for individual drainage basins increase on average by 20.6%, with different climate scenarios increasing the probability of post-wildfire debris flows by 1.6% to 38.9%. A predictive debris-flow volume equation for the Intermountain West is influenced by factors that will be affected by climate change in the coming decades, and debris-flow volumes are calculated to increase with changing conditions by 3.7% to 52.5%. Understanding the future implications of increased incidence of wildfire-related debris flows will help agencies and communities better manage the associated risk.
Compilation of a database of debris-flow peak discharges (Q) allowed for a comparison with the expected basin discharge as computed using the rational equation, Q=CIA; where C= an infiltration coefficient, I is the rainfall intensity, and A is the area of the basin. The observed values of Q for debris flows in unburned and burned areas were divided by the computed Q values of runoff using the rational method. This ratio is the ‘bulking factor’ for that debris-flow
iv
event when compared with water flooding. It was shown that unburned and burned basins constitute two distinct populations for debris–flow bulking, and that the bulking factors for burned areas are consistently higher than for unburned basins. Previously published bulking factors for unburned areas fit the dataset in about 50% of the cases. Conversely, the bulking factors for burned areas that were found in the published literature were well below the increases seen in over half of the cases investigated in this study, and would result in a significant
underestimation of the peak discharge from a burned basin for the given rainfall intensity. Peak discharge bulking rates were found to be inversely related to basin area. Knowledge of the
potential increase to the peak discharge from a basin during a debris flow event will help workers better design conveyances and thus will reduce risk to proximal infrastructure.
While the first two studies address gaps in knowledge for design events, the third study considers the design elements in the debris –flow mitigation process. The investigation looks specifically at a mitigation structure whose design elements are not well-documented in the literature. A small-scale flume experiment was conducted to assess the design considerations for a horizontal dewatering debris flow brake. A design sequence, which was previously unavailable in the published literature, is developed from comparison to other mitigation design strategies and from results of laboratory flume experiments. It is concluded that the most important input parameters into the design of a debris-flow dewatering brake are the expected thickness of the debris flow deposit and the channel shape. The volume of debris that can be stopped and stored by this mitigation design is a function of the debris flow depth and the channel slope. The thickness of the debris that is arrested on the grate depends on the depositional properties of the debris-flow mass, such as the unit weight of the material, but was not affected by volume of the debris available. The ideal brake is a free-draining surface with an aperture smaller than the D90
v
value for the debris-flow grain size distribution. An easily implemented design that could be rapidly installed in the channel to reduce the velocity and volume of a debris flow is the goal of this dewatering structure. This design has the potential of being implemented in recently burned areas to reduce the debris-flow risk to areas downstream.
Evaluation of the hazard posed by and the potential risk of, a debris-flow event involves many variables. Two variables in risk assessment are the likelihood of an event happening and the severity of that event, in addition to the likely extent of the losses if a particular event takes place. This research shows that there is an increase in the likelihood of post-wildfire debris flows happening with climate change, and that the magnitude of debris –flow events, with respect to the peak discharge measurement, is more severe in a post-wildfire setting than in an unburned basin. Post-wildfire debris flow risk could be reduced for communities at the wildland urban interface by the implementation of a horizontal debris-flow dewatering brake.
TABLE OF CONTENTS
ABSTRACT ... iii
LIST OF FIGURES ... viii
LIST OF TABLES ... ix
ACKNOWLEDGMENTS ... x
CHAPTER 1 INTRODUCTION ... 1
CHAPTER 2 EXPECTED INCREASE IN POST-WILDFIRE DEBRIS FLOWS WITH CLIMATE CHANGE ... 6
2.1 Abstract ... 6
2.2 Introduction ... 6
2.3 Climate Models ... 12
2.3.1 Climate and fire models ... 14
2.3.2 Climate and precipitation models ... 17
2.4 Debris flow initiation in burned areas ... 19
2.5 Methods ... 21
2.5.1 Data acquisition, post-wildfire debris flows ... 22
2.5.2 Database analysis ... 23
2.5.3 Analysis of better-documented post-wildfire debris flows ... 23
2.5.4 Analysis of post-wildfire debris-flow probabilities ... 24
2.6. Results/Discussion ... 26
2.6.1 Data set analysis ... 28
2.6.2 Predicting post-wildfire debris-flow potential and volume estimates with climate change models ... 30
2.7. Conclusions ... 34
CHAPTER 3 CONSIDERATION OF THE APPLICABILITY OF DEBRIS-FLOW BULKING FACTORS... 36
3.1 Abstract ... 36
3.2 Introduction ... 36
vii
3.4 Debris flow peak discharge ... 44
3.5 Bulking factors for debris flows ... 47
3.6 Field measurement of debris-flow peak discharges ... 50
3.7 Research problem: rational equation Q vs. debris flow Q ... 52
3.8 Database construction ... 53
3.9 Database analysis and results ... 54
3.10 Discussion ... 59
3.11 Conclusions ... 62
CHAPTER 4 EXPLORATION OF DESIGN PARAMETERS FOR A DEWATERING STRUCTURE FOR DEBRIS-FLOW MITIGATION ... 64
4.1 Abstract ... 64
4.2. Introduction ... 64
4.3. Background ... 68
4.4. Scope ... 70
4.5 Design Criteria Evaluation ... 71
4.5.1 Literature review ... 71
4.5.2 Flume experimentation ... 76
4.2.3 Horizontal draining surface experiment ... 89
4.6 Scaling ... 92
4.7 Conclusions ... 94
4.8. Example Design – Chalk Cliffs, CO ... 95
CHAPTER 5 CONCLUSIONS ... 99
REFERENCES CITED ... 104
APPENDIX A POST WILDFIRE DEBRIS FLOW DATABASE ... 118
APPENDIX B DEBRIS FLOW PEAK DISCHARGE DATABASE ... 121
viii
LIST OF FIGURES
Figure 2.1 The increase of wildfires on USFS land (reproduced from Westerling et al.,
2006) ……….…..8 Figure 2.2 Comparison of rainfall thresholds for post-wildfire debris-flow initiation,
(reproduced from Cannon et al, 2008) ……….………...11 Figure 2.3 The relationship between number of acres burned in a wildfire and the number
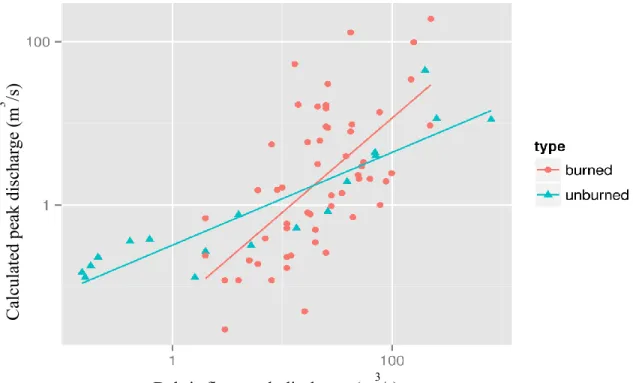
of debris flows………….………..30 Figure 3.1 Comparison of the measured debris flow peak discharges plotted against the
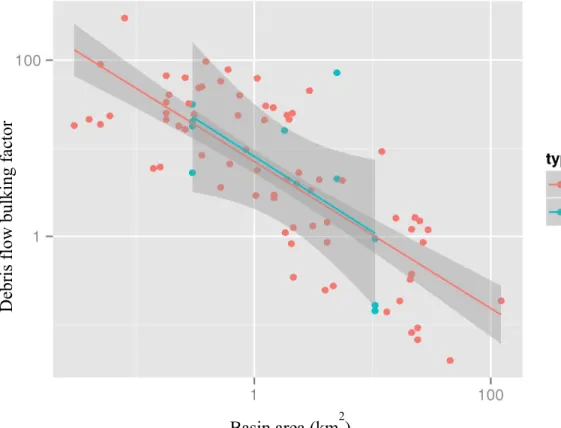
calculated value of Q using the rational equation …...……….…55 Figure 3.2 Basin area plotted against the debris flow ‘bulking factors’ (Qobs/Qcalc) …...56 Figure 3.3 A comparison of the range of debris flow bulking factors calculated for
unburned and burned area .………...………58
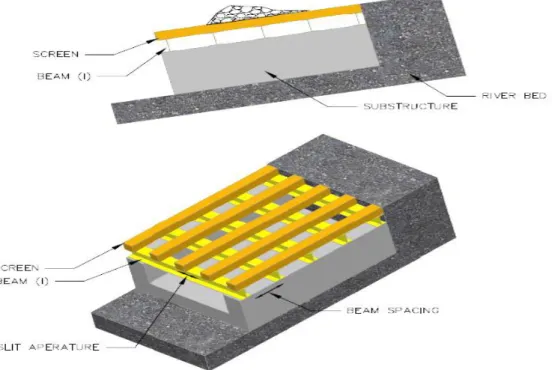
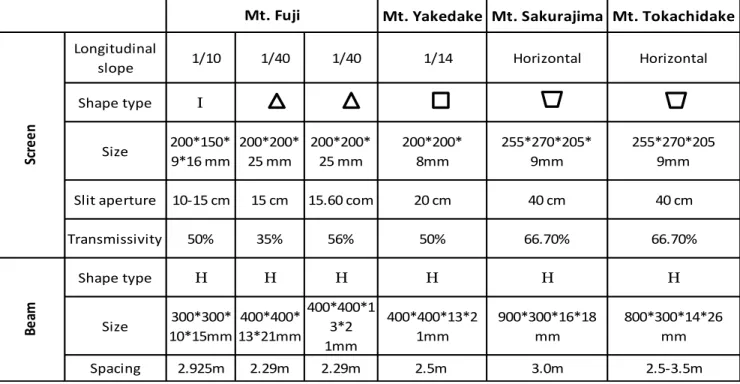
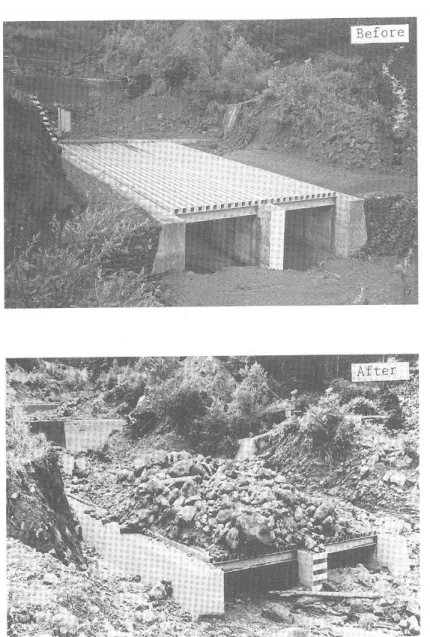
Figure 4.1 Longitudinal and cross-sectional schematic of a debris-flow dewatering break …..66 Figure 4.2 Photos of the successful use of a horizontal dewatering brake screen.….…………70 Figure 4.3 Small-scale flume equipment used to test the design of the debris-flow
dewatering grate …..………...……….….….79 Figure 4.4 Grain size distribution of material used in the flume experiments ………...82 Figure 4.5 Photographs of representative flume test results….………..84 Figure 4.6 The use of a horizontal screen and grated sidewalls for increased dewatering
effect and reduction in sidewall erosion (from Watanabe et al., 2008)…………...86 Figure 4.7 Relationship between the thickness of debris deposited on the horizontal
dewatering brake surface and the volume of debris delivered to the flume…..……87 Figure 4.8 Relationship of length of debris deposited behind the horizontal dewatering
brake surface and the volume of debris delivered to the flume………...88 Figure 4.9 Grain size distribution of debris material used in the horizontal sieve surface
tests ………...90 Figure 4.10 Thickness of debris deposited on a horizontal sieve surface vs. the volume of
debris delivered ……….………..………..……92 Figure 4.11 Example design of a debris flow dewatering brake, Chalk Cliffs, CO ………….…97
ix
LIST OF TABLES
Table 2.1 A subset of data focusing on well-documented post-wildfire debris flow areas …..25 Table 2.2 Evaluation of debris-flow probabilities from a hypothetical burned basin using
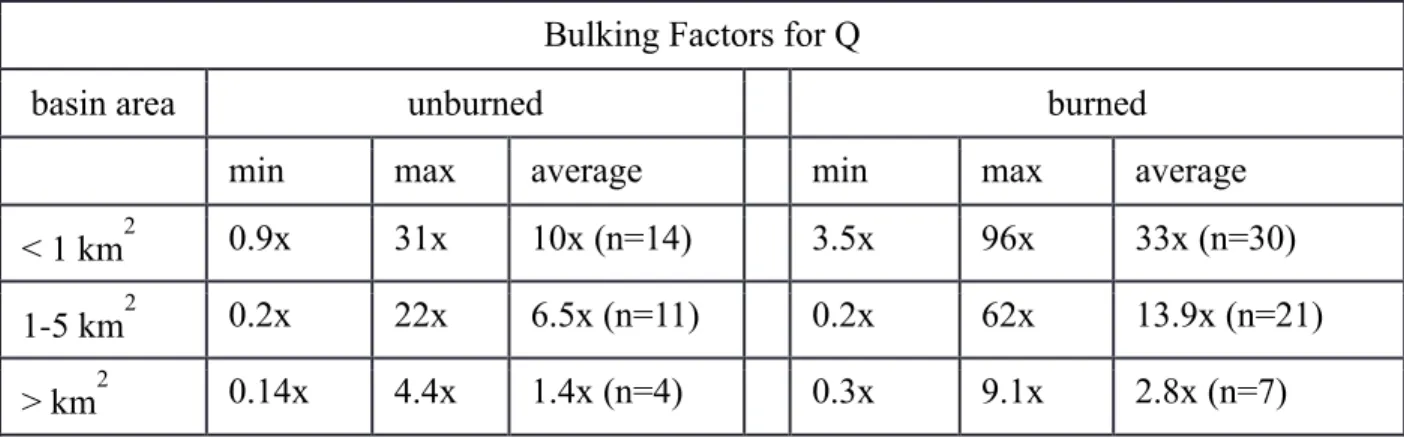
3 models …..……….……….33 Table 3.1 Comparison of calculated peak discharge bulking factors between unburned
and burned basins based on basin area…...……….………..58 Table 4.1 Specifications for 6 horizontal debris-flow brakes installed in areas of Japan.
(from Watanabe et al, 2008) ………..………...66 Table 4.2 Debris-flow characteristics, associated equations, and references used to
x
ACKNOWLEDGMENTS
I most importantly want to give my most sincere thanks to Dr. Paul Santi for his exceptional guidance, advice, patience, knowledge, support and willingness to work with me on this research project on debris flows. My other committee members; Dr. Jerry Higgins, Dr. Sue Cannon, Dr. Masami Nakagawa, and Dr. M. Ugur Ozbay were all amazing teachers and mentors for me, and made heroic efforts in editing my thesis. I appreciate their comments and the improvements they made to the manuscript overall.
I would also like to thank my many cohorts in the Geological Engineering department that were my classmates, and those that were part of our research group, and gave excellent help, advice and insight. Thanks also to the Colorado School of Mines as a whole for their support and many amazing opportunities.
I thank all my family and friends for their patience and support while I completed this project. I especially thank my husband, Joel Scott, for his continued encouragement and love.
With much appreciation I was supported in my PhD work by the U.S. Department of Education GAANN Fellowship Award.
1
CHAPTER 1 INTRODUCTION
Debris flows are fast moving viscous slurries of water, sediment, and other debris that can move rapidly down a channel and spread out, once unconfined, and inundate areas of an alluvial fan or valley floor. Debris flows can travel at high velocities ranging up to 31 meters per second (69 mph) (Rickenmann, 1999) and exert great impulsive loads on objects in their paths. These flows are capable of washing out roads and bridges, destroying homes and other buildings, sweeping away vehicles, knocking down trees or power lines, and damming streams and
obstructing roadways with thick deposits of mud and rocks. When debris flows inundate areas of human development they can cause fatalities and extensive damage. Because of the entrainment of increased sediment loads, debris flows often worsen the effects of flooding and cause their own set of hazards by rafting large boulders at their fronts. Typically initiated by periods of heavy or intense rainfall or rapid snowmelt or a combination of these, debris flows can occur with little warning. Debris flows pose a significant hazard worldwide, from steep mountainous terrain such as the Alps, or volcanoes of Japan, to the varied landscapes of the Western United States. Because of the substantial impacts debris flows it is crucial to understand the hazard, and better define the risk associated with these events.
Risk assessments at their very simplest are a qualitative definition of the various threats and determination of the extent of vulnerabilities and the consideration of countermeasures should an event occur. A quantitative risk analysis is an attempt to numerically determine the probabilities of various adverse events (hazards) and the likely extent of losses if a particular event takes place. Debris-flow hazards are influenced, and can be intensified, by several factors including wildfire, human modification to the landscape, and climate change. Debris-flow risk is influenced by the
2
frequency and magnitude of the hazard as well as the appropriateness of the design elements in place; bridges, culverts, roads, homes, or specific mitigation design. There is an increasing risk to humans as populations are moving onto alluvial fans, where debris flow energies are usually dissipated and materials are deposited naturally. These communities built at the WUI are at an increased risk because of location, and are in some cases exacerbating wildfire cycles. A comprehensive risk assessment for debris flows in marginal communities should include a contingency for change in the landscape over the lifetime of the development including land use, vegetation, and climate changes.
This investigation combines three research avenues to help advance the assessment of the risks associated with debris flows and specifically post-wildfire debris flows. The risk elements that are explored are; 1) flow frequency, specifically the increase in post-wildfire debris-flow frequency in the coming decades that can be attributed to climate change, 2) debris debris-flow magnitude, as defined by the peak discharge of a debris-flow event in comparison the peak discharges expected with a flood flow, and 3) risk reduction potential mitigation design that when tested on a laboratory flume scale is effective at arresting debris-flow volumes. All three elements of this research improve the current knowledge on debris flow hazard and risk by implementing novel approaches to the interpretation of debris-flow data. These questions have not been addressed in the published literature before, so this research provides novel interpretation and previously unconsolidated data sets.
Investigation into past debris flow frequency, magnitude, and mitigation design were invaluable in this research. Debris-flow frequency (e.g., Van Steijn, 1996; Bovis and Jakob, 1999; Jakob and Hungr, 2005; and Stoffel et al., 2005 ) and post-wildfire debris-flow studies (e.g., Cannon et al., 2003; Giraud and McDonald, 2007; Moody et al., 2008; Wells, 1987; and Scott,
3
1971) informed this research, and greatly enhanced the extrapolation of the increase in debris-flow probability with climate change especially in the Western U.S. Debris-flow magnitudes are most often reported in the literature as a function of the total volume of debris produced during a debris-flow event. Frequency and magnitude relationships are generally given in the expected volume produced from a basin per given time frame (e.g., Marchi et al., 2002; D’Agustino and Marchi, 2002; Jakob and Hungr, 2005; and Hurlimann, 2003). Magnitudes are also explored as a function of the rainfall event that triggered the debris-flow. These rainfall intensity-duration studies were also invaluable in assessing the runoff and peak discharges from particular storm events (e.g., Caine, 1980; Wieczorek, 1987; Chien-Yuan et al., 2005; Jakob and Hungr, 2005; Marchi et al., 2002; Coe et al., 2008; and Cannon and Gartner, 2005). Lastly, debris-flow mitigation design is well represented in the literature in both laboratory-scale tests (e.g., Egashira et al., 2001; Armani and Larcher, 2001; Lien, 2003; and Liu, 1996) and implementation in the field (e.g., Ikeya, 1989; Hubl et al., 2005; Jaeggi and Pellandini, 1997; Okubo et al., 1997; and VanDine, 1996). The laboratory testing and mitigation design strategies presented by various researchers helped to inform the research in this study.
Research into the increasing frequency of debris flows with climate change in the coming decades in the intermountain west is presented in chapter 1 of this dissertation. The purpose of this project is to provide a quantitative means for predicting the increase in the number of post-wildfire debris flows that can be expected to occur with climate change. Using the historical relationship of area burned and number of debris flows generated, data is coupled with available predictions from climate models to advance the future hazard prediction of wildfire-related debris flows. The scope of this research was to review wildfire-related debris-flow histories to demonstrate the relationship of area burned to number of debris flows generated, and then to use climate model predictions of
4
wildfire season and rainfall to provide a quantitative analysis of debris-flow occurrence with various models of climate change, wildfire season, and precipitation delivery.
A peak discharge comparison was made between debris-flows from burned and unburned areas and the calculated value of peak discharge using the rational method. This debris-flow magnitude assessment is presented in chapter 2 of the dissertation. Debris flows from small basins can generate a peak discharge in the channel that is many times the peak discharge that would be calculated by using the rational equation, Q=CIA, for a clear water flood. This ‘bulking factor’ for debris flows is a value that can help designers build more appropriate infrastructure and hazard mitigation strategies. With a large database of debris flow peak discharges, statistical analysis provides a reasonable ‘bulking factor’ that can be applied to basins that are vulnerable to debris flows, especially those burned by wildfire. The scope of the research included a thorough literature review of available peak discharge data for debris flows that have been observed and recorded. The debris-flow data was analyzed statistically to show if a bulking factor can be used in cases of burned and unburned basins.
Frequency and magnitude relationships for debris flows are instrumental in assessing and creating mitigation strategies. One mitigation strategy that is often presented in the literature as a viable design is a horizontal dewatering brake structure. However, little is published about the design parameters and effectiveness of the idea. A small-scale flume experiment was undertaken to examine the effectiveness and simple design elements needed for a dewatering brake and is
presented as Chapter 3 of this dissertation. Although not a novel design idea the small-scale testing and design considerations that were analyzed are new to the literature. The scope of this research was a literature review of current debris-flow mitigation structure design and debris-flow flume experiments, as well as the design of a small-scale flume test of a debris-flow dewatering brake.
5
The scale model flume experiment provided data for optimization of the length and aperture of the slit openings of the structure.
These areas complement each other and advance the knowledge of post-wildfire debris flows in frequency and magnitude prediction and mitigation strategies. The three topics tie
together as post-wildfire flow analysis, providing a prediction of future post-wildfire debris-flow numbers, prediction of peak discharge expected from burned basins, and a potential
6 CHAPTER 2
EXPECTED INCREASE IN POST-WILDFIRE DEBRIS FLOWS WITH CLIMATE CHANGE
2.1 Abstract
Increasing area burned by wildfire and increasing intense precipitation events with
predicted climate change will produce a significant increase in the number of post-wildfire debris flows in the western United States. A positive correlation is shown between an increase in wildfire area and numbers of debris flows. The probability of a debris flow being generated from a burned watershed is influenced by climate change and with conservative model interpretation
post-wildfire debris-flow probabilities on average by 20.6%, with different climate scenarios increasing the probability of post-wildfire debris flows by 1.6% to 38.9%. A predictive debris-flow volume equation for the Intermountain West is also influenced by factors that will be affected by climate change in the coming decades, and debris-flow volumes are calculated to increase with changing conditions by 3% to 52.5%. Understanding the future implications of increased incidence of
wildfire-related debris flows will help agencies and communities better manage the associated risk.
2.2 Introduction
Post-wildfire debris flows are a hazard that can be destructive to property and infrastructure for a significant time after a fire has burned an area. In burned areas, debris flows can be triggered by low-recurrence-interval rainstorms and can inundate areas downstream within a matter of
7
minutes. The number of post-wildfire debris flows is expected to increase with increased area burned by wildfire, and changes in precipitation patterns caused by climate change. For agencies concerned with emergency response and communities that reside in the potential path of post-wildfire debris flows, an indication of how this number will change over the coming decades will assist in the hazard and risk assessment in the post-wildfire setting.
The connection between climate change in the last half of the twentieth century and the length of the wildfire season has been addressed by multiple authors in the published literature, most notably Westerling et al. (2006). They note that wildfire activity increased suddenly and markedly in the mid-1980’s, with higher large-wildfire frequency, longer fire durations, and longer wildfire seasons, strongly associated with increased spring and summer temperatures, as seen in the graph in Figure 2.1.
The connection of climate change to the lengthening and intensification of the wildfire season, specifically in the western U.S., has also been highlighted recently in popular media outlets such as Rolling Stone Magazine (“The Great Burning: How Wildfires are Threatening the West”;
Aug. 2013), The Christian Science Monitor (“Colorado Fire: Is Global Warming one of the Culprits?”; June 2013), USA Today (“Climate Change Increasing Massive Wildfires in the West”; April 2014), Salon.com (“Feds: Wildfire Season is expected to go way over budget and climate change is to blame”: May 2014), Time.com (“Southern California blaze kicks off what could be especially dangerous wildfire season”, May 2014), the Associated Press (“Federal report: climate change increasing wildfire, water supply, and other risks in Northwest”, May
8
Despite this recent flurry of media coverage, a review of published literature reveals that the connection between increases in wildfire, both frequency and size, and climate change is not a new one. The climate, drought and fire connection was becoming emphasized after the devastating fires in Yellowstone National Park in 1988 (Meyer et al., 1992; Balling et al., 1992; Millspaugh et al., 2000). In 1994, an article in the Journal of Climate concluded that, in a modeled scenario of 2 times atmospheric CO2, lightning-caused wildfires would increase by 44%, area burned would
increase by 78%, and all western states would see an increase in lightning-caused wildfires (Price and Rind, 1994). Grissino-Mayer et al. (2004) conclude that fire severity, frequency and extent are expected to change dramatically in the coming decades in response to changing climatic
conditions. Littell et al. (2009) states that the total area burned by wildfire, in any given year, is directly related to climate through the influence on fuels production and drying of vegetation. They
40 42 44 46 48 50 52 54 0 20 40 60 80 100 120 140 160 180 1970 1975 1980 1985 1990 1995 2000 2005 2010 s p ri n g a v e ra g e te m p e ra tu re ( °F) Annu al fi res ov er 10 00 ac res year
Annual fires (>1000 acres) ave spring temp (°F) Linear (ave spring temp (°F))
Figure.2.1 The increase of wildfires on USFS land over 1000 acres plotted with the annual spring average temperature for the western U.S. The relationship between increasing wildfire numbers and increasing temperature in the western U.S. is shown. Reproduced from Westerling et al., 2006, and ClimateCentral.org.
9
conclude that the area burned by wildfire, despite the influence of fire suppression, exclusion, and fuel treatment, is substantially controlled by climate. Their conclusion that weather and climate are the most important factors influencing fire activity is also supported by Flannigan et al. (2005) and Morgan et al. (2008). The assertion that future warmer temperatures will increase burned area and contribute to an earlier start to a longer wildfire season is strongly supported in the scientific literature.
The dangers of increased wildfire in the West seem immediate and easily defined: smoke and pollution, destruction of timber, forage and wildlife habitat, and impacts to water quality. An increase in population living at the wildland urban interface (WUI) increases the number of homes and property in danger of being destroyed by wildfire, as well as incidences of human caused ignitions. However, post-wildfire hazards are not as readily defined or as widely discussed in popular media outlets, although it has been shown in many cases throughout the western U.S. that landscapes burned by wildfire are especially prone to producing large run-off events including floods, hyperconcentrated flows and debris flows (e.g., Cannon et al., 2003; Giraud and
McDonald, 2007; Moody et al., 2008; Wells, 1987; and Scott, 1971). Within the first few years after a fire, intense precipitation (typically brief summer convective storms or cells of high intensity rainfall in winter storms) produces runoff from bare, burned slopes, with progressive sediment bulking on slopes and in channels (Meyer et al., 2001). These post-wildfire debris-flow events also threaten communities and infrastructure at the WUI. For example, the 2009 Station Fire in Southern California burned 160,000 acres, 58 homes were lost in the fire and 73 homes were lost to subsequent debris flows that were initiated by a winter rain storm (Burns et al., 2011).
Climate-change models show an increase in temperatures that will lead to more wildfires, but they also show a significant change in the precipitation patterns that are known to initiate
post-10
wildfire debris flows. Regional scale climate models predict that the change in the precipitation patterns across North America will deliver rainfall in more intense storms. It has been documented that precipitation has already changed across North America in the 20th century. Data shows that since 1910 precipitation has increased by about 10%, and this change is reflected primarily in the heavy and extreme daily precipitation events (Karl and Knight, 1998). Models presented by Meehl et al. (2000) predict that precipitation extremes will increase, resulting in a decrease in the return period for 20- year extreme precipitation events almost everywhere. This will, for example, reduce the return period of 20- year extreme precipitation events to 10 years over North America. Heavy rainfall events have become more frequent over the past 50 years, even in locations where the mean precipitation has decreased or is unchanged (Chen and Knutson, 2008). Allen and Soden (2008) believe that this amplification of rainfall extremes is actually larger than that predicted by models, implying that projections of future rainfall extremes in response to anthropogenic global warming may be underestimated. These findings are significant for debris flow initiation, as Cannon et al. (2008) shows that post-wildfire debris flows require only short recurrence interval storms to propagate. Figure 2.2 shows some rainfall intensity and duration thresholds for the initiation of debris flows in burned basins in the western U.S., graphed with threshold values for floods from burned basins and debris flows from unburned basins throughout the world. The figure illustrates that in areas burned by wildfire, the threshold rainfall that can trigger debris flows is much lower (colored lines) than the majority of rainfall thresholds reported for unburned basins (gray lines).
11
Although a connection between climate change and the increase in wildfires and post-wildfire debris flows has been suggested in the literature by Cannon and DeGraff (2009), there has not yet been a quantitative study that links the area burned by wildfire to the number of debris flows generated. Meyer et al. (2001) suggest that periods of heightened debris-flow and flood activity in the Ponderosa pine environment of central Idaho are associated with increased
incidence of large stand-replacing fires, followed by intense thunderstorms or unseasonably warm winter or spring storms with rapid snowmelt. They hypothesize that these types of events may all increase in frequency with a warming climate, but do not quantify by how many, or how often. There is a need to evaluate quantitatively the effects of climate change on wildfire, precipitation,
Figure.2.2 Comparison of rainfall thresholds for post-wildfire debris-flow initiation (colored lines) vs. unburned settings (gray lines). This graph shows thresholds developed for areas in the western U.S. burned by wildfire, and worldwide unburned debris-flow initiation (Cannon et al., 2008). The graph shows that the threshold event for initiation of a debris flow in a burned area is lower than most of areas that produced debris flows from unburned watersheds. Reproduced from Cannon et al, 2008.
12
and the resulting debris-flow hazard. Although global climate-change models are at a coarse resolution, and regional scale models are not perfected at this time, there are several models that show reasonable outcomes on applicable scales that can be used to provide a range of future possibilities for temperature and rainfall events.
The scope of this project is to review wildfire-related debris flow histories to demonstrate the relationship of area burned to number of debris flows generated, and then use climate model predictions of wildfire increases and rainfall changes to provide a quantitative analysis of debris-flow occurrence with various models of climate change, wildfire intensity and precipitation delivery. The goal of this research is to quantify, within a reasonable prediction range, the
expected increase in number of debris flows from recently burned basins in the intermountain west of the United States. Increase in probability of a debris flow occurring in a burned basin and the increase in the volume of debris produced from burned basins under climate-change conditions are calculated. Statistical techniques are used to begin to establish a quantifiable and predictive
relationship between acres burned per wildfire season and number of debris flows expected to be generated in the post-wildfire precipitation events.
2.3 Climate Models
In this preliminary investigation into the effects of climate change on post-wildfire debris flow numbers, we examined the published literature for analysis of current climate change models, and the predicted changes to wildfire and precipitation occurrences in the western U.S. Climate change models are improving in their resolution and accuracy with increasing data inputs and with better definition of boundary conditions. Two main model types exist, General Circulation Models
13
(GCM) and Regional Climate Models (RCM); these are used for different modeling scenarios, and are available from sources such as the National Center for Atmospheric Research
(http://ncar.ucar.edu/) and the Hadley Centre for Climate Science (http://www.metoffice.gov.uk/publicsector/climate-programme).
A GCM is a numerical model representing the physical processes in the atmosphere, ocean, cryosphere and land surface. GCMs are the most advanced tools currently available for simulating the response of the global climate system to increasing greenhouse gas concentrations
(http://www.ipcc-data.org/). Coupled atmosphere-ocean global climate models (AOGCMs) are the modeling tools traditionally used for generating climate change projections and scenarios.
AOGCMs depict the climate on a coarse resolution of 250-600 km, so many physical processes that occur on a smaller scale cannot be modeled unless used in conjunction with nested regional models. These nested models have the potential to provide geographically and physically consistent estimates of regional climate change that are required in impact analysis.
RCMs provide a higher spatial/temporal resolution and are often a better representation of some weather extremes than GCMs. What is commonly referred to as nested regional climate modeling technique consists of using output from global model simulations to provide initial conditions and time-dependent lateral meteorological boundary conditions to drive high-resolution RCM
simulations for selected time periods of the global model run. Sea surface temperature (SST), sea ice, greenhouse gas (GHG) and aerosol forcing, as well as initial soil conditions, are also provided by the driving AOGCM (Mearns et al., 2003). These regional climate simulations can be applied to the prediction of fire conditions and regional precipitation patterns.
Another technique for obtaining regional predictions is statistic or dynamic downscaling; this provides high spatial resolution information in non-uniform regional climate models (Mearns
14
et al., 2003). There is a potential with this technique to address a diverse range of variables. One of the primary advantages of these techniques is that they are computationally inexpensive, and thus can be easily applied to output from different GCM experiments. Another advantage is that they can be used to provide specific local information (e.g., points, catchments), which in many climate-change impact studies is the most applicable outcome. The applications of downscaling techniques vary widely with respect to regions, spatial and temporal scales, type of predictors and predictands, and climate statistics, and there are disadvantages such as assuming consistency of empirical relationships in the future (Mearns et al., 2003). Fowler et al. (2007), Maraun et al. (2010), Chen and Knutson, (2008) are a few examples of publications that provide a thorough review and assessment of different downscaling techniques and their application to hydrological modeling. These studies address ultimately how model data inputs and results can be best used to enable stakeholders, managers and other end users of the climate models to make informed robust decisions on adaptation and mitigation strategies.
There is an extensive library in the published literature on climate model types, the use and effectiveness of climate models, and their general applicability. It is not the purpose of this paper to review all methods, benefits and limitations of global and regional scale climate models. The selected models used to assess potential future scenarios for post-wildfire debris flows and the methods applied are discussed below.
2.3.1 Climate and fire models
Fire frequency, severity and burned area extent have been shown to be increasing in the last half of the 20th and first decade of the 21st century. Climate Central
15
(http://www.climatecentral.org/) has compiled and made available to the general public the results of historical data analysis for temperature and fire area, as well as numbers of large wildfires in the western U.S. The 2012 summary of western wildfires by Climate Central provides a review of the length of wildfire season and the climatic factors affecting it, including increasing temperatures and the resulting earlier spring snowmelt. Climate models consistently predict that the Western U.S. will get hotter and drier, and with this the fire season will get longer and the amount of area burned each year will increase.
Flannigan et al. (2000) uses two transient GCMs (the Hadley Centre and the Canadian GCM) to estimate fire season severity in the middle of the century for North America. Fire Season Severity Rating (SSR) is an index to examine changes in fire severity recognizing that the fire regime at any given location is the result of complex interactions between fuel, topography, ignitions and weather. The SSR is a component of the Canadian forest fire weather index, and is essentially the seasonal mean of the daily estimate of the control difficulty of a potential fire, in generalized fuel types. The fire severity assessment is a proxy measurement of the potential intensity of a fire. The fuels moisture models form the core of the fire weather index, with consideration of multiple other fire-related factors. Both of the GCMs used by Flannigan et al. (2000) suggest an increase in SSR of 10-50% across much of North America by 2060. They research conclude that the fire season will start earlier in the year and extend longer into autumn, resulting in universal increases in area burned and fire intensity/severity.
Brown et al. (2004) employ a high-temporal resolution meteorological output from the Parallel Climate Model (PCM) to assess changes in wildland fire danger across the western U.S. due to climatic changes in the 21st century. The authors compare the base period (1975- 1996) to predicted outputs from the GCM using the USDA/USFS National Fire danger rating system
16
(NFDRS), which focuses on the Energy Release Component (ERC), an indicator of fire severity (amount and extent of fire) and fire business (decisions, economies, treatments). Changes in
relative humidity, especially drying over much of the West, are projected to increase the number of days of high fire danger in comparison to the base period. The research presented shows that the climate models used can be applied to future fire danger evaluation, and that nearly the entire western U.S. is projected to experience increases, by as much as two weeks, in the number of days that the threshold for large expensive fires is exceeded.
Fried et al. (2004) present research using GCM output to estimate the impact of climate change on wildland fire in Northern California. The Changed Climate Fire Modeling System (CCFMS) models potential fire behavior based on weather, fuel conditions, and slope for the historical weather and the climate change scenario. This model bridges the differences in the spatial and temporal scales of climate model output and historical fire data to model fire behavior, fire suppression, and outcomes of individual fires. Conclusions indicate that warmer and windier conditions corresponding to a 2xCO2 scenario produce fires that burned more intensely and spread
faster in most locations. Changes in area burned were on average increased by 5000 hectares. The best-case forecast from this study is a 50% increase in area burned and an over 100% increase in fire escape frequency. Representative fires were modeled to arrive at precise estimates of the frequency of escapes and other statistics that cannot be estimated by modeling average fire characteristics. For the northern California region, it was shown that there is an expected 34% increase in area burned from fires in grass and brush, and a 65% increase in area of oak woodland burned under climate change conditions in the near future (Fried et al., 2004).
17 2.3.2 Climate and precipitation models
Far more abundant in the published literature are studies that seek to model the changes in precipitation and the hydrologic cycle with changing climate. Water resource availability, drought, and changes in rainfall and snow accumulation are important considerations for the western U.S., these factors affect wildfire scenarios as well as post-wildfire runoff and erosion, including debris flows. Changes to precipitation patterns have been documented for the past decades, and are expected to change in the coming decades with an increase in atmospheric CO2. Trenberth et al.
(2003) substantiate that the incidence of heavy rainfall has steadily increased at the expense of moderate rainfall events throughout the 20th century, and on the basis of evaporation and temperature relationships, they conclude that all weather systems, from individual clouds and thunderstorms to extratropical cyclones, are likely to produce correspondingly enhanced
precipitation rates with increased atmospheric CO2. Meehl et al. (2000) find that early models that
show global increase in precipitation are supported with consistent results from newer models; precipitation extremes increase more than the mean, resulting in a decrease in return period for 20-year extreme precipitation events almost everywhere (e.g. to 10 20-years over North America).
Leung et al. (2004) use a regional scale climate model to assess the impacts of climate change on the western U.S. In their research they use The Penn State/NCAR Mesoscale Model (MM5) to downscale the original NCAR/DOE Parallel Climate Model (PCM). This strategy yields ensemble regional climate simulations at 40km spatial resolution for the western U.S. Results from this model show an average warming of 1-2.5 Celsius, and an increase in cold season extreme daily precipitation by 5-15 mm/day (15-20%) along the Cascades and Sierra. The overall warming in the west will result in increased rainfall at the expense of snowfall. The conditions
18
caused by warmer temperatures, such as less snow for spring runoff, reduced soil moisture in the summer, and more intense precipitation are all common model outputs for the western U.S.
Dynamic downscaling presented by Kim (2005) is used as a means to predict the effects of climate change on extreme hydrologic events in the western U.S. To obtain regional scale climate change signals, Kim (2005) uses two GCMs downscaled using a RCM employed for dynamic downscaling. This model was found to show good agreement in hindcast without significant biases on the projected climate change signals. The conclusions of this model evaluation suggest that heavy precipitation events are likely to increase under increased CO2 climate conditions, most
notably in the mountainous regions along the Pacific Ocean and the Sierra Nevada, and the largest increases in heavy and extreme precipitation occur during the fall and winter. The important relationship demonstrated is that both the number of wet days and the mean intensity of each event will increase, causing the precipitation-intensity frequency distributions to shift toward higher values.
Models used for flood risk and streamflow timing in the western U.S. are presented by Hamlet and Lettenmaier (2007) and Hidalgo et al. (2009), respectively. These papers explore the differences in observed shifts in the delivery and timing of precipitation, and the model predictions for changes across the western U.S. Both studies show that climate change and variability will affect drainage basins by increasing rain events, decreasing snow pack, and increasing flood risk over much of the West. They also note that evolving flood risks will impact design standards, flood-inundation mapping, and water planning and will also result in substantial changes to sediment transport and channel formation processes.
Nearing (2001) takes a soil conservation approach to the changing delivery of precipitation with an evaluation of rainfall erosivity using climate models. The research presented uses two
19
coupled Atmospheric-Ocean Global Climate Models (UK Hadley Center and the Canadian Centre for Climate Modeling and Analysis) as the basis for change in rainfall delivery and the Revised Universal Soil Loss Equation to calculate potential soil erosion rates. Conclusions from this research show that warmer atmospheric temperatures will lead to a more vigorous hydrologic cycle including more extreme rainfall events.
The published literature provides many types of models and predictive methodologies for precipitation under climate change conditions both globally (e.g. Meehl et al., 2000; Trenberth et al., 2003; Kharin et al, 2007; Allan and Soden, 2008) and regionally (e.g. Kim, 2005; Snyder and Sloan, 2005; Bell and Sloan, 2006; Chen and Knutson, 2008). The majority of the model outputs show an increase in precipitation that is delivered as higher intensity rainstorms. This has been a measured trend across the western U.S. in the past decades and is expected to keep trending to more extreme cases with increased atmospheric CO2.
2.4 Debris flow initiation in burned areas
The relationship between wildfires and debris flows is well established (Spittler, 1995; Cannon, 2001; Cannon and Gartner, 2005; Shakesby and Doerr, 2006; Cannon et al., 2010), and the reasons that debris flows are common in burned basins are also well described in the literature (Wells, 1987; Wondzell and king, 2003; Shakesby and Doerr, 2006). Areas that have been burned by wildfire are susceptible to debris-flow initiation because of several factors, including decreased rainfall interception by vegetation, decreased soil infiltration capacity and stability, and the
potential for hydrophobic layers at shallow depths that promote run-off and rilling (Moody and Martin, 2001, Ebel and Moody, 2013). Post-wildfire debris flows are most common in the first
20
two-years after a fire (Cannon et al., 2003) and are usually triggered by short duration, high-intensity rainfall.
Post-wildfire debris flows often occur with little antecedent moisture and generally have no identifiable initiation source, such as a distinct landslide scar (Cannon et al., 2008). Short-duration, high intensity convective storms with recurrence intervals of two years or less have been shown to create a debris-flow response from burned basins in the Western U.S. Frontal storms are also shown to trigger debris flows with low-intensity, longer -duration rainfall, still with a recurrence interval of less than two years (Cannon et al., 2008). The threshold rainfall conditions for floods and debris flows from burned areas are lowest in the first two years following the fire and then increase as fire recovery begins (Gartner et al., 2004). In southern California as little as 7 mm of rainfall in 30 minutes has triggered debris flows, and any storm that has intensities greater than about 10 mm per hour is a risk of producing a debris flow (USGS fact sheet 2005-3106). Debris flows were produced from 25 recently burned watersheds in Colorado in response to 13 short-duration, high intensity convective storms and after as little as 6 to 10 minutes of storm rainfall (Cannon et al., 2008). Cannon (2001) shows that of 95 post-wildfire areas studied, 37 drainages produced debris flows, and of those 23 were considered the more destructive type that transport materials up to and including boulders. These destructive types of erosional responses from burned areas are the focus of this study because of the potential impacts with an increase in number of events.
The emergency assessment of the debris-flow hazards from drainage basins burned by wildfires has been refined and used in many instances by the U.S. Geological Survey (Cannon et al., 2010; Staley, 2013 and 2014; Staley et al., 2013; Skinner, 2013) and BAER (Burned Area Emergency Response) teams (DeGraff et al., 2007). Empirical models, that can be used to
21
calculate the probability of debris-flow production from individual drainage basins in response to given storms, have been developed from data from burned areas in the intermountain west; Cannon et al. (2010) describes the development of a logistical regression multivariate statistical model for estimating debris flow probability. The analyses consider and evaluate a set of independent variables that potentially characterize runoff processes in burned basins including: basin gradient, basin aspect, burn severity distribution within the basin, soil properties, and storm rainfall conditions. Cannon et al., (2010) identified 5 statistically significant multivariate models that incorporate the variables most strongly correlated with debris-flow occurrence. The
percentage of the basin burned at a combination of high and moderate severity and the average storm intensity were significant in every model. The 5 models provide varying results for specific locations so application of the correct model to the correct area is important for the most applicable results. These probability models can be applied to assess the changes likely in debris-flow
probability due to climate change and the increase in area burned at high severity and rainfall intensities.
2.5 Methods
This section explains the data acquisition and analysis for the understanding of the relationship of post-wildfire debris flows and fire area.
22 2.5.1 Data acquisition, post-wildfire debris flows
Records of wildfires that produced debris flows in western North America, specifically including Washington, Oregon, Idaho, Montana, Utah, Arizona, New Mexico, California and Colorado as well as data from British Colombia, Canada were compiled into a database using published reports, other wildfire studies, and information that was available online and in news reports. The main sources for data in the final catalog of post-wildfire debris-flow events included a USGS open file report that compiles post-wildfire run off data
(http://pubs.usgs.gov/of/2004/1085/Database.htm, Gartner et al., 2004 ), the Interagency Fire Center (http://www.nifc.gov/fireInfo/fireInfo_statistics.html ), and Riley et al. (2013), who
compiled debris-flow data for a worldwide comparison of frequency-magnitude distribution. Other events were found through various news reports of ‘mudslides’ that had occurred after a fire; in these cases the event was only recorded as a debris flow if the report mentioned mud, debris, and boulders. In cases where a report mentioned post-wildfire debris flows but was non-specific regarding the number of debris flows generated, it was recorded in the database as one single debris-flow event, to provide a conservative data point. Attributes that were collected for analysis include: fire size in acres burned and number of debris flows produced from that burned area. In most cases the record of the intensity of the initiating rainfall was not available or was generalized as a ‘strong’ storm, or intense ‘cloud burst storm’. The resulting data set (DS1) is small and likely incomplete, containing 50 fires and 355 individual debris-flow events, and only spanning a time frame of 40 years (Table A-1). Nevertheless, it provides a reliable starting point to judge the potential change in debris-flow occurrence.
23 2.5.2 Database analysis
Statistical analysis was performed to establish if the total compiled dataset, DS1, could demonstrate a significant relationship between wildfire burned area and number of debris flows generated. The first statistical test was to establish if acres burned explains the number of debris flows within this dataset. Other statistical tests involved examining the log-log relationship,
regression analysis, non-parametric correlation, and time-dependent analysis for both fire area, and numbers of debris flows independently.
2.5.3 Analysis of better-documented post-wildfire debris flows
After a thorough literature review and consideration of the biases in reporting and recording of post-wildfire debris flows it was concluded that a subset of the total collected data may better represent the actual number of debris flows that are generated per fire area. This subset, DS2, includes 16 cases considered to be better-documented fire areas (Table 2.1). These specific cases were chosen to represent a more accurate data set because in each case researchers have gone into the field to map, monitor, and document the erosional responses of the total fire area. These better-documented areas record a higher accuracy for the total number of debris-flow events or basins producing debris flows, and not just those that had an impact on infrastructure or property. Although considered better-documented overall, in some cases multiple debris flows from a single basin may be considered a single debris-flow record, therefore this data set records minimum numbers for individual debris flows from a burned area, and thus a conservative record of number
24
of debris flows overall. This subset includes fires that span a time frame from 1994 to 2010. Statistical analysis of this data included a linear mixed effect model that takes into account the random effects for intercept by state. The log-log fit was done by REML with an Akaike Information Criterion (AIC). This analysis provides a method to account for variability by location.
2.5.4 Analysis of post-wildfire debris-flow probabilities
To assess the potential changes in debris-flow occurrence with climate change and the change in debris flow volumes expected, a hypothetical basin was created as an average from data collected for 16 basins burned by the Hat Creek Fire in Idaho, in 2003 (Cannon et al., 2010). These average basin values were used in three predictive model equations from Cannon et al., (2010) to establish the baseline numbers from which to measure the percent increase in debris-flow
probability and debris-flow volume with climate change. This strategy was employed because using the model coefficients with a 1 in the variables place did not produce usable values for comparison; a baseline value was created from the ‘average’ basin data. The variables averaged from the Hat Creek Fire basins were basin area with gradient greater than 30%, basin ruggedness, percentage clay content and liquid limit of the soil, percent area burned at moderate and high severity, and rainfall intensity. The latter two variables were the two values changed based on the percentage increase with predicted climate change values. These baseline average values were also used to calculate the percent increase in predicted debris-flow volumes from a hypothetical basin with the increased burn area and rainfall intensity values.
25
Table 2.1 DS2, A subset of data focusing on well-documented post-wildfire debris flow areas. These specific areas were measured and monitored, post-wildfire, to assess the drainage basin response. This data set was deemed more reliable, although it has a limited number of regions and authors represented, because the reports record all debris-flow events and not just those that had impacted humans.
Table 2.1 Well-studied post-wildfire debris flow areas State Year of
debris flows
Name of Fire/Complex Acres burned Minimum basins known to have produced debris flows Number of debris flows/acres burned
CO 1994 South Canyon/Glenwood¹ 2115 6 2.837E-03
NM 1996 Dome Fire¹ 16516 1 6.055E-05
CA 1997 Baker Fire¹ 6150 1 1.626E-04
MT 2000 Bear/Bitterroot Complex² 300000 35 1.167E-04
NM 2000 Cerro Grande Fire³ 47650 5 1.049E-04
CO 2002 Coal Seam Fire⁴ 12200 15 1.230E-03
UT 2002 Mollie (2001)⁵ 8000 10 1.250E-03
CO 2002 Missionary Ridge Fire⁴ 73000 13 1.781E-04
CA 2003 Grand Prix/Old Fire⁶ 150729 47 3.118E-04
BC 2003 Okanagan Mountain Park⁷ 64030 2 3.124E-05
BC 2004 Cedar Hills Fire (2003)⁷ 4003 1 2.498E-04
BC 2004 Kuskonook (2003)⁷ 11940 2 1.675E-04
BC 2004 Lamb Creek (2003)⁷ 29361 1 3.406E-05
BC 2005 Ingersoll (2003)⁷ 18063 12 6.643E-04
ID 2009 Castle Rock Fire (2007)² 48520 20 4.122E-04
CA 2010 Station Fire (2009)⁸ 160577 57 3.550E-04
references ¹Cannon, 2001 ²Riley et al., 2013 ³Gartner et al., 2005 ⁴Cannon et al., 2003
⁵McDonald and Giraud, 2007 ⁶Cannon et al., 2008
⁷Jordan and Covert, 2009 ⁸Ahlstrom, 2013
26 2.6. Results/Discussion
A review of the literature that sought to pinpoint the changes in wildfire occurrence, length, and severity with climate change resulted in a wide variety of future scenarios over a range of spatial and temporal scales. The overall consensus in the literature is that wildfire season will get longer, and more severe wildfires will occur with increasing frequency in the future decades, both worldwide and in the western U.S. It is difficult to obtain one definitive predictive equation for the increase in fire danger, length of season, or fire area because researchers use different models and criteria for assessment of future fire hazard; such as the ERC or the SSR systems. Researchers do note that vegetation types, amount and structure influence the fire regime characteristics; therefore any changes in vegetation due to climate or fire would have a feedback on the fire regime. Human activities such as fire management policies and effectiveness will continue to change. Other human influences such as forest conversion and fragmentation will also influence the fire regime. For the examination below on post-wildfire debris flow numbers the fire regime will be considered to follow the current trend and the predicted models, to 2050, without the potential feedback mechanisms of longer-term vegetative changes due to climate and fire changes.
Because of the established relationship of wildfire area, burn severity, and debris flow generation, a few different model results were chosen to represent the future changes to wildfire area and severity in the coming decades. The two models presented by Flannigan (2000), both GCM, use coarse resolution (400km) and give a basis for general expected increases for burned area in the western U.S. with 2 x CO2 by mid-century, 2050. Holding other factors constant, the
predicted higher Seasonal Severity Rating will increase burned areas by 10% in the western U.S. These predictions of future fire regime are more conservative than the results from the National
27
Research Council (NRC) as summarized by Climate Central, which state that for every 1 degree Celsius of temperature rise in the West, the wildfire burn area could quadruple. The IPCC 5th assessment report predicts a range of warming of 1.5 – 5.8° C by mid-century for North America, which would translate to a 400 - 2000% increase in wildfire burn area by 2050, using the NRC estimate. The regional forecast for California as presented by Fried et al. (2004) uses a finer resolution model that focuses on California’s landscape and predicts fire behavior based on weather, fuels and slope. The results of this study show an increase, on average, of 50% in area burned per fire in California with climate change. Fried et al. (2004) warn that these estimates are a minimum expected change or the ‘best-case’ forecast. For this study we use the end members of 10% and 400% fire area increase as low end, and conservative high end value for analysis of the potential change in probability of post-wildfire debris flows.
Precipitation models almost universally show that with a warming atmosphere the hydrologic cycle will have increased heavy precipitation events, mostly at the expense of other forms of precipitation. The trend toward increased rainfall has been documented and is expected to continue in most areas of the western U.S. Climate change is expected to affect the delivery of moisture seasonally, resulting in wetter falls and springs and drier summers and winters. The IPCC 5th assessment report (Christensen, et al 2013) includes a chapter on regional climate phenomena and the conclusion presented is that there will be precipitation increases across the West by mid-century in both July and August (+ 0.1 mm/day °C-1) and December, January, and February (+0.1 to +0.4 mm/day °C-1). Based on the report’s predicted range of warming, +1.5° – +5.8°C, the rainfall amounts would increase in the summer months by a range of 0.15 - 0.58 mm/day, and a range in the winter months of 0.15 - 2.32 mm/day.
28
It is difficult to apply GCMs and even most regional scale models to precipitation patterns for the West because the general coarse resolution of the models does not accurately reflect the diversity of topography and orographic influences across mountain ranges. For the analysis presented in this paper, a range of percentage increase in extreme events will be applied to debris-flow predictive models to calculate the percentage increase in debris debris-flow probability. Increases in heavy and extreme highest 1-day precipitation events in areas of the West will be in the range of 3.5% (Karl and Knight, 1998) to 50% (Kim, 2005), in keeping with the recorded trend. These heavy and extreme 1-day events have defined thresholds of 50.8 mm/day and 101.6 mm/day, respectively (Kim, 2005). These thresholds are well above debris-flow triggering thresholds defined by Cannon et al. (2008, 2010) for parts of the Western U.S., who showed that many debris flows from burned areas are triggered by events as small as the 2 year recurrence storm, which is a common summer convective thunderstorm with a high-intensity short-duration burst of rainfall.
2.6.1 Data set analysis
Statistical analysis of DS1 did not result in a significant relationship between burned area and number of post-wildfire debris flows. The data was assessed with a variety of statistical methods, without response, to answer the question whether acres burned adequately explains the number of debris flows. The data set is non-normally distributed, and even a log-log analysis is strongly right skewed. Analysis of this data does show an increase in total fire area over time, a result which is supported in the literature, but does not show that the number of debris flows recorded is also increasing with time. So the initial hypothesis, that if fires are increasing in size then numbers of post-wild fire debris flows will also increase, does not hold statistically true for
29
this data set. There may be many reasons for the skewness of the data and the lack of correlation within the record. It is believed that the main reason for this lack of correlation is the incomplete record of total numbers of debris flows from burned areas. Reports are biased toward including only debris flows that actually impact infrastructure such as houses and roads. For example, two debris flows are included in the USGS database of post-wildfire debris flows (OFR 2004-2085) originating from the 1988 Peak fire in the Huachuca Mountains in Arizona. However, in the report by Wohl and Pearthree (1991) studying the geomorphic effects of these post-wildfire debris flows it is evident that many more debris flows were observed in the field (although a specific number is not given), but only the two that impacted personal property are recorded as significant. Youberg (2014) confirms that there were 29 total debris flows from this fire area, but only two were highlighted.
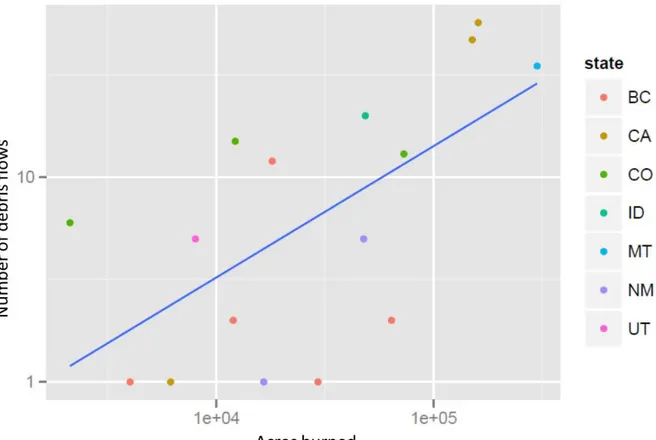
Using DS2, the relationship between the size of the fire and the number of resulting debris-flows originating from the burned area is slightly more apparent (Figure 2.3). This is likely due to the fact that only a better-documented and reported area will record all the individual flow events and not just those that had an impact. The statistical analysis using a mixed-effects model on a log-log scale with random effects for intercept by state does produce a positive slope with a 95% confidence interval. The fit by REML had an AIC of 56.83. This confirms that within DS2 there is a statistically supported relationship between fire area and number of debris flows initiated. The bias in this small data set is readily apparent; there is a lack of historical coverage over 20 years old and it is limited to only a few states and researchers. That is why it is presented as a trend line, rather than a statistically significant line with an equation that would indicate some predictive application. It is, however, a reasonable starting place for establishing a relationship between burn area and number of debris flows. As has been observed in the state of Arizona, the increase in
30
larger fires increases the area burned at high severity, which in turn increases the number of resulting post-wildfire debris flows (Youberg, personal communication, 2014).
2.6.2 Predicting post-wildfire debris-flow potential and volume estimates with climate change models
As outlined above, climate change models predict an increase in overall fire area as well as increasing intensity of each particular fire due to low moisture conditions and changing seasonal warming patterns through the end of this century. This will increase both the number of acres burned at moderate to high severity and the number of individual watershed basins included in
Figure 2.3 The relationship between number of acres burned in a wildfire and the number of debris flows in log-log space. The line shows the trend for this data set. Although found to be statistically significant the relationship should not be used for predictive purposes. Graph includes areas that are considered better-documented debris-flow responses from a burned area.
31
each fire area. The overall predicted increase in area burned/area burned at high severity within each basin can be applied to predictive models for post-wildfire debris flows in the intermountain west, as presented by Cannon et al. (2010). The predictive models for the probability that a basin burned by wildfire will produce a debris flow also include a rainfall intensity measurement that will influence the likelihood of a debris flow produced from a burned basin. The majority of climate change models evaluated predict that most areas in the western U.S. will receive higher intensity rainstorms and higher overall rainfall totals in the coming decades.
The probability equations for a debris flow being produced from a burned basin are a function of several variables including: gradient, ruggedness, percent area burned at high to moderate severity, average rainfall intensity, clay content and liquid limit of overburden material (Cannon et al., 2010). The probability function is P= ex/1+ex, where x equals the combination (Bixi) of the values for the independent variables (xi) and the logistic regression coefficients (Bi).
Five models were found to be statistically significant with a different combination of variables strongly correlated to debris-flow occurrence.
Using the 3 models that produced the highest predictive strength as presented by Cannon et al. (2010), the increased probability of a burned basin producing a debris flow was calculated with respect to the range of what is predicted by climate change models (Table 2.2). To assess the increase in the probability of a debris flow happening in a particular basin a hypothetical basin was evaluated. Values for the independent variables were created as averages from 16 basins burned by the Hot Creek Fire in Idaho (Cannon et al 2010). The increase in percentage burned area, and intensity of rainfall event, based on the climate change projections, were added to establish the percentage change or increase in the probability of a debris flow being produced. Four scenarios were evaluated: the smallest predicted change in severe burn area and rainfall intensity, the largest
32
change in burn area and smallest rainfall intensity, the smallest burn area change and largest rainfall intensity increase, and the worst case scenario of the largest increase in severe burn area and largest increase in rainfall intensity. Evaluation using these models indicates the probability of a post-wildfire debris flow occurring in an “average” drainage basin will on average by 20.6%, with different climate scenarios increasing the probability of post-wildfire debris flows by 1.6% to 38.9%. with predicted changes in fire regime and precipitation with climate change. These
numbers are conservative estimates based on the range of increases proposed by the climate models investigated above. Since these increases are associated with each individual basin, the likelihood of a debris flow occurring across an entire burned watershed consisting of numerous basins is much higher.
In all 5 models the regression coefficients associated with the independent variables of percentage of basin burned at high severity and average storm intensity are positive, therefore any increase in the value for the independent variable will result in an increase in the overall
probability of a debris flow occurrence. Models A and C were found to be the strongest predictors of debris flow probability when tested on a burned area in Idaho that experienced a convective summer thunderstorm (Cannon et al., 2010). These models start with a high probability, 85.6% and 96.3% for A and C, respectively, of a basin producing a post-wildfire debris flow, and increase to 100% probability with climate change increases in burn severity and rainfall intensity. Model B starts with a low overall probability of the basin producing a debris flow, 0.7%, but showed the largest increase, +98.7%, in debris flow probability with the increased high severity burn area and high rainfall intensity. Models A and C start with a high probability so have little room to show an increase, and Model B probably under predicts most scenarios initially. A rough estimation of the increase in debris-flow probability is the average of the of the three models across the 4 different