SAFETY PERFORMANCE MODELS FOR PEDESTRIANS AND
BICYCLISTS
Thomas Jonsson
Department of Technology and Society, Lund University Box 118, SE-221 00 Lund, Sweden
E-mail: thomas.jonsson@tft.lth.se Phone: +46-46-222 91 39
ABSTRACT
Safety performance models are essential tools for traffic safety work, and are used to estimate the expected number of accidents in an intersection, on a road segment or other entity of the road network. The models are based on accident history for several years and for many intersections/segments, thus trying to counter the large random variation in accident counts between individual years and places. Much research has been done within the area of safety performance models, but the vast majority of it has been done for motorized traffic. With an increased focus on sustainable traffic and increased demand for walking and biking there is also need for good models for these transportation modes, but very limited research has been carried out so far in this area. This paper reports mainly on two recent Swedish studies with a special focus on safety performance for pedestrian and bicyclist. The first Swedish study was based on police reported accidents on 400 urban street segments and the second on both hospital and police reported accidents on 360 segments and 63 intersections. Short counts of pedestrians and bicyclists were carried out to account for exposure in the models. The statistical approach used for the model development was quasi-Poisson in the first study and Negative Binomial in the second one, both approaches accounting for over/underdispersion in the accident count. The developed models exhibit a ‘safety in numbers’, i.e. the risk for an individual pedestrian/bicyclist to be involved in an accident decreases with an increase in the number of pedestrians/bicyclists. This effect is stronger for bicyclists than for pedestrians. The short counts were shown to significantly improve the predictive capability of the models compared to only using proxies for their number, such as street type or type of built environment along the street.
1 BACKGROUND
Safety performance functions are used to describe how the expected number of traffic accidents varies with the number of road users and other variables (AASHTO 2010). These models are mostly focused on motorized vehicle accidents (Kulmala 1995, Lord et al 2008, Bindra et al 2009, AASHTO 2010, Dixon et al 2012). Over time the focus of traffic safety work has shifted towards that of vulnerable road users such as pedestrians and bicyclists; this has also been the case in Sweden where this focused has been strengthened by the introduction of an accident database (STRADA) containing data from both police and hospitals (Vägverket 2004). As police reporting of accidents of vulnerable road users suffer to a much higher degree of underreporting than those of motorized vehicle accidents (Englund et al 1998), the addition of hospital data give a more complete picture of the safety situation.
The focus of the traffic safety problem has shifted from that of being mainly a car problem to being dominated by injured bicyclists and pedestrians.
There have been a fair amount of studies where the safety performance has been estimated for bicyclists and pedestrians at intersections (ex: Brüde & Larsson 1992, Ekman 1996, Greibe 2003, Jacobsen 2003, Turner et al. 2006), but only a few for street environments between intersections (Greibe 2003, Turner et al. 2006).
This paper reports the findings from two projects where safety performance models have been developed specifically for pedestrian and bicyclist accidents. The focus is both on the actual models and, even more, on the lessons learned.
The first project (EMV) was carried out in 2000-2005 and included a large scale data collection from more than 500 urban streets in six different cities (though only 400 were used for model estimation). At this period there was not any hospital data available, so only police reported accidents from five years (1997-2001 or 1998-2002 depending on city) were used for the model estimation. A more detailed description of the project and the modeling efforts can be found in a doctoral dissertation (Jonsson 2005).
The second project (GCS) was carried out in 2008-2010 and included data for approximately 360 urban streets in six different cities. In this study accident data from both police and hospital was used, including data from six years (2002-2007).
Safety performance models are commonly estimated separately for intersections and street segments, where only major intersections are modeled, and minor intersections (with intersecting local streets and driveways) are included in the street segments. Both projects have focused on models for arterial street segments. In the GCS-project some models were also estimated for intersections but they are not included in this paper.
2 METHODOLOGY
Generalized Linear Models (GLIMs) have been chosen for the modeling since the dependent variable, the number of accidents, isn’t normally distributed, but rather Poisson- or negative binomial-distributed. GLIMs allow for the dependent variable to take on other distributions than the normal distribution, the only restriction being that the distribution belongs to the exponential family.
Generalized linear models will not be described in detail here as there are much better sources available for that (Olsson 2002, Allain and Brenac 2001, Maher and Summersgill 1996). Some parts of the GLiM have to be described in order to understand the results generated by them, and to provide some knowledge about the choices made in the modeling.
GLiMs use a link function to generalize the connection between the dependent and the independent variables.
β
η
µ
X
g
(
)
=
=
In the case of a Poisson distributed dependent variable a logarithmic function is normally used as the link function, which also has been the case in this work.
When a logarithmic link function is used, the model will take on the form:
e
Y
E
= ∑βixi)
(
where:
E(Y) is the dependent variable, in this case the expected number of accidents βi are parameters to be estimated by the model
xi are the independent variables
The model design with a sum of βx terms is characteristic for linear models. In the case of a logarithmic link function the exponential relationship will however lead to a multiplicative form since:
e
e
e
β1X1+β2X2 = β1X1× β2X2To be able to obtain simple models, the covariates used have been logarithmated. By using logarithmated variables the expression obtained can be simplified using the
relation 1 1 1 1 β β
x
e
Lnx = . In the case of categorical variables one of the categories is chosen as base category and obtains the value e0=1 whereas the other categories are assigned dummy values eβ describing their effect on the number of accidents relative to the base category.In the EMV-project the models were limited to a small number of different models (car-bicycle, car-pedestrian, car-car and single car) but with several different variables included taking into account the characteristics of the different streets. The selection of variables to be included in the models was performed with a forward selection strategy, using AIC (Akaike Information Criterion) as the selection criteria.
In the GCS-project the models instead took on the form of base models, just including exposure variables, but estimating separate models for different types of streets (according to speed limit, number of lanes and separation of bicyclists).
3 DATA
In both studies data from more or less the whole arterial street network in six cities was used, as to not have any selection bias. The data compiled can be divided into four different categories:
• Road characteristics • Traffic volume data • Accident data
The datasets used in the studies included 393 street segments (total length 197 km) in the EMV-study and 360 street segments (total length 160 km) in the GCS-study. Both studies have focused on urban arterial streets and do not include rural road environments nor local streets.
3.1 Road characteristics
In both the studies the streets were categorized as per number of lanes, speed limit and separation of bicyclists along the street. In addition, in the first study surrounding land use was categorized and used as a variable in the first study, as well as several other variables such as parking allowance, visibility etc.
The road characteristics have been used in different ways in the models of the two projects. In the EMV project only one model was developed for each type of accident, and in that model were included variables describing the roadway characteristics. In the GCS-project the road characteristics were used to categorize the streets into different types for which separate models were developed.
3.2 Traffic volume data
In safety performance models the most important variables to estimate the expected number of accidents is the number of road users. In the case of pedestrian and bicyclist safety models, this includes the number of these road users, but in the case of Pedestrian and
Car-Bicyclist accidents also the number of motorized vehicles.
In contrast to motorized traffic, the pedestrians and bicyclists are somewhat freer in how to move through the street environment. In downtown areas especially pedestrians can often be expected to cross the street not only at intersections, but anywhere along the street segment. This calls for somewhat flexible variables describing the movements of pedestrians. In the models of both projects the number of pedestrians both crossing the street as well as walking along it has been registered. These numbers have then been combined to a joint exposure measure.
Since the number of pedestrians and bicyclists are not usually systematically counted by municipalities these numbers had to be collected within the projects. To be able to estimate sound models several hundred street segments are needed, thus very short counts have been performed to just get a basic estimate of the level of pedestrian and bicyclist numbers. The counts have been carried out for just 15 minutes per site, but have been adjusted for temporal variation and have also been carried out in homogeneous weather conditions (no rain and 10+ C).
The AADT for the different segments has been provided from the municipalities, and has been used in those models predicting accidents including motorized vehicles.
3.3 Accident data
In the first study police reported accident data was gathered for 5 years from the national accident database and linked to the different street objects. For three of the six cities an additional three years of accident data was available and was used for validating the models. The five year data used for calibration included 343 bicycle accidents and 130 car-pedestrian accidents.
In the second study 5-6 years of both police and hospital recorded accident data was used. Because of the inclusion of hospital data this study could also look closer at single pedestrian and single bicyclist accidents. The data included 382 car-bicycle accidents, 163 car-pedestrian accidents, 570 bicycle only (single bicycle and bicycle-bicycle) accidents and 497 single pedestrian accidents.
4 RESULTS AND LESSONS LEARNED
This section lists the most important results and conclusions from the two projects.
4.1 Safety Performance Models
accidents between motorized vehicles and cyclists and one for accidents between motorized vehicles and pedestrians:
ACCCar-Bike = 4,32E-05 x Length x NCXP0,35 x AADT0,76 x Landuse x Func x Vis ACCCar-Ped = 3,98E-05 x Length x NPXP0,50 x AADT0,50 x Landuse x Func x VRUX Where:
AccC/AccP is the predicted number of accidents per year, Length is measured in meters, NCXP/NPXP is the number of cyclists/pedestrians passing through the street (both crossing and moving along the segment) per day, AADT of motorized vehicles. Remaining variables are CMFs (Crash Modification Factors) adjusting the risk level depending on surrounding Landuse, Function of the street, Visibility and presence of crossing facility for vulnerable road users, see Jonsson (2005) for full description.
In the GCS-project the models were base-models only including traffic volume data, but divided into separate models for different street types according to speed limit, number of lanes and presence of separated bicycle facility. Model structure:
ACCCar-Bike = b0 x (AADTBike)b1 x (AADTCar)b2 ACCBike = b0 x (AADTBike)b1
ACCCar-Ped = b0 x (NP100)b1 x (AADTCar)b2 ACCPed = b0 x (NP1000)b1
NP100 and NP1000 are combined variables of number of pedestrians along segment and number of crossing pedestrians crossing per 100 or 1000 meters, the 100/1000 values are empirically estimated by maximum likelihood.
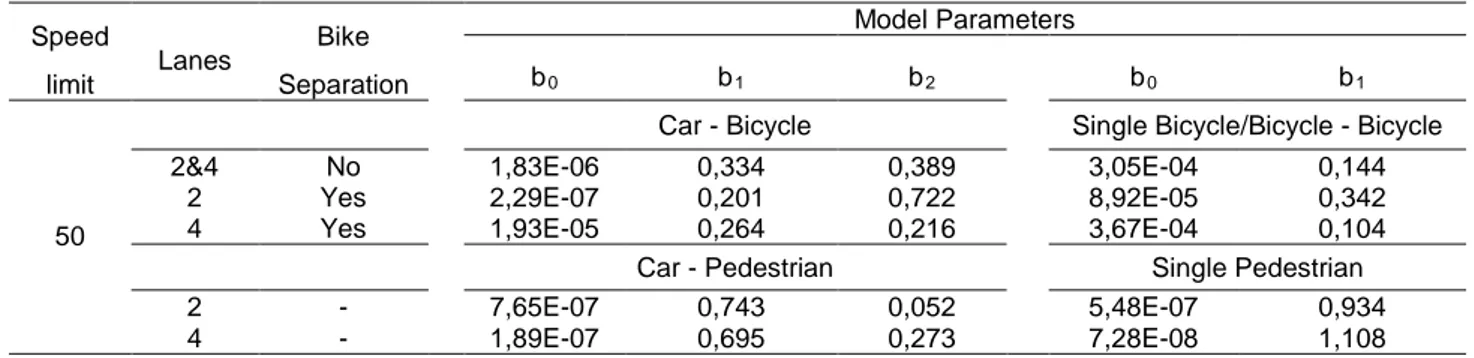
Complete parameter estimates for the different accident types and street environments can be found in Table 1.
Table 1 Model parameters for GCS Speed limit Lanes Bike Separation Model Parameters b0 b1 b2 b0 b1 50
Car - Bicycle Single Bicycle/Bicycle - Bicycle
2&4 No 1,83E-06 0,334 0,389 3,05E-04 0,144
2 Yes 2,29E-07 0,201 0,722 8,92E-05 0,342
4 Yes 1,93E-05 0,264 0,216 3,67E-04 0,104
Car - Pedestrian Single Pedestrian
2 - 7,65E-07 0,743 0,052 5,48E-07 0,934
4.2 Safety in numbers
In accord with earlier studies for intersections the car-bicyclist and car-pedestrian models show a ‘safety in numbers’-effect also for segments, i.e. the risk per bicyclist/pedestrian decrease with an increase in number of bicyclists/pedestrians since the exponents for bicyclist/pedestrian volumes are less than 1. This is commonly attributed to an increased driver awareness regarding the presence of pedestrians and bicyclists. The car-bicyclist accidents have a stronger ‘safety in numbers’-effect than the car pedestrian accidents.
The single bicycle/bicycle-bicycle accidents also show a safety in number effect, which cannot be attributed to driver awareness. One possible explanation could be a confounding factor in the shape of that bicyclist volume probably is higher where there are good facilities for bicyclists. This could lead to lower risk at higher volumes due to that many bike where it is safe, ex where the surface is even.
Single pedestrian accidents appear to be linearly related to the number of pedestrians, the exponents for pedestrian volume are close to 1, and not significantly different from 1.
4.3 The need for pedestrian and bicyclist volumes
When trying to predict the number of accidents or injuries of vulnerable road users it is essential to have estimates of the volumes of these road users, just as it is when predicting the number of crashes of motorized road users.
The availability of good counts of pedestrians and bicyclists are, however, not the easiest to come by. Cars are counted on a regular basis by automated counters, but bicyclists and pedestrians are generally not. This is partly due to the lack of inexpensive ways to collect these volumes. Technology is advancing in this field with sensors of various technologies, as well as advances in automated video analysis that enables automated counts even of these road users. This paper will not go into detail regarding these technologies, but will just stress the need for them.
In Jonsson (2005) a comparison was done between the predictive capabilities of models with different types of variables. Three different sets of models were developed, one with just road design features and the function class of the street, one which included data on land use along the street, and one including volumes of pedestrians/bicyclists. The models with just road characteristics only explain 37% of the variation, while the models using pedestrian/bicyclist volumes could explain 71-81% of the variation. If pedestrian and bicyclist volumes are not available, then models including land use is a 'second best' solution explaining 54-55% of the variation.
Please observe that the pedestrian and bicyclist volumes used were derived from just 15 minute counts, adjusted for temporal variation. With longer counts the precision goes up and the models developed will likely get even better.
4.4 The need for hospital data
In most countries only police reported accidents are used for safety assessments, if even that much is available. The Swedish Traffic Accident Data Acquisition system (STRADA) incorporates both police and hospital data. Since the introduction of STRADA in the late 1990’s more and more hospitals have started reporting to the database and currently the emergency care units at most (but not all) Swedish hospitals report to STRADA. The hospital
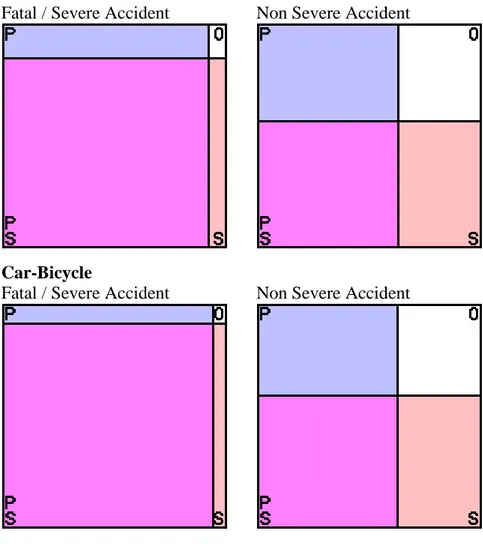
There is a considerable underreporting of accidents with vulnerable road users. This is nothing new (Englund et al 1998), but in the GCS-project the data collected was used to estimate how the underreporting vary both with type of accident as well as with severity (Jonsson et al 2011). Figure 1 shows a graphical representation of how the reporting varies for police and hospital related to type of accident and severity. The underreporting is relatively small as long as there is a motorized vehicle involved and the consequences are fatal or severe. The underreporting increase with milder consequences, and accidents with only vulnerable road users involved are heavily underreported. For pedestrian and bicyclist accidents involving a motorized vehicle the degree of underreporting seem to have the same size for hospital and police. However, accidents with only pedestrians and bicyclists are very seldom reported by the police.
One lesson learned from the two projects reported in this paper is that hospital data enables the development of models for single-pedestrian and single-bicycle accidents, while police data do not.
Car-Pedestrian
Fatal / Severe Accident Non Severe Accident
Car-Bicycle
Fatal / Severe Accident Non Severe Accident
Accidents with only pedestrians and bicyclists involved (excl Single Pedestrian) Fatal / Severe Accident Non Severe Accident
Figure 1 Graphical representations of reporting sources of accidents. Areas are proportional to the percentage of accidents reported by the Police only (P), Hospital only (H), Both (PS). The white field represents a naïve estimate of unknown accidents, assuming that police and hospital reporting is independent from each other. (Jonsson et al 2011)
5 FUTURE NEEDS FOR DEVELOPMENT
During the reported projects some areas have been identified that warrant further studies.
5.1 Models for non-arterial environments
The models described in this paper, as well as in most other sources, are for arterial streets. This is due to that these are generally what is assessed for potential safety improvement, and it is where the risks are high. However, looking at the GCS-data most of the pedestrian and bicyclist accidents occur outside the arterial network. One of the cities included in the project was studied in detail regarding this, and less than 20% of the pedestrian and bicyclist accidents occurred on the arterial street network.
The risk is still higher on the arterial streets, but the amount of walking and biking is much larger outside the arterial network. These small local streets, bike trails, parks etc are not suited for traditional safety performance models. Instead some form of area based models is likely the best solution. There was not enough resources in this project to delve deeper into this type of models, and it is left for future work.
5.2 Models for rural environments
The pedestrian and bicyclist safety performance models that do exist are almost exclusively for urban environments, apart from the use of basic accident rates. This is natural as most of the walking and biking is carried out in urban environments, and most of the accidents also occur there. However, those accidents with pedestrians and bicyclists that do occur on rural roads tend to have more severe consequences.
The low volume of bicyclists and pedestrians (often only ca 10 per day) make it even more difficult to acquire volumes for them than in urban environments. The model development would therefore need to use some creative methods. One suggestion would be to use demographic data in a GIS-environment to estimate the volumes in a similar fashion as has been done by Bindra et al (2009) for motorized vehicles.
6 ACKNOWLEDGEMENTS
The model development in the GCS-project was carried out as a joint study between Lund University and WSP Sweden, and the author would especially like to thank Dr Karin Brundell-Freij at WSP for the discussions leading up to the analysis regarding the underreporting.
This research has been funded by the Swedish Transport Administration and the author would like to thank Östen Johansson at STA for initiated discussions and feedback on the modeling, and Mulugeta Yilma who has been the project supervisor at STA.
REFERENCES
AASHTO (2010) Highway Safety Manual, ISBN 1-56051-477-0, AASHTO, USA
Allain E., Brenac, T. (2001) Modèles linéaires generalises appliqués à l’étude des nombres
d’accidents sur des sites routiers – Le modèle de Poisson et ses extensions, Recherche
transports sécurité No 72, France
Bindra, S., J. N. Ivan, and T. Jonsson (2009). Predicting Segment-Intersection Crashes with
Land Development Data. In Transportation Research Record: Journal of the Transportation
Research Board, No. 2102, Transportation Research Board of the National Academies, Washington, D.C., 2009, pp. 9–17.
Brüde U., Larsson J. (1992) Trafiksäkerhet i tätortskorsningar / VTI-meddelande 685, VTI, Linköping, Sweden
Dixon K., Avelar R., Brown L., Mecham M. and van Schalkwyk I. (2012) Quantifying Safety
Performance of Driveways on State Highways, Final Report SPR 720, Oregon Department
of Transportation, USA
Ekman L. (1996) On the Treatment of Flow in Traffic Safety Analysis, Bulletin 136 Institutionen för Trafikteknik, LTH, Lund, Sweden
Englund A., Gregersen N. P., Hydén C., Lövsund P., Åberg L. (1998) Trafiksäkerhet – En
kunskapsöversikt, KFB & Studentlitteratur, Lund, Sweden
Greibe P. (2003) Accident prediction models for urban roads, Accident analysis and prevention Vol. 35 No.2 p273-285, 2003, Pergamon Press, Oxford, United Kingdom Jacobsen P.L. (2003) Safety in numbers: more walkers and bicyclists, safer walking and
bicycling, Injury Prevention 2003;9:205–209, Montreal, Canada
Jonsson T. (2005) Predictive Models for Accidents on Urban Links – A Focus on Vulnerable
Road Users, Doctoral dissertation, ISSN 1404-272X, Lund University, Lund, Sweden
Jonsson T., Koglin T., Lindelöw D., Nilsson A. (2011) Effektsamband för gående och
cyklisters säkerhet – litteraturstudie, Bulletin 260, Department of Technology and Society,
Lund University, Lund, Sweden
Kulmala R. (1995) Safety at rural three- and four-arm junctions – Development and
application of accident prediction models, VTT Technical Research Centre of Finland,
Espoo, Finland
Lord D., Geedipally S.R., Persaud B.N., Washington S.P., van Schalkwyk I., Ivan J.N., Lyon C. and Jonsson T. (2008) Methodology to Predict the Safety Performance of Rural
Multilane Highways, Final Report for NCHRP Project 17-29, NCHRP, USA
Maher M.J., Summersgill I. (1996) A comprehensive methodology for the fitting of predictive
accident models, Accident analysis and prevention 28 p281-296 Vol. 28, No.3 1996,
Pergamon Press, Oxford, United Kingdom
Olsson U. (2002) Generalised Linear Models – An Applied Approach, Studentlitteratur, Lund, Sverige
Turner, S.A., Roozenburg, A.P., Francis, T. (2006) Predicting accident rates for cyclists and pedestrians, Land Transport New Zealand Research Report 289, New Zealand
Vägverket (2004) Olycksrapport Skåne - 2003, Publikation 2004:120, Vägverket, Borlänge, Sverige