Support for Holistic Response-time Analysis in an Industrial Tool Suite:
Implementation Issues, Experiences and a Case Study
Saad Mubeen∗, Jukka M¨aki-Turja∗† and Mikael Sj¨odin∗
∗ M¨alardalen Real-Time Research Centre (MRTC), M¨alardalen University, V¨aster˚as, Sweden † Arcticus Systems, J¨arf¨alla, Sweden
{saad.mubeen, jukka.maki-turja, mikael.sjodin}@mdh.se
Abstract—The process of implementing and integrating state-of-the-art real-time analysis techniques with an existing industrial tool suite for the development of Distributed Real-time Embedded (DRE) systems offers many challenges. The implementer has to not only code and implement the analysis in the tool suite, but also deal with several issues such as extraction of unambiguous timing and tracing information from the design model. In this paper we present an implementation of the Holistic Response-Time Analysis (HRTA) as a plug-in for an industrial tool suite Rubus-ICE that is used for component-based development of DRE systems. We discuss and solve the issues encountered and highlight the experiences gained during the process of implementation, integration and evaluation of HRTA plug-in. We also provide a proof of concept by modeling an automotive application (autonomous cruise control system) using component-based development and analyzing it with HRTA plug-in.
Keywords-Distributed real-time embedded systems; holistic response-time analysis; component-based development;
I. INTRODUCTION
In order to provide evidence that each action in the system will meet its deadline, a priori analysis techniques such as schedulability analysis have been developed by the research community. Response Time Analysis (RTA) [1], [2] is one of the methods to check the schedulability of a system. It calculates upper bounds on response times of tasks or messages in a real-time system or a network respectively. Holistic Response-Time Analysis (HRTA) [3], [4], [5] is an academic well established schedulability analysis technique to calculate upper bounds on the response times of event chains (distributed transactions) in a distributed real-time system. The process of transferring such academic research results to the tools for industrial use can be challenging.
A tool chain for the industrial development of component-based Distributed Real-time Embedded (DRE) systems con-sists of a number of tools such as designer, compiler, builder, debugger, simulator, etc. Often, a tool chain may comprise of tools that are developed by different tool vendors. The implementation of state-of-the-art complex real-time anal-ysis techniques such as RTA and HRTA in such a tool chain is non-trivial because there are several issues that are encountered apart from merely coding and testing the analysis algorithms.
A. Goals and Paper Contributions
In this paper, we discuss the implementation of HRTA as a standalone plug-in in the industrial tool suite Rubus-ICE (Integrated Component development Environment) [6]. Our goals in this paper are as follows.
1) Transfer the state-of-the-art real-time analysis results, i.e., holistic response-time analysis to the tools for industrial use.
2) Discuss and solve several issues encountered dur-ing the implementation, integration and evaluation of HRTA as a plug-in for Rubus-ICE.
3) Discuss the experiences gained during the implemen-tation, integration and evaluation of HRTA plug-in. 4) Provide a proof of concept by conducting an
automotive-application case study.
We believe, the contributions in this paper may provide guid-ance for the implementation of complex real-time analysis techniques in any industrial tool suite that supports a plug-in framework for the plug-integration of new tools and allows component-based development of DRE systems.
B. Paper Layout
The rest of the paper is organized as follows. Section II presents the background and related work. Section III dis-cusses the implemented analysis. Section IV describes the experiences gained and issues encountered during the im-plementation of HRTA. Section V presents a test plan. In Section VI, we present an automotive case study by model-ing and analyzmodel-ing a DRE application. Section VII concludes the paper and presents the future work.
II. BACKGROUND ANDRELATEDWORK A. The Rubus Concept
Rubus is a collection of methods and tools for model-and component-based development of dependable embedded real-time systems. Rubus is developed by Arcticus Sys-tems [6] in close collaboration with several academic and industrial partners. Rubus is today mainly used for develop-ment of control functionality in vehicles. The Rubus concept is based around the Rubus Component Model (RCM) [7] and its development environment Rubus-ICE, which includes
modeling tools, code generators, analysis tools and run-time infrastructure. The overall goal of Rubus is to be aggressively resource efficient and to provide means for developing predictable and analyzable control functions in resource-constrained embedded systems.
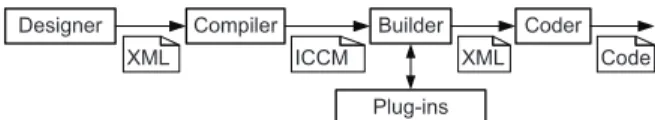
RCM expresses the infrastructure for software functions, i.e., the interaction between software functions in terms of data and control flow separately. The control flow is expressed by triggering objects such as internal periodic clocks, interrupts, internal and external events. In RCM, the basic component is called Software Circuit (SWC). The execution semantics of an SWC is simply: upon triggering, read data on data in-ports; execute the function; write data on data out-ports; and activate the output trigger. Recently, we extended RCM for the development of DRE systems by introducing new components [8], [9]. A detailed comparison of RCM with several component models is presented in [8]. Figure 1 depicts the sequence of main steps followed in Rubus-ICE from modeling of an application to the generation of code. The component-based design of an application is modeled in the Rubus Designer tool. Then the compiler compiles the design model into an Intermediate Compiled Component Model (ICCM). After that the builder tool sequentially runs a set of plug-ins. Finally, a coder tool generates the code.
Designer Compiler Builder Coder
XML XML
Plug-ins
ICCM Code
Figure 1. Sequence of steps from design to code generation in Rubus-ICE
B. Plug-in Framework in Rubus-ICE
The plug-in framework in Rubus-ICE [10] facilitates the implementation of state-of-the-art research results in an iso-lation (without needing Rubus tools) and their integration as add-on plug-ins (binaries or source code) with the integrated development environment. A plug-in is interfaced with a builder tool as shown in Figure 1. The plug-ins are executed sequentially which means that the next plug-in can execute only when the previous plug-in has run to completion. Hence, each plug-in reads required attributes as an input, runs to completion and finally writes the results to ICCM file. An Application Programming Interface (API) defines the services required and provided by a in. Each plug-in specifies the supported system model, required plug-inputs, provided outputs, error handling mechanisms and a user interface. Figure 2 shows a conceptual organization of a Rubus-ICE plug-in.
C. Response-Time Analysis
1) RTA of Tasks in a Node: Liu and Layland [11] provided theoretical foundation for analysis of fixed-priority scheduled systems. Joseph and Pandya published the first RTA [12] for the simple task model presented in [11].
Subsequently, it has been applied and extended in a number of ways by the research community. RTA is used to perform a schedulability test which means it checks whether or not tasks in the system will satisfy their deadlines. RTA applies to systems where tasks are scheduled with respect to their priorities and which is the predominant scheduling technique used in real-time operating systems [13]. In [13], it is claimed that amongst the more traditional, analytical, schedulability analysis techniques, RTA of tasks with offsets stands out as the prime candidate because of its better preci-sion and ability to analyze quite complex system behaviors.
API Calls Analysis Algorithms
User Interaction Error Handling API Calls
Figure 2. Conceptual organization of a plug-in in Rubus-ICE Tindell [4] developed the schedulability analysis for tasks with offsets for fixed-priority systems. It was extended by Palencia and Gonzalez Harbour [5]. Later, M¨aki-Turja and Nolin [14] reduced pessimism from RTA developed in [4], [5] and presented a tighter RTA for tasks with offsets by accurately modeling inter-task interference. We implemented RTA of tasks with offsets [14] as part of HRTA plug-in.
2) RTA of Messages in a Network: There are many protocols such as, CAN (Controller Area Network), TTCAN (Time-Triggered CAN), FlexRay, etc., that are used in DRE systems. To stay focussed, we will consider only CAN and its high-level protocols. Tindell et al. [15] developed the schedulability analysis of CAN which has served as a basis for many research projects. Later on, this analysis was re-visited and revised by Davis et al. [16]. The analysis in [15], [16] assumes that all CAN device drivers implement priority-based queues. In [17] Davis et al. pointed out that this assumption may become invalid when some nodes in a CAN network implement FIFO queues. Hence, they extended the analysis of CAN with FIFO queues as well. However, the existing analysis does not support mixed messages which are implemented by several high-level protocols for CAN. In [18], [19], Mubeen et al. extended the existing analysis to support RTA of mixed messages in the CAN network where some nodes use FIFO queues while others use priority queues.
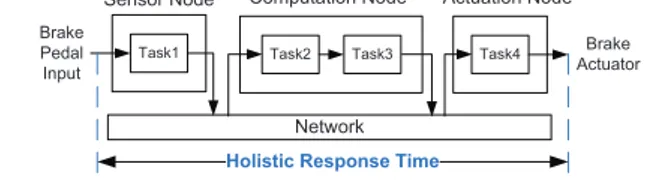
3) Holistic RTA: It combines the analysis of nodes (uniprocessors) and a network. Hence, it computes the re-sponse times of event chains that are distributed over several nodes in a DRE system. In this paper, we consider a timing model that corresponds to the holistic schedulability analysis for DRE systems [3]. An example distributed transaction in a DRE system is shown in Figure 3. The holistic response time is equal to the elapsed time between the arrival of an event (corresponding to the brake pedal input) and the response time of Task4 (corresponding to the production of a signal for brake actuation). In [20], we discussed our preliminary
findings about implementation issues that are encountered when HRTA is transferred to the industrial tools.
Task1 Task2 Task3 Task4
Network
Sensor Node Computation Node Actuation Node
Holistic Response Time
Brake Pedal Input
Brake Actuator
Figure 3. Holistic response-time in a distributed real-time system D. Tools for Timing Analysis of DRE Systems
We briefly discuss few tool suits that provide similar real-time analysis support for DRE systems. The MAST tool suite [21] implements a number of state-of-the-art analysis algorithms for DRE systems. Among them is the offset-based analysis algorithm [4], [5] whose tighter version [14] is implemented in Rubus-ICE. The MAST model also allows visual modeling and analysis of real-time systems in a UML design environment. The Volcano Family [22] is a bunch of tools for designing, analyzing, testing and validating auto-motive embedded software systems. Among them, Volcano Network Architect (VNA) [23] is a communication design tool that supports the analysis of CAN and LIN networks. It also supports end-to-end timing analysis of a system with more than one networks. It implements RTA of CAN developed by Tindell et al. [15].
SymTA/S [24] is a tool for model-based timing analysis and optimization. It implements several real-time analysis techniques for single-node, multiprocessor and distributed systems. It supports RTA of software functions, RTA of buss messages and end-to-end timing analysis of both single-rate and multi-rate systems. It is also integrated with the UML development environment to provide a timing analysis sup-port for the applications modeled with UML [25]. RAPID RMA [26] implements several scheduling schemes and supports end-to-end analysis for single- and multiple-node real-time systems. It also allows real-time analysis support for the systems modeled with Real-Time CORBA [27].
The Rubus tool suite allows a developer to specify timing information and perform holistic response-time analysis at the modeling phase during component-based development of DRE systems. To the best of our knowledge, Rubus-ICE is the only tool suite that implements RTA of mixed messages in CAN [18] and a tighter version of offset-based RTA algorithm [14] as part of the holistic RTA.
III. IMPLEMENTEDANALYSIS INRUBUS-ICE We implemented HRTA as a standalone plug-in in Rubus-ICE. The plug-in can be used to compute the response times of individual tasks in a node, messages in a network and Distributed Transactions (DTs) in a distributed system. A. Node Analysis
In order to analyze tasks in each node, we implemented RTA of tasks with offsets developed by [4], [5] and improved by [14].
B. Network Analysis
We implemented a network RTA that supports the analysis of CAN and its high-level protocols. It is based on the following RTA profiles for CAN.
1) RTA of CAN [15], [16].
2) RTA of CAN for mixed messages [18].
The above analysis assumes that the CAN nodes implement priority-ordered queues. The next step, as a future work, will be the implementation of CAN analysis that also supports FIFO ordered queues, i.e., RTA of CAN with FIFO queues [17] and RTA of CAN with FIFO Queues for Mixed Messages [19].
C. Holistic Analysis
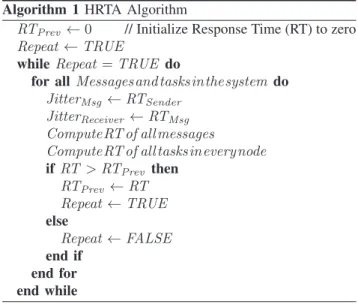
The HRTA algorithm iteratively runs the analysis algo-rithms for node and network analysis. In the first step, release jitter of all messages and tasks in the system is assumed to be zero. The response times of all messages in the network and all tasks in each node are computed. In the second step attribute inheritance is carried out. This means that each message inherits a release jitter equal to the response time of its sender task (computed in the first step). Similarly, each receiver of a message inherits a release jitter equal to the response time of the message (computed in the first step). In the third step, response times of all messages and tasks are computed again. The newly computed response times are compared with the response times previously computed in the first step. The analysis terminates if the values are equal otherwise these steps are repeated. The conceptual view of HRTA that is implemented in Rubus-ICE is shown in Figure 4. The pseudocode of HRTA algorithm is shown in Algorithm 1.
HRTA Plug-in
Algorithms for RTA of Tasks in a Node
Algorithms for RTA of Messages in a Network HRTA Algorithm
Figure 4. Conceptual view of HRTA plug-in in Rubus-ICE
IV. IMPLEMENTATIONISSUES ANDEXPERIENCES We discuss several issues encountered during the process of implementation and integration of HRTA as a standalone plug-in in Rubus-ICE. We also present our solution for each individual issue. Moreover, we discuss the summary of our experiences that are gained while translating theoretical results (HRTA) into the industrial tool suite.
A. Extraction of Unambiguous Timing Information
One common assumption in HRTA is that the timing attributes required by the analysis are available as an input. However, when HRTA is implemented in a tool chain for the analysis of component-based DRE systems, the implementer
Algorithm 1 HRTA Algorithm
RTPrev ← 0 // Initialize Response Time (RT) to zero
Repeat ← TRUE
while Repeat = TRUE do
for all Messagesand tasksinthesystem do JitterMsg ← RTSender
JitterReceiver ← RTMsg
ComputeRT of all messages
ComputeRT of all tasksineverynode if RT > RTPrev then RTPrev← RT Repeat ← TRUE else Repeat ← FALSE end if end for end while
has to not only code and implement the analysis, but also extract unambiguous timing information from the compo-nent model and map it to the inputs for the analysis model. This is because the design and analysis models are build upon different meta-models [28]. Often, the design model contains redundant timing information and hence, it is not trivial to extract unambiguous timing information for HRTA. We divide the timing information (to be extracted) into two categories. The first category corresponds to the timing attributes of tasks (in each node) and network messages that are provided in the modeled application by the user. These timing attributes include Worst Case Execution Times (WCETs), periods, minimum update times, offsets, priori-ties, deadlines, blocking times, precedence relations in event chains, jitters, etc. In [9], we identified all the timing at-tributes of nodes, networks, transactions, tasks and messages that are required by HRTA. This timing information should be extracted from the modeled application and be made available as an input for HRTA.
The second category corresponds to the timing attributes that are not directly provided by the user but they must be extracted from the modeled application. For example, message period (in case of periodic transmission) or message inhibit time (in case of sporadic transmission) is often not specified by the user. These attributes must be extracted from the modeled application because they are required by the RTA of network communication. In fact, a message inherits the period or inhibit time from the task that queues this message. Thus, we assign a period or inhibit time to the message equal to the period or inhibit time of its sender task respectively.
However, the extraction of message timing attributes becomes complex when the sender task has both periodic and sporadic activation patterns. In such a case, not only the timing attributes of a message have to be extracted
but also the transmission type of the message has to be identified. This issue can be visualized in an example shown in Figure 5. It should be noted that an Out Software Circuit (OSWC), shown in the figure, is one of the network interface components in RCM that sends a message to the network. The other network interface component is In Software Cir-cuit (ISWC) that receives a message from the network [8]. In Figure 5(a), the sender task is activated by a clock and hence, the corresponding message is periodic. Similarly, the corresponding message is sporadic in Figure 5(b) because the sender task is activated by an event. However, the sender task in Figure 5(c) is triggered by both a clock and an event. Thus, the corresponding message will be a mixed message [18]. If there are periodic and sporadic messages in the modeled application, the HRTA plug-in uses the first profile of network analysis as discussed in the previous Section. On the other hand if the modeled application contains mixed messages as well, the second profile of network analysis is used. We extract the transmission type of a message from the modeled application as follows. If the sender of a message has a periodic or sporadic activation pattern then the message is assigned a periodic or sporadic transmission type respectively. However, if the sender is activated both periodically and sporadically, the message is assigned a mixed transmission type.
(c)
(a) (b)
Figure 5. Extraction of transmission type of a message
B. Extraction of Tracing Information from Distributed Transactions
In order to perform HRTA, correct tracing information of DTs should be extracted from the design model [29]. For this, we need to have a mapping among signals, data ports and messages. Consider the following DT in a two-node DRE system modeled with RCM as shown in Figure 6.
SW C1→ OSW C A → ISW C B → SW C2 → SW C3
In this example, our focus is on the network interface components, i.e., OSWC and ISWC [8]. In order to compute the holistic response time of this DT, we need to extract trac-ing information from the component model. We identified a need for the following mappings in the component model.
• At the sender node, mapping between signals and input
data ports of OSWC components.
• At the sender node, mapping between signals and a
• At the receiver node, mapping between data output
ports of ISWC components and the signals to be sent to the desired components.
• At the receiver node, mapping between message
re-ceived from the network and the signals to be sent to the desired component.
• Mapping between multiple signals and a complex data
port. For example, mapping of multiple signals ex-tracted from a received message to a data port that sends a complex signal (structure of signals).
• Mapping of all trigger ports of network interface
com-ponents along a DT as shown by a bidirectional arrow in Figure 6.
Controller Area Network (CAN) Node A Signals SWC1 OSWC_A CAN SEND Ext messages Signals ISWC_B SWC2 SWC3 CAN RECEIVE Node B Data Port Trigger Port External Event Ext Data Source Data Sink
Figure 6. Two-node DRE system modeled in RCM
C. Impact of Design Decisions in Component Model on the Implementation of Analysis
Design decisions made in the component model can have indirect impact on the response times computed by the analysis. For example, design decisions could have impact on WCETs and blocking times which in turn have impact on the response times. In order to implement, integrate and test HRTA, the implementer needs to understand the design model (component model), analysis model and run-time translation of the design model. In the design model, the architecture of an application is described in terms of software components, their interconnections and software architectures. Whereas in the analysis model, the application is defined in terms of tasks, transactions, messages and timing parameters. At run-time, a task may correspond to a single component or chain of components. The run-time translation of a software component may differ among different component models.
D. Direct Cycles in Distributed Transactions
A direct cycle in a DT is formed when any two tasks located on different nodes send messages to each other. When there are direct cycles in a DT, the holistic analysis algorithm may run forever and may not produce converging results, i.e., the response times increase in every iteration.
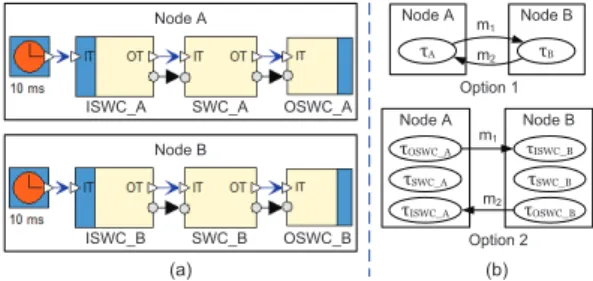
Consider a two-node application modeled in RCM as shown in Figure 7 (a). The OSWC A component in node A sends a message m1 to node B where it is received by ISWC B component. Similarly, OSWC B component in node B sends a message m2 to ISWC A component in node A. There are two options for run-time allocation of the network interface components (OSWC and ISWC)
as shown in Figure 7 (b). First option is to allocate a network interface component to the task that corresponds to the immediate SWC, i.e., to the same task as that of the component that receives/sends the signals from/to it. Since SWC A is immediately connected to both network interface components in node A, there will be only one task in node A denoted by τAas shown in Figure 7 (b). Similarly,
τB is the run-time representation of ISWC B , SWC B
and OSWC B components. It is obvious that the run-time allocation of network interface components in the first option results in direct cycles.
The direct cycles in DTs can be avoided by allocating each network interface component to a separate task as shown in the option 2 in Figure 7 (b). Although same messages are sent between the nodes, one task can not be both a sender and a receiver. No doubt there is a cycle between the nodes, but not a direct one. In this case, the holistic algorithm may produce converging response-time results and non-terminating execution of the plug-in may be avoided. It is interesting to note that the requirements and limitations of the analysis implementation provides feedback to the design decisions concerning the run-time allocation of modeling components.
Node B
ISWC_B SWC_B OSWC_B Node A
ISWC_A SWC_A OSWC_A
m2 Node B !SWC_B !OSWC_B !ISWC_B Node A !SWC_A !ISWC_A !OSWC_A Option 2 Node B !B Node A !A Option 1 m1 m2 m1 (a) (b)
Figure 7. Run-time allocation of network interface components
E. Analysis of DRE Systems with Multiple Networks In a DRE system, a node may be connected to more than one network. If a transaction is distributed over more than one network, the computation of its holistic response time involves the analysis of more than one network. Consider an example of a DRE system with two networks, i.e., CAN and LIN as shown in Figure 8. There are five nodes in the system. Node 3 is a gateway node that is connected to both the networks. Consider a transaction in which task1 in N ode1 sends a message to task1 in N ode5 via N ode3. The computation of holistic response time of this transaction will involve the computation of message response times in both CAN and LIN networks.
If a modeled system contains more than one network, we divide it into sub-systems (each having a single network) and analyze them separately. In the above example, we first perform HRTA using CAN network. Then we provide the response times of the messages that are received at the gateway node as input jitters to the receiver tasks (attribute inheritance). Finally, HRTA of LIN network is performed.
However, the implemented HRTA does not support the analysis of transactions that are distributed cyclically on multiple networks, i.e., the transactions that are distributed over more than one network and first and last task of the transaction are located on the same network.
Task1 Task1 Task2 Task1
CAN Node1 Node2 Gateway Node Node3 Task1 LIN Node4 Node5 Task1
Figure 8. Multiple networks in a DRE system
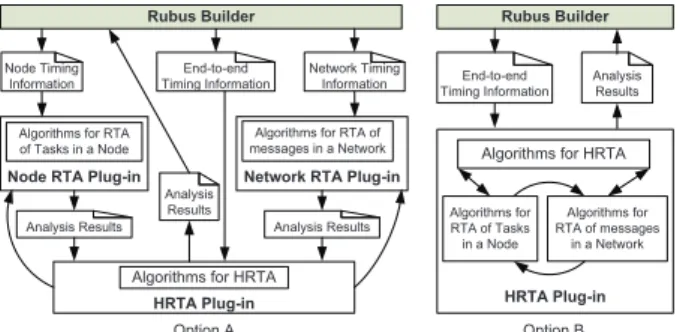
F. Sequential Execution of Plug-ins in Rubus Plug-in Framework
The Rubus plug-in framework allows only sequential execution of plug-ins. Hence, a plug-in has to execute to completion and terminate before running the next plug-in. It should be noted that there exists a plug-in in Rubus-ICE that performs RTA of tasks in a node and it is already in the industrial use. There are two options to develop HRTA plug-in for Rubus-ICE, i.e., option A and B as shown in Figure 9.
The option A supports reusability by building the HRTA plug-in upon the existing Node RTA Plug-in. Thus, HRTA plug-in is built by integrating existing RTA plug-in and two new plug-ins, i.e., one implementing network RTA algo-rithms and the other implementing holistic RTA algorithm. In this case HRTA plug-in is very light weight. It iteratively uses the analysis results produced by the node and the network RTA plug-ins and accordingly provides new inputs to them until converging holistic response times are ob-tained. On the other hand, option B requires the development of HRTA plug-in from the scratch, i.e, implementing the algorithms of node, network and holistic RTA. This option does not support any reuse of existing plug-ins.
Node RTA Plug-in
Rubus Builder
Algorithms for RTA of Tasks in a Node Node Timing
Information
Network RTA Plug-in
Algorithms for RTA of messages in a Network Network Timing
Information
HRTA Plug-in
Algorithms for HRTA End-to-end Timing Information Rubus Builder HRTA Plug-in Algorithms for RTA of Tasks in a Node Algorithms for RTA of messages in a Network Algorithms for HRTA End-to-end Timing Information
Analysis Results
Analysis Results Analysis Results Analysis
Results
Option A Option B
Figure 9. Options to develop HRTA Plug-in for Rubus-ICE
Since, option A allows the reuse of a pre-tested and heavy weight (having most complex algorithms compared to network and holistic RTA) node RTA plug-in, it is easy to implement and requires less time for implementation, integration and testing compared to option B. However, the
implementation method in option A is not supported by the plug-in framework of Rubus-ICE because the plug-ins can only be sequentially executed and one plug-in can not execute the other. Hence, we had to select option B for the implementation of HRTA.
G. Presentation of Analysis Results
When HRTA of a modeled application has been per-formed, the next issue is how to present the analysis results. There can be a large number of tasks and messages in the system. It may not be appropriate to display the response time of all the tasks and messages because it may contain a lot of useless information (if the user is not interested in all of it). Furthermore, presenting the response times of only DTs to the user may not be appropriate because there may be hundreds of DTs in a DRE application. A way around this problem is to provide the response times of only those tasks and DTs which have deadline requirements (specified by the user) or which produce control signals for external actuators (e.g., the analysis results of case study that will be discussed in Section VIII). Apart from this, we also provide an option for the user to get detailed analysis results. H. Interaction between the User and HRTA Plug-in
We identified that it is important to provide a progress report of HRTA plug-in during its execution. Based on the progress, the user should be able to interact with the plug-in while it is running. The HRTA algorithm iteratively runs the algorithms of node RTA and network RTA until converging values of the response times are computed or the computed response times exceed the deadlines (if deadlines are specified). We feel that it is important to display the number of iterations, running time and over all progress of the plug-in during its execution. Moreover, the user should be able to stop, rerun or exit the plug-in at any time. I. Suggestions to Improve Schedulability Based on Analysis Results
If the analysis results indicate that the modeled system is unschedulable, it can be interesting if HRTA plug-in is able to provide suggestions (e.g., by varying system parameters) guiding the user to make the system schedulable. However, it is not trivial to provide such feedback because there can be so many reasons behind the system being not schedulable. The support for this type of feedback in HRTA plug-in will be provided in the future.
J. Requirement for Continuous Collaboration between Inte-grator and Implementer
Our experience of integrating HRTA plug-in with Rubus-ICE shows that there is a need of continuous collaboration between the integrator of the plug-in and its implementer especially in the phase of integration testing (see next Sec-tion). This collaboration is more obvious when the plug-in
is developed in isolation by the implementer (from research background) and integrated with the industrial tool chain by the integrator (with limited experience of integrating complex real-time analysis but aware of overall objective). A continuous consultation and communication was required between the integrator and the implementer for the verifica-tion of the plug-in. Examples of small DRE systems with varying architectures were created for the verification. The implementer had to verify these examples by hand. The integration testing and verification of HRTA plug-in was non-trivial and most tedious activity.
V. TESTING ANDEVALUATION
In this section we discuss our test plan for both standalone and integration testing of HRTA plug-in. Error handling and sanity checking routines make a significant part of the implementation. The purpose of these routines is to detect and isolate faults and present them to the user during the analysis. Our test plan contains the following sets of error handling routines.
• A set of routines evaluating the validity of all inputs:
attributes of all nodes, transactions, tasks, networks and messages in the system.
• A set of routines evaluating the validity of linking and
tracing information of all DTs in the system.
• A set of routines evaluating the validity of intermediate
results that are iteratively inherited as inputs (e.g., a message inheriting the worst-case response time of the sender tasks as a release jitter).
• A set of routines evaluating the overload conditions
during the analysis. For example, processor utilization exceeding 100%, presence of direct cycles in the sys-tem, etc. Since HRTA algorithm is iterative, the analysis may never terminate in the presence of these conditions.
• A set of routines evaluating variable overflow during
the analysis. A. Standalone Testing
Standalone testing means testing the implementation of HRTA before it is integrated as a plug-in with the Rubus builder tool. In other words, it refers to the testing of HRTA in an isolation. The following input methods were used for standalone testing.
1) Hard coded input test vectors.
2) Test vectors are read from external files.
3) Test vectors are generated using a test case generator (a separate program). This generator produces test cases with varying architectures. It also randomly inserts invalid inputs to check if the error handling routines are able to catch the errors.
The analysis results provided by the plug-in corresponding to the test vectors in the first two input methods were also verified by hand.
B. Integration Testing
Integration testing refers to the testing of HRTA plug-in after integrating it with the Rubus builder tool. Although standalone testing is already performed, the integration of HRTA with Rubus-ICE may induce unexpected errors. Our experience shows that integration testing is much more difficult and time consuming activity compared to standalone testing. The following input methods were used for integra-tion testing.
1) Test vectors are read from external files.
2) Test vectors are manually written in ICCM file (see Figure 1) to make it appear as if test vectors were extracted from the modeled application.
3) Test vectors are automatically extracted from several DRE applications modeled with RCM.
The analysis results provided by the plug-in corresponding to all types of test cases were also verified by hand.
VI. AUTOMOTIVECASESTUDY
We provide a proof of concept for the analysis approach that we implemented in Rubus-ICE by conducting an auto-motive case study. First, we model an Autonomous Cruise Control (ACC) system with RCM using Rubus-ICE. Then, we analyze the modeled ACC system using HRTA plug-in. A. Autonomous Cruise Control System
A cruise control system is an automotive feature that allows a vehicle to automatically maintain a steady speed to the value that is preset by the driver. It uses velocity feedback from the speed sensor (e.g., a speedometer) and accordingly controls the engine throttle. However, it does not take into account traffic conditions around the vehicle. Whereas, an Autonomous Cruise Control (ACC) system allows the cruise control of the vehicle to adapt itself to the traffic environment without communicating with the surrounding vehicles. Often, it uses a radar to create a feedback of distance to and velocity of the preceding vehicle. Based on the feedback, it either reduces the vehicle speed to keep a safe distance and time gap from the preceding vehicle or accelerates the vehicle to match the preset speed specified by the driver [30].
An ACC system may be divided into four subsystems, i.e., Cruise Control, Engine Control, Brake Control and User Interface subsystem [31]. Figure 10 shows the block diagram of ACC system. The subsystems communicate with each other via a CAN network.
1) User Interface Subsystem: The User Interface (UI) subsystem reads inputs (provided by the driver) and shows status messages and warnings on the display screen. The inputs are acquired by means of switches and buttons mounted on the steering wheel. These include Cruise Switch input (corresponding to ON/OFF/Standby states for ACC), Set Speed input (desired cruising speed set by the driver) and desired clearing distance from the preceding vehicle. Apart
from user inputs, it also receives some other parameters from the rest of the subsystems via CAN network. These include linear and angular speed of the vehicle, i.e., kilometer per hour (KPH) and revolution per minute (RPM), status of man-ual brake sensor, state of ACC subsystem, status messages and warnings to be displayed on the screen. Apart from showing status messages and warnings, it sends messages (including status of driver’s input) to other subsystems.
Controller Area Network (CAN)
Brake Control Subsystem Engine Control Subsystem Cruise Control Subsystem User Interface Subsystem
Figure 10. Block diagram of Autonomous Cruise Control System
2) Cruise Control Subsystem: The Cruse Control (CC) subsystem receives user input information as a CAN mes-sage from the UI subsystem. From the received mesmes-sage it analyzes the state of the cruise control switch; if it is in ON state then it activates the cruise control functionality. It reads input from proximity sensor (e.g., radar) and processes it to determine the presence of a vehicle in front of it. Moreover, it processes the radar signals along with the information received from other subsystems such as vehicle speed to determine its distance from the preceding vehicle. Accord-ingly, it sends control information to the Brake Control and Engine Control subsystems to adjust the speed of the vehicle with the cruising speed or clearing distance from the preceding vehicle. It also receives the status of manual brake sensor from Brake Control subsystem. If brakes are pressed manually then the cruise control functionality is disabled. It also sends status messages to the UI subsystem.
3) Engine Control Subsystem: The Engine Control (EC) subsystem is responsible for controlling the vehicle speed by adjusting engine throttle. It reads sensor input and accord-ingly determines engine torque. It receives CAN messages sent by other subsystems. The messages include information regarding vehicle speed, status of manual brake sensor, and input information processed by UI system. Based on the received information, it determines whether to increase or decrease engine throttle. It then sends new throttle position to the actuators that control engine throttle.
4) Brake Control Subsystem: The Brake Control (BC) subsystem receives inputs from sensor for manual brakes status and linear and angular speed sensors connected to all wheels. It also receives a CAN message that includes control information processed by CC subsystem. Based on this feedback, it computes new vehicle speed. Accordingly, it produces control signals and sends them to the brake and back light actuators. It also sends CAN messages to other subsystems that carry information regarding status of manual brake, vehicle speed and RPM.
B. Modeling of ACC System with RCM in Rubus-ICE In RCM, we model each subsystem as a separate node connected to a CAN network as shown in Figure 11. The selected speed of CAN bus is 500kbps. The extended frame format is selected which means that all frames will use 29-bit identifier [32].
Figure 11. Model of Autonomous Cruise Control System in RCM There are seven CAN messages that are sent by the nodes as shown in Figure 12. A signal data base that contains all the signals sent to the network is also shown. Each signal in the signal database is linked to one or more messages. The extracted attributes of all messages including data size (sm), priority (Pm), transmission type (ξm) and period or
minimum inter-arrival time (Tm) are listed in Table 1.
Figure 12. Model of CAN messages and signal database in RCM A high-level architecture of UI, CC, EC and BC nodes in RCM is shown in Figures 13, 14, 15 and 16 respectively.
Figure 13. Architecture of a User Interface node in RCM
Figure 14. Architecture of a Cruise Control node in RCM
Figure 15. Architecture of a Engine Control node in RCM In this Section, we discuss the internal model of only CC node. The details of internal models of the rest of the nodes are presented in the Appendix A. The CC node
Table I
MESSAGE ATTRIBUTES EXTRACTED FROM THE MODEL AND CORRESPONDING ANALYSIS RESULTS
Msg sm Pm ξm Tm Cm Rm
µSec µSec µSec
m1 8 7 Periodic 10000 320 3860 m2 8 6 Periodic 10000 320 2360 m3 8 4 Periodic 10000 200 2540 m4 8 3 Sporadic 10000 320 7340 m5 2 5 Sporadic 10000 320 6520 m6 2 2 Periodic 10000 200 1200 m7 1 1 Sporadic 10000 180 7500
Figure 16. Architecture of a Brake Control node in RCM
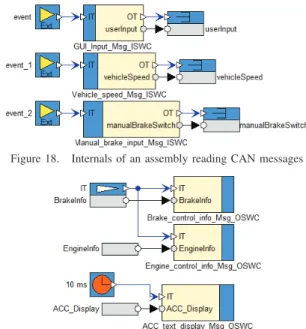
is modeled with four assemblies as shown in Figure 14. An assembly in RCM is a container for various software items. The Input from Sensors assembly contains an SWC that reads radar sensor values as shown in Figure 17. The Input from CAN assembly contains three ISWCs, i.e., GUI Input Msg ISWC, Vehicle speed Msg ISWC and Manual brake input Msg ISWC as depicted in Fig-ure 18. These components receive messages m1 , m6 and m7 from CAN network respectively. Similarly, the assem-bly Output to CAN contains three OSWC components as shown in Figure 19. These components send messages m5 , m4 and m2 to CAN network. The Cruise Control assembly contains two SWCs: one handles the input and cruise control mode signals while the other processes the received information and produces control messages for the other nodes. The internal structure of this assembly is shown in Figure 20.
Figure 17. Internals of an assembly reading sensors C. Modeling of Deadline Requirements
We specify deadline requirements on four DTs in ACC system using a deadline object in RCM. Upon reading the radar signal, these DTs produce brake and engine actuation signals and display information for the driver. All these transactions have a common initiator, i.e., their first task corresponds to the SWC that reads radar signal and is located in the CC node. The last tasks of first and second DTs are located in the Brake Control node. These tasks correspond
to the SWCs SetBrakeSignal and SetBackLightSignal as shown in Figure. 16. The last task of third DT corresponds to SetThrottlePosition SWC and is located in the Engine Control node as shown in Figure. 15. The last task of fourth DT corresponds to GUIdisplay SWC and is located in the User Interface node as shown in Figure. 13.
Figure 18. Internals of an assembly reading CAN messages
Figure 19. Internals of an assembly sending CAN messages
D. HRTA of ACC System using HRTA Plug-in
The run-time allocation of all the components in the model of ACC system results in 19 transactions, 36 tasks and 7 messages. Due to lack of space, the extracted timing attributes and detailed analysis results of all transactions and tasks can not be provided. The transmission times (Cm) and
worst-case response times (Rm) of all messages computed
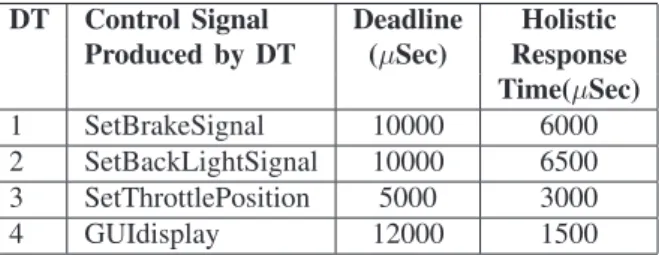
by HRTA plug-in are shown in Table 1. The analysis report in Table 2 provides worst-case holistic response times of four DTs (discussed in the previous subsection) using HRTA plug-in. The corresponding deadlines are also shown. The response time of a DT is counted from the activation of the first task to the completion of the last task in the chain. The response time of these four DTs correspond to the production of control signals for brake actuators, back lights, engine throttle actuator and graphical user interface.
VII. CONCLUSION ANDFUTUREWORK
We presented an implementation of state-of-the-art Holis-tic Response Time Analysis (HRTA) as a plug-in for the industrial tool suite Rubus-ICE. The implemented analysis is general as it supports the integration of real-time analysis of various networks without a need for changing the holistic analysis algorithm. We discussed and solved several issues that we faced during the implementation, integration and evaluation of HRTA plug-in. The experience gained by dealing with the implementation issues provided a feed back
Figure 20. SWCs comprising the Cruise Control assembly
Table II ANALYSISREPORT
DT Control Signal Deadline Holistic
Produced by DT (µSec) Response
Time(µSec)
1 SetBrakeSignal 10000 6000
2 SetBackLightSignal 10000 6500
3 SetThrottlePosition 5000 3000
4 GUIdisplay 12000 1500
to the component model, for example, feed back on the design decisions for efficient run-time allocation of network interface components. We also discussed the steps that we followed for testing and evaluating HRTA plug-in. We found the integration testing to be a tedious and non-trivial activity. Our experience of implementing, integrating and evaluating HRTA plug-in shows that a considerable amount of work and time is required to transfer complex real-time analysis results to the industrial tools.
We provided a proof of concept by modeling an au-tonomous cruise control system using component-based de-velopment and analyzing it with HRTA plug-in. We believe that most of the implementation issues discussed in this paper are generally applicable when real-time analysis is transferred to any industrial or academic tool suite. More-over, the contributions in this paper may provide guidance for the implementation of other complex real-time analysis techniques in any industrial tool suite that supports a plug-in framework (for the integration of new tools) and component-based development of DRE systems.
In the future, we plan to implement the analysis of other network communication protocols (e.g., Flexray, switched ethernet, etc.) and integrate them within HRTA plug-in. Another future work could be the implementation of end-to-end latency analysis in Rubus-ICE to support the analysis of multi-rate real-time systems. We also plan to provide a support for asynchronous data-flow using the two different semantics of data-age and reaction described in [33].
ACKNOWLEDGEMENT
This work is supported by Swedish Knowledge Foun-dation (KKS) within the projects Femmva and EEMDEF, the Swedish Research Council (VR) within project TiPCES, and the Strategic Research Foundation (SSF) with the centre
PROGRESS. The authors would like to thank the industrial partners Arcticus Systems and BAE Systems H¨agglunds.
REFERENCES
[1] N. Audsley, A. Burns, R. Davis, K. Tindell, and A. Wellings, “Fixed priority pre-emptive scheduling:an historic perspective,” Real-Time Systems, vol. 8, no. 2/3, pp. 173–198, 1995.
[2] L. Sha, T. Abdelzaher, K.-E. A. rz´en, A. Cervin, T. P. Baker, A. Burns, G. Buttazzo, M. Caccamo, J. P. Lehoczky, and A. K. Mok, “Real Time Scheduling Theory: A Historical Perspective,” Real-Time Systems, vol. 28, no. 2/3, pp. 101–155, 2004.
[3] K. Tindell and J. Clark, “Holistic schedulability analysis for distributed hard real-time systems,” Microprocess. Microprogram., vol. 40, pp. 117–134, April 1994.
[4] K. W. Tindell, “Using offset information to analyse static priority pre-emptively scheduled task sets,” Dept. of Computer Science, University of York, Tech. Rep. YCS 182, 1992.
[5] J. Palencia and M. G. Harbour, “Schedulability Analysis for Tasks with Static and Dynamic Offsets,” Real-Time Systems Symposium, IEEE International, p. 26, 1998.
[6] “Arcticus Systems,” http://www.arcticus-systems.com.
[7] K. H¨anninen et.al., “The Rubus Component Model for Resource Con-strained Real-Time Systems,” in 3rd IEEE International Symposium on Industrial Embedded Systems, June 2008.
[8] S. Mubeen, J. M¨aki-Turja, M. Sj¨odin, and J. Carlson, “Analyzable Modeling of Legacy Communication in Component-Based Distributed Embedded Systems,” in 37th EUROMICRO Conference on Software Engineering and Advanced Applications (SEAA), 2011, Sep. 2011, pp. 229 –238.
[9] S. Mubeen, J. M¨aki-Turja, and M. Sj¨odin, “Extraction of end-to-end timing model from component-based distributed real-time embedded systems,” in Time Analysis and Model-Based Design, from Functional Models to Distributed Deployments (TiMoBD) workshop located at Embedded Systems Week. Springer, October 2011, pp. 1–6. [10] K. H¨anninen et.al., “Framework for real-time analysis in Rubus-ICE,”
in Emerging Technologies and Factory Automation, 2008. ETFA 2008. IEEE International Conference on, 2008, pp. 782 –788.
[11] C. Liu and J. Layland, “Scheduling algorithms for multi-programming in a hard-real-time environment,” ACM, vol. 20, no. 1, pp. 46–61, 1973.
[12] M. Joseph and P. Pandya, “Finding Response Times in a Real-Time System,” The Computer Journal (British Computer Society), vol. 29, no. 5, pp. 390–395, October 1986.
[13] M. Nolin, J. M¨aki-Turja, and K. H¨anninen, “Achieving Industrial Strength Timing Predictions of Embedded System Behavior,” in ESA, 2008, pp. 173–178.
[14] J. M¨aki-Turja, , and M. Nolin, “Tighter response-times for tasks with offsets,” in Real-time and Embedded Computing Systems and Applications Conference (RTCSA). Springer-Verlag, August 2004. [15] K. Tindell, H. Hansson, and A. Wellings, “Analysing real-time
com-munications: controller area network (CAN),” in Real-Time Systems Symposium (RTSS) 1994, pp. 259 –263.
[16] R. Davis, A. Burns, R. Bril, and J. Lukkien, “Controller Area Network (CAN) schedulability analysis: Refuted, revisited and revised,” Real-Time Systems, vol. 35, pp. 239–272, 2007.
[17] R. I. Davis, S. Kollmann, V. Pollex, and F. Slomka, “Controller Area Network (CAN) Schedulability Analysis with FIFO queues,” in 23rd Euromicro Conference on Real-Time Systems (ECRTS11), July 2011.
[18] S. Mubeen, J. M¨aki-Turja, and M. Sj¨odin, “Extending schedula-bility analysis of controller area network (CAN) for mixed (peri-odic/sporadic) messages,” in Emerging Technologies Factory Automa-tion (ETFA), IEEE 16th Conference on, sept. 2011.
[19] Mubeen, Saad and M¨aki-Turja, Jukka and Sj¨odin, Mikael, “Extending response-time analysis of controller area network (CAN) with FIFO queues for mixed messages,” in Emerging Technologies Factory Automation (ETFA), IEEE 16th Conference on, sept. 2011, pp. 1–4. [20] S. Mubeen, J. M¨aki-Turja, and M. Sj¨odin, “Implementation of Holistic
Response-Time Analysis in Rubus-ICE: Preliminary Findings, Issues and Experiences,” in The 32nd IEEE Real-Time Systems Symposium (RTSS), WIP Session, December 2011, pp. 9–12.
[21] “MAST–Modeling and Analysis Suite for Real-Time Applications,” http://mast.unican.es/.
[22] “The Volcano Family,” http://www.mentor.com/products/vnd. [23] “Volcano Network Architect (VNA). Mentor Graphics,” http://www.
mentor.com/products/vnd/communication-management/vna. [24] A. Hamann, R. Henia, R. Racu, M. Jersak, K. Richter, and R. Ernst,
“Symta/s - symbolic timing analysis for systems,” 2004.
[25] M. Hagner and U. Goltz, “Integration of scheduling analysis into uml based development processes through model transformation,” in Com-puter Science and Information Technology (IMCSIT), Proceedings of the 2010 International Multiconference on, oct. 2010, pp. 797 –804. [26] “RAPID RMA: The Art of Modeling Real-Time Systems,”
http://www.tripac.com/rapid-rma.
[27] D. Schmidt and F. Kuhns, “An overview of the Real-Time CORBA specification,” Computer, vol. 33, no. 6, pp. 56 –63, Jun. 2000. [28] M. Hagner and U. Goltz, “Integration of scheduling analysis into uml
based development processes through model transformation,” in Com-puter Science and Information Technology (IMCSIT), Proceedings of the 2010 International Multiconference on, oct. 2010, pp. 797 –804. [29] Mubeen, Saad and M¨aki-Turja, Jukka and Sj¨odin, Mikael, “Tracing event chains for holistic response-time analysis of component-based distributed real-time systems,” SIGBED Review, vol. 8, pp. 48–51, Sep. 2011. [Online]. Available: http://doi.acm.org/10.1145/2038617.2038628
[30] P. Berggren, “Autonomous Cruise Control for Chalmers Vehicle Sim-ulator,” Master’s thesis, Department of Signals and Systems, Chalmers University of Technology, 2008.
[31] “Adaptive Cruise Control System Overview,” in Work-shop of Software System Safety Working Group, April 2005, Anaheim, California, USA. Available at: sunny-day.mit.edu/Adaptive Cruise Control Sys Overview.pdf.
[32] ISO 11898-1, “Road Vehicles interchange of digital information controller area network (CAN) for high-speed communication, ISO Standard-11898, Nov. 1993.”
[33] N. Feiertag, K. Richter, J. Nordlander, and J. Jonsson, “A Compo-sitional Framework for End-to-End Path Delay Calculation of Auto-motive Systems under Different Path Semantics,” in Compositional Theory and Technology for Real-Time Embedded Systems, 2008. CRTS 2008. Workshop on, dec. 2008.
APPENDIXA
Internal Model of Engine Control Node in RCM
The Engine Control node is modeled with four assemblies as shown in Figure 15. The Input from Sensors assembly contains a SWC that reads the sensor values corresponding to the engine torque as shown in Figure 21.
Figure 21. Engine Control Node: internals of an assembly reading sensors The Input from CAN assembly contains three ISWCs, i.e., Vehicle Speed Msg ISWC, Engine control info Msg ISWC and Manual brake input Msg ISWC as shown in Figure 22. These components receive messages m6 , m4 and
m7 from CAN network respectively. The third assembly, Output to Actuators as shown in Figure 23, contains the SWC that produces control signals for the engine throttle actuator. The fourth assembly, i.e., Engine Control as shown in Figure 24, contains two SWCs: one handles and processes the inputs from sensors and received messages while the other computes the new position for engine throttle.
Figure 22. Engine Control Node: internals of an assembly reading CAN messages
Figure 23. Engine Control Node: internals of an assembly producing actuation signals
Internal Model of Brake Control Node in RCM
The Brake Control node is modeled with five assemblies as shown in Figure 16. The Input from Sensors assembly contains three SWCs as shown in Figure 25. These SWCs read the sensor values that correspond to the values of speed, rpm and manual brake sensors in the vehicle. The Input from CAN assembly, shown in Figure 26, contains the ISWC component Brake control info Msg ISWC that receives a message m5 from CAN network.
Figure 25. Brake Control Node: Internals of an assembly reading sensors
Figure 26. Brake Control Node: Internals of an assembly reading CAN messages
The third assembly, i.e., Brake Control as shown in Figure 27, contains two SWCs: one handles and processes the inputs from sensors and received messages while the other computes the control signals for brake actuators. The fourth assembly Output to CAN contains three OSWC components as shown in Figure 28. These components send messages m7 , m6 and m3 to CAN network. The fifth assembly, Output to Actuators as shown in Figure 29, contains the SWCs that produce control signals for the brake actuators and back light controllers.
Figure 24. Engine Control Node: SWCs comprising the Engine Control assembly
Figure 27. Brake Control Node: Internals of Brake Control assembly
Figure 28. Brake Control Node: Internals of an assembly sending CAN messages
Figure 29. Brake Control Node: internals of an assembly producing actuation signals
Internal Model of User Interface Node in RCM
The User Interface node is modeled with three assem-blies along with two SWCs as shown in Figure 13. The GUI Control SWC handles the input from the sensors and messages from the CAN network. After processing the information, it not only produces information for Graphical User Interface (GUI), but also computes control signals for the other nodes. The GUIdisplay SWC sends the signals (corresponding to updated information) to GUI in the car. The Input from Sensors assembly contains two SWCs as shown in Figure 30. One of them reads the sensor values that correspond to the state of the cruise control switch on the steering wheel. The other SWC reads the sensor values that correspond to the vehicle cruising speed set by the driver. The Input from CAN assembly contains four ISWC compo-nents, i.e., Vehicle Speed Msg ISWC, RPM Msg ISWC, ACC text display Msg ISWC and Manual brake input
Msg ISWC as shown in Figure 31. These compo-nents receive messages m6 , m3 , m2 and m7 from CAN network respectively. The third assembly, i.e., Out-put to CAN Periodic sends a message m1 to CAN network via the OSWC component as shown in Figure 32.
Figure 30. User Interface Node: internals of an assembly reading sensors
Figure 31. User Interface Node: internals of an assembly reading CAN messages
Figure 32. User Interface Node: internals of an assembly sending CAN messages