Deliverable 3.1
DEL3.1
Regulation knowledge
presentation
Date of delivery:
2
nd
of July 2010
Dissemination:
Public
Project information
Project Duration:01/07/2008 – 31/12/2011
Project Coordinator:
Walter Maibach (walter.maibach@ptv.de) PTV Planung Transport Verkehr AG
Kriegerstr.15 70191 Stuttgart Germany
Technical Coordinator:
Rigobert Opitz (rigobert.opitz@rocgmbh.com) ROC Bernard GmbH
Elisabethstr. 69 8010 Graz Austria
Document information
Version Date Action Partner
0.1 08/03/2010 Internal D3.1 delivery UNIMORE
0.2 16/06/2010 The first internal D3.2 draft VTI 0.3 25/06/2010 Integration of internal D3.1 and D3.2 VTI
Title: ASSET – DEL3.1 Regulation knowledge presentation
Authors: Luca Canovi, University of Modena and Reggio Emilia Luca Minin, University of Modena and Reggio Emilia Jan Anderson, Statens väg-och Transportforskningsinstitut Jesper Sandin, Statens väg-och Transportforskningsinstitut Katja Kircher, Statens väg-och Transportforskningsinstitut Matti Kutila, VTT Technical Research Centre of Finland Virpi Britschgi, VTT Technical Research Centre of Finland
Adrian Sachelarie, The „Gheorghe Asachi” Technical University of Iasi Paul Barsanescu, The „Gheorghe Asachi” Technical University of Iasi Stautz Janos, Clarity Consulting Information and Management Services Bernd Eckstein, University of Stuttgart
Reviewers: Luca Canovi, University of Modena and Reggio Emilia Luca Minin, University of Modena and Reggio Emilia
Roberto Montanari, University of Modena and Reggio Emilia Jan Anderson, Statens väg-och Transportforskningsinstitut Jesper Sandin, Statens väg-och Transportforskningsinstitut
Copyright: © Copyright 2009 – 2011. The ASSET-Road Consortium
This document and the information contained herein may not be copied, used or disclosed in whole or part except with the prior written permission of the partners of the ASSET-Road Consortium. The copyright and foregoing restriction on copying, use and disclosure extend to all media in which this information may be embodied, including magnetic storage, computer print-out, visual display, etc.
The information included in this document is correct to the best of the authors’ knowledge. However, the document is supplied without liability for errors and omissions. All rights reserved.
Contents
Project information ... 2 Document information ... 3 Contents ... 5 Executive summary ... 8 1 Europe study ... 10 1.1 Introduction ... 101.1.1 Fatality rates and risk 11 1.1.2 Road user types, road types and accidents causes 15 1.1.3 ASSET-Road 18 1.1.4 The present study 19 1.2 Method ... 19 1.3 Analysis ... 22 1.4 Elaborated results ... 23 1.4.1 Background aspects 23 1.4.2 Personal opinions 33 1.4.3 Regulation knowledge 46 1.5 Conclusions ... 53 1.6 Further steps ... 56 2 Tanzania study ... 57
2.1 Road safety in Tanzania ... 58
2.1.1 Other Studies 59
2.1.2 Road Network 60
2.2 Method ... 61 2.3 Results ... 61 2.3.1 Descriptives 62 2.3.2 Safety Related 62 2.4 Discussion ... 66 2.4.1 Safety Related 67 2.4.2 Vehicle Related Problems 70 2.4.3 Road Related Problems 70 2.4.4 Other Issues 71 2.4.5 Conclusions 71 3 Studies comparison ... 73
4 Driver support system development ... 74
4.1 Live In-vehicle Smart Assistant (LISA) ... 74
4.2 System architecture ... 75 4.3 System requirements ... 76 4.4 Application scenarios ... 76 4.5 Information provided ... 76 4.6 Information management ... 78 4.7 Levels of automation ... 79 5 Simulator study ... 80 5.1 Scenario setup ... 80 5.2 Situation identification ... 82 5.2.1 Countries 83 5.2.2 Events 83 5.2.3 Conditions 85 5.3 Test drivers ... 86
5.4 Simulator iterations ... 86
6 VTI simulator ... 87
6.1 General description ... 87
6.2 Visual system ... 87
6.3 Moving base system ... 88
6.4 Technical data ... 88
6.5 Applications ... 89
6.6 Simulator environment ... 89
6.7 Data collection tools ... 89
6.8 Scenarios ... 90
7 References ... 91
ANNEX A – Questionnaire for study in Europe... 93
ANNEX B – Personal opinions tables ... 103
ANNEX C – Questionnaire version for police ... 109
Executive summary
The ASSET-Road project is focussing on improving road safety and road traffic by pushing different transportation stakeholders to interact between each other and integrating modern communication and sensing technologies. The vision of the project as Description of Work states is:
…substantially contribute to safe and sustainable transportation by linking road traffic and safety information from all essential system elements. Improving driver awareness and behaviour is a key issue.
This will be achieved through an advanced sensor and processing network providing assistance and information for drivers, traffic control agencies and infrastructure operators.
Since the area of what the project is dealing with is large covering theories, practices, technologies, hard- and software and different application areas, this deliverable focuses on a specific road safety issue, that has not been deeply investigating during years: behaviours of heavy vehicles drivers, and how their behaviours are influenced by their level of knowledge. Starting from that, the topic of the research described here is the design of an In-Vehicle Information support Systems, including information provision strategies and HMI.
In fact, in the global project vision a crucial aspect are drivers, and a key success factor is analyzing their behaviours while driving, as a starting point to implement innovative strategies to mitigate risks of crashes and reduce negative impacts on all systems’ components (users first).
This is the main objective of Work Package 3, and it could be specified as follows:
1. to investigate driver compliance with road regulations and safe driving practices, in order to assess their knowledge and confidence of traffic regulations and the consequences of hazardous behavior and rule violations;
2. to fill the gap between current and desired driver knowledge with regards to regulation, using an informative approach;
3. to design Interactive Intelligent HMI (LISA) as smart In-Vehicle Information System, which will keep drivers aware about road scenarios, regulations and potentially
safety-critical situations, minimizing distraction through an ergonomic-based interface design;
4. to design and process a simulator study using smart ITS prototype devices to observe drivers behaviour and performances during the interaction.
This deliverable is the result of the project tasks 3.1 (Regulation knowledge & awareness study), 3.2 (Situation identification & information presentation) and part of task 3.3 (Smart information provision Mechanism & HMI). In brief, objectives of the deliverable are: 1. to report the study conducted in task 3.1 where information about how deep drivers’
knowledge is (for truck and coaches drivers) have been collected in several countries in relation to road and safety regulations (e.g. speed limits on different roads, traffic rules, safety equipments, etc.). This is the first part of the document and includes two studies, the first one conducted in Europe and the second one conducted in Tanzania; a comparison between them is proposed;
2. to describe the smart In-Vehicle Information System specifications based on the requirements collected in WP1 (task 1.2 Users needs and requirements). In this section systems features are briefly introduced and the simulator study setup where the system will be tested is described, including scenario setup, situation identification and simulator iterations.
The work conducted in task 3.1 and 3.2 generated two internal reports merged and harmonized in this document, specifically; a report on drivers knowledge study and a white paper describing the design of the support system and simulator scenarios for future tests. As the whole deliverable DEL 3.1 is public, it will be integrated to and presented via the ASSET web page: (www.project-asset.com) for public access.
1
Europe study
The first section of this document describes an interview study on traffic safety conducted on 256 drivers divided into 119 truck drivers and 134 bus drivers, and three drivers who drove both bus and truck.
Data have been collected in several European countries, namely:
Finland; Hungary; Italy; Romania; Sweden.
1.1
Introduction
This study is aimed at assessing basic knowledge of heavy vehicles drivers related to road
rules and regulation: the ones they know, the ones they feel unsure about and the ones
they should know in order to grant a high level of safety during their routes.
A key issue of this survey is to investigate cross-countries knowledge, that is, how drivers are aware of different rules and regulations in different countries, what do those differences means and how to manage them: for this reason, drivers who are used to cross country routes have been involved.
The minimum target number of subjects has been set to 40 for each country (200 totals). The following table shows the distribution of participants among involved countries. Note that a participant from Italy (for instance) could be a Swede, i.e. the place of survey collection and participant nationality could differ. All in all 256 participants answered the survey.
Number of participants for each involved country.
Country Truck drivers Bus drivers Both TOTAL
Finland 25 15 3 43
Hungary 20 70 90
Romania 20 20 40
Sweden 27 17 44
TOTAL 119 134 3 256
In the following paragraphs an overview of statistical data (coming from CARE database [1]) is presented. The purpose of this overview is to set this study into Heavy Goods Vehicles (HGVs), Buses and Coaches accidents context. Data shown are related to different EU-levels. The different EU-levels include different countries, as defined in the following table.
Definition of EU-level and used Country abbreviations.
EU 14 includes: EU 16 = EU 14 + BE Belgium EE Estonia DK Denmark HU Hungary EL Greece ES Spain EU 17 = EU 16 + FR France MT Malta IE Ireland IT Italy EU 27 = EU 17 + LU Luxembourg BG Bulgaria NL Netherlands CZ Czech Republic AT Austria CY Cyprus PT Portugal DE Germany FI Finland LV Latvia SE Sweden LT Lithuania UK United Kingdom PL Poland
RO Romania SI Slovenia SK Slovakia
1.1.1
Fatality rates and risk
Road traffic accidents involving HGVs tend to be more severe than other accidents because of the great size and mass of these vehicles. Crashes involving buses and coaches could lead to similar consequences, because they are normally relatively large too and, in addition, they transport people.
Table 1 presents the number of people killed in accidents involving HGVs in each of the EU-17 countries for each year for which the data are available over the last ten years. The total number killed in these accidents are shown in Figure 1. The total fell from 4.586 in 1996 to 3.350 in 2005, a reduction of 27%.
Table 1. Fatalities in accidents involving Heavy Goods Vehicles, 1996-2005.
Source: CARE Database / EC.
Table 2 reports the number of people killed in each of the EU-17 countries over the last ten years in accidents involving buses and coaches.
The total number of people killed in these accidents fell from 888 in 1996 to 633 in 2005, a reduction of 29%. The totals from this and the previous table are presented in Figure 1. They have fallen in parallel, with approximately five times as many people killed per year in accidents involving HGVs as in accidents involving buses or coaches. National data for bus and coach accidents will not be presented, because of the relatively small numbers.
Table 2. Fatalities in accidents involving Buses or Coaches, 1996-2005.
Source: CARE Database / EC.
Figure 1. The number of fatalities in accidents involving Heavy Goods Vehicles and Buses or Coaches, EU-14, 1996-2005.
Source: CARE Database / EC.
The risk of being killed in one of these accidents can be compared for each member state using the rate of deaths per million population. The EU-17 average fatality rate in accidents involving HGVs is 11.5 per million population, and ranges from 5.7 in Italy to 37.2 in Estonia. For accidents involving buses or coaches, the EU-17 average fatality rate is 2.1 per million, and ranges from 0.5 in Ireland to 5.2 in Estonia (the high rate in Luxembourg is based on only 4 fatalities).These rates for 2005 are shown in Table 3 and Figure 2.
Table 3. The fatality rates per million population in accidents involving HGVs and Buses or Coaches, 2005.
Source: CARE Database / EC.
Figure 2. The fatality rates in accidents involving HGVs and Buses or Coaches, 2005. Source: CARE Database / EC.
Averaged over the EU-17 countries, 13.3% of deaths occurred in 2005 in accidents involving Heavy Goods Vehicles, and 2.6% in accidents involving buses or coaches. Figure 3 shows considerable variation about these averages in individual countries.
Figure 3. The proportion of fatalities in accidents involving HGVs and in accidents involving buses or coaches, 2005.
Source: CARE Database / EC.
Figure 1 showed that the number of deaths in accidents involving Heavy Goods Vehicles and in accidents involving Buses or Coaches fell between 1996 and 2005, but the EU-14 total number of deaths also fell over this period. Figure 4 depicts that these numbers tended to fall as a proportion of the total.
Figure 4. The proportion of fatalities in accidents involving Heavy Goods Vehicles and Buses or Coaches, EU-14, 1996-2005.
Source: CARE Database / EC.
1.1.2
Road user types, road types and accidents causes
These accidents injured those outside the vehicles as well as their occupants. Across the EU-17, 12.9% of those killed in HGV accidents in 2005 were occupants of HGVs, and 15.3% of those killed in Bus or Coach accidents were occupants of Buses or Coaches. Table 4 lists those killed in these accidents in the latest year by road user type. The distributions are illustrated in Figure 5. The road user type with the highest fatality rates in accidents
involving both HGVs and buses or coaches are the car occupants; 54% for HGVs and 37%
of the buses or coaches accidents.
Table 4. Fatalities in accidents involving HGVs and in accidents involving Buses or Coaches, by road user type, EU-17, 2005.
Source: CARE Database / EC.
Figure 5. Distribution of fatalities in accidents involving HGVs and in accidents involving Buses or Coaches, by road user type, EU-17, 2005.
Source: CARE Database / EC.
CARE data distinguish accidents that occurred on motorways and, for non-motorway accidents, whether on urban or rural roads. Motorway accidents are not fully recorded in Greece and Finland, and there were no fatal HGV accidents in Malta. Table 5 shows the distribution of fatalities in accidents involving HGVs and in accidents involving Buses or Coaches for the remaining countries. The results for the 14 EU countries in the latest year are illustrated in Figure 6.
Table 5. Distribution of fatalities in accidents involving HGVs by road type, 2005.
Source: CARE Database / EC.
Figure 6. Distribution of fatalities in accidents involving HGVs and in accidents involving Buses or Coaches by road type, EU-14, 2005.
Source: CARE Database / EC.
The major accidents causes for HGVs and buses or coaches are now introduced, i.e. speed, driver fatigue and alcohol.
Speed
Speed is at the core of the road safety problem. In fact, speed is involved in all accidents. In
around 30% of the fatal accidents speed is an essential contributory factor. First of all,
speed affects the risk of being involved in an accident. At a higher speed it is more difficult to react in time and prevent an accident. Moreover, speed affects the injury consequences of an accident. At a higher (impact) speed, more energy is released when colliding with another vehicle, road user or obstacle.
Speed limits provide information to the drivers about the safe travel speed in average conditions. Exceeding the speed limits is very common. Typically, 40 to 50% of the drivers travel faster than the speed limit. Typically, 10 to 20% exceed the speed limit by more than 10 km/h. In addition, drivers adapt their speed insufficiently to local and temporary
conditions related to traffic and weather. They often set a speed that is inappropriate for the prevailing conditions. Speed choice is related to the drivers' habits, attitudes, risk perception and risk acceptance. Furthermore, speed choice is affected by road characteristics, driving context and vehicle configuration.
Fatigue
Fatigue is a major factor in a large proportion of road crashes (varies between 10-30% in different studies). Several studies suggest that there is a correlation between fatigue and
crash risk (Anund, 2008, for an overview). A person who drives after being awake for 17 hours has a risk of crashing equivalent to being at the 0.05 blood alcohol level (i.e. twice the normal risk). The increased risk often results from a combination of biological, lifestyle- and work-related factors.
Alcohol
About 25% of all road fatalities in Europe are alcohol related whereas about only 1% of all kilometres driven in Europe are driven by drivers with 0.5 g/l alcohol in their blood or more. The crash rate increases with Blood Alcohol Concentration (BAC) in the driver: this increment is progressive. Compared to a sober driver the crash rate of a driver with a BAC of 0.8 g/l (still the legal limit in 3 of 25 EU-member states) is 2.7 times that of sober drivers. When a driver has a BAC of 1.5 g/l his crash rate is 22 times that of a sober driver. Not only the crash rate grows rapidly with increasing BAC, the crash also becomes more severe. With a BAC of 1.5 g/l the crash rate for fatal crashes is about 200 times that of sober drivers.
1.1.3
ASSET-Road
The ASSET-Road project is mainly concerned with improving traffic safety in Europe with new methods like vehicle‐to‐infrastructure technologies. The main focus is directed at heavy vehicles, as they constitute a substantial traffic hazard due to different reasons, especially they drive much longer distances, which puts great demands on the drivers, both in terms of driver state and knowledge about traffic regulations in different countries, and they lead potential destructive impact if involved into crashes. Overloading and insufficient vehicle maintenance is other common factors that are detrimental to road safety.
Further information about the ASSET-Road project in general can be found on www.project-asset.com.
1.1.4
The present study
In order to increase traffic safety, and reduce problems with understanding traffic regulations, the ASSET-Road project evaluates driver support functionalities provided by driver support systems. However in order to develop good functions, i.e. functions that truck and bus drivers need to be able to reduce problems with regulations, the ASSET-Road project carried out a survey to collect experiences of traffic regulations. To be able to develop the needed functionalities, truck and bus drivers’ opinions were considered. This report is the documentation of the questionnaire study.
1.2
Method
A questionnaire containing 32 questions, some of them with sub‐questions, on traffic safety for experienced by truck and bus drivers from different European countries was developed. The complete questionnaire is divided into 3 sections:
SECTION A – BACKGROUND INFORMATION. The aim of this section is to analyze and
categorize subjects involved in the survey. For this reason demographic information like age, nationality and gender were collected, together with driving experience information (when drivers got their professional licence and how long they have been working as professional drivers), and additional data about the type of driven vehicle. As mentioned above, the distinctive aspect of this research is to assess drivers’ knowledge in different countries: therefore, in this section specific questions about countries most frequently drivers pass through and routing habits (i.e. whether they have a routine destination or not) were asked.
Moreover, 2 questions concern duration and frequency of drivers’ routes were proposed, in order to assess the impact of physical and mental efforts on driver’s efficiency and safety.
SECTION B - PERSONAL OPINIONS. The aim of this section is to collect data on drivers
thoughts about safety priorities, which factors are more important for safe driving, which are their planning modalities and information sources.
Useful information about on-board systems for safety (i.e. Drivers Assistance Systems – DAS - and Advanced Drivers Assistance Systems - ADAS) were collected in order to assess drivers’ familiarity with these technologies and, more important, to assess if they feel their absence as a need to be satisfied.
The final question of this section concerned road signs in different countries: in fact, while symbols are almost the same all over Europe, textual information associated to symbols change consistently creating language barriers which could have negative effects on global safety.
SECTION C - QUESTIONS ABOUT REGULATIONS. This section is focused on the most
important road rules and regulations and it is aimed at assessing driver’s specific knowledge.
In particular, questions concerning the maximum number of hours per week and month drivers are allowed to work were proposed, investigating drivers approach of one of the most critical issues of heavy vehicles driving: drivers tiredness and decreasing of attention and reflexes.
Moreover, questions about vehicles maintenance and safety characteristics (e.g. brakes overheating, minimum thread depth and Blood Alcohol Concentration limits) were proposed.
The complete questionnaire in English is attached as ANNEX A.
The questionnaire was developed by Italian and Swedish researchers and before distribution to other nations the questionnaire was piloted in Italy and Sweden. The purpose of the piloting was to investigate the time it took to complete and if the chosen questions were understandable and clear. The piloting ended up in a number of adjustments.
The questionnaire was then distributed to researchers in Finland, Hungary, and Romania. The researchers in different countries were asked to reflect and comment on one final version. When the adjustments were handled accordingly, involved partners distributed the questionnaire to at least 20 bus drivers and 20 truck drivers with experience in their own country.
However, since the English version was translated by a number of researchers from a number of nations, small differences between questionnaire versions exist. Thus, small
differences exist, these differences were considered during data analysis. The most
serious problem was the differences among scale levels. This issue was solved by scaling down to a more fine scale, making data from different questionnaires compatible.
Data collection was conducted differently in different countries:
FINLAND (VTT): The questionnaire papers were left to a foreman in one company office
and the plan was to come and collect the filled-in papers after two weeks. However, some respondents acted independently and sent the forms back to VTT by mail, and after two weeks, VTT had about 15 filled-in forms. This wasn't a very productive way to gather information, because most of the drivers spent so little time in the company office that they probably didn't have a chance to get the questionnaire in their hands at all. Another methods for data collection was therefore tested, and researchers decided to go to Germany (Travemunde) by ferry to meet drivers in the ferry and deliver the questionnaire
papers face-to-face. This was found to be effective: answers from 25 drivers were collected during the journeys between Helsinki and Travemunde. All persons contacted face-to-face were willing to fill in the questionnaire. Respondents were given the opportunity to answer completely anonymous. Empty, non-coded envelopes were enclosed with all the questionnaire forms, and the filled-in questionnaire forms could be put in the envelope afterwards.
ITALY (UNIMORE): Participants were selected basing on their availability and schedules. In
order to make questionnaire compilation as quick as possible, UNIMORE agreed with responsible that it could be done in no more than 2 sessions. UNIMORE personally contacted drivers’ responsible and they gave them an overview of the ASSET-Road project. Then, they described in details specific activities treating heavy vehicles safety topics and why we decided this survey could be very useful. Afterwards, responsible forwarded the same information to drivers through private talks: this approach was adopted because drivers schedule made quite difficult to organize a plenary session to present the project to them all. Two sessions for questionnaires filling were planned. The presentation of the survey was quite effective and participants joined pleased. Responsible left participants the opportunity to compile questionnaires in a room, and gave them 30 minutes to do it. Even if questionnaires are anonymous, their participation was not anonymous, allowing responsible to trace drivers from their age and nationality.
HUNGARY (CLC): Random companies and random respondents were contacted by
telephone, e-mail using some contacts and some conf calls. Approximately 40% of the companies approached were willing to participate; no data about the refusal rate among the approached employees were collected. Questionnaires collection was made by mail and e-mail. Questionnaires were anonymous, only company name and the participants’ number were filled in.
ROMANIA (TUI): Initially data were collected by truck and bus drivers from companies in
Iasi, Oradea and a large international transport company from Sibiu. First results obtained seemed unrealistic so a new data collection session was performed during summer 2009 in Constanta and Bucharest. During this run, data were collected talking personally with truck, bus and coach drivers gathering the desired number of respondents, i.e., 20 trucks and 20 bus drivers.
SWEDEN (VTI): The Asset-Road partner in Sweden (VTI) used a number of their previous
contacts at different companies and received contact information to approximately 30 bus drivers and 30 truck drivers. The questionnaires were distributing by the companies or sent directly home to drivers. The questionnaires were filled out at their homes or workplace, on their free time or during work hours. All participants were thanked with a cinema ticket when the questionnaire was received at VTI. One note for remembering was sent to the drivers before the specified number of 20 of each kind was reached.
Once all the nations had reached the specified number of participants all respective nations entered their questionnaire data into an electronic sheet (excel file) and sent it to UNIMORE in Italy and VTI in Sweden. Data files were iterated a number of times due to the problems discussed above and quite a few hours were used to create a database that could make all the data comparable.
The complete excel file was imported into SPSS (Version 17.0) for statistical analysis. When statistical testing was computed the level of significance was chosen to 0.05 for all tests. Trends will be presented as well, i.e. effect between 0.10 and 0.05 will be interpreted as trends.
1.3
Analysis
The categorised answers given by truck and bus drivers were entered into a data sheet prepared in SPSS (version 17.0).
However, before the results are presented, a discussion of the analysis is needed to: understanding data received
understanding why the analyses computed were chosen in the first place
The answers to the questionnaire were organised in the data sheet with all the background data at the beginning. The number of drivers that completed the questionnaire was 256. The background data can therefore be used to divide the participants into a huge number of different categories.
The objective of the questionnaire was to investigate truck and bus drivers’ degree of regulation knowledge among drivers that work abroad. With this purpose in mind, and with the objective of design and develop in Task 3.3; a Smart Information System (called LISA) to provide drivers a useful support on road rules and regulations, help them to overcome possible difficulties and improve and promote safe driving behaviours – the answers in the questionnaire have been formulated.
Thus, the purpose of the questionnaire is:
to investigate regulation knowledge among truck and bus drivers
to provide inputs to the development of a regulation of knowledge support system It is therefore not of primary interest to compare nationality of the driver or in which country the questionnaire was completed. More interesting is the separation of profession. The information needed by truck drivers might differ from the information needed by the bus drivers. Secondly, the experience with technical support systems and devices might be valuable in order to understand the functionalities needed in a user-friendly system.
The analysis performed compares bus drivers with truck drivers: it also compares more experienced truck drivers with less experienced truck drivers. The same is done for bus drivers. Hence, the idea is to create a 2 by 2 design (factorial between participant designs) and study the answers given by the drivers in the questionnaire from that perspective.
1.4
Elaborated results
1.4.1
Background aspects
Firstly, in order to understand the data participant characteristics are evaluated. Table 1 presents descriptive information from the 256 participants who answered the questionnaire. However, the sum of responses to each question is always below 256 since not all participants answered all questions.
Table 6 uses profession as a separation value for the 256 participants. The table reveals that bus driver characteristics and truck driver characteristics are similar. The participant groups chosen are a) comparably old, b) have had their driving licence for approximately equal duration c) been working the same amount of years as drivers. Hence, in that sense the comparison of bus drivers and truck drivers works well.
Table 6 Provide descriptive information about truck and bus drivers background.
vehicle type
driven (numeric) N Mean Std. Deviation Std. Error Mean
driver's age bus 108 43,41 9,826 0,945
truck 101 43,41 11,312 1,126
driver's licence - year bus 127 1986,58 9,638 0,855
truck 115 1987,41 11,845 1,105
age of driver's licence bus 110 22,16 9,885 0,943
truck 115 21,59 11,845 1,105
years at work bus 132 19,08 10,298 0,896
truck 115 19,78 11,001 1,026
Furthermore, only 3 females answered the questionnaire and results will therefore not be discussed from a gender perspective since the female participants are too few.
These data in Table 6 further suggest that experience at work is approximately the same for both groups (truck and bus drivers). This indicates that we might be able to use the same cut off thresholds for both groups (truck and bus drivers) concerning experience at work.
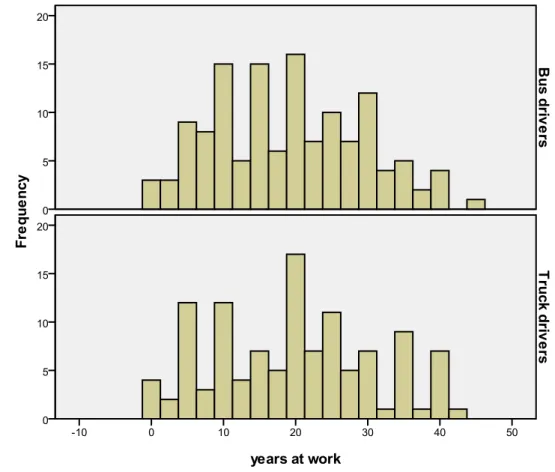
The question is if drivers should be categorised into two of three groups (for practical reasons) concerning experience at work. It is therefore interesting to study the distribution, see Figure 7. . It will provide the information needed in terms of number of groups.
Figure 7. The histogram show how the number of years at work are distributed for truck and bus drivers.
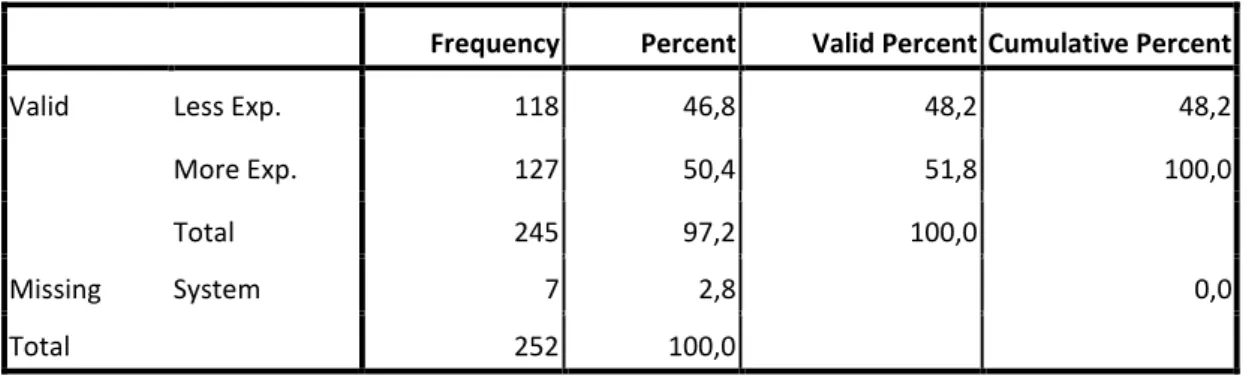
The categorisation into two groups seems to work well. The distribution does not reveal a skewed or problematic pattern. However, since the categorisation into two groups is arbitrary it is recommended to not to overemphasise results as an effect of years at work. The cut off point chosen at twenty years reveal a categorisation with two groups approximately the same number of participants. Table 7 shows how many bus and truck drivers respectively that would be categorised as More experienced versus Less experienced.
Table 7. Reveal how the frequency distribution turns out with a cut off with 20 years.
Frequency Percent Valid Percent Cumulative Percent
Valid Less Exp. 118 46,8 48,2 48,2
More Exp. 127 50,4 51,8 100,0
Total 245 97,2 100,0
Missing System 7 2,8 0,0
Total 252 100,0
The presented results reveal that the categorisation of the participants into four separate groups is possible. It is not perfect in any respect but it is rather fair and useful in order to succeed with the two-fold purpose described earlier, i.e. the purpose with the
questionnaire is two-fold, a) investigate regulation knowledge among truck and bus drivers and b) give input to the development of a regulation of knowledge support system.
Based on the fact that bus drivers and truck drivers’ tasks are different, they might need different support in terms of regulation knowledge. Based on an understanding that experience is related to regulation knowledge – Less experienced might need different support than More experienced. Thus, the following result section will use the categorisation of a 2 by 2 design. This means that the answers in the questionnaire will be analysed from a factorial 2 by 2 between-participant design. Each analysis will reveal if there is a difference between:
bus drivers versus truck drivers;
More experienced versus Less experienced;
and if there is an interaction of driver (bus/truck) versus experience (More/Less). Before analyses results, additional background data will be presented.
Table 8 shows the number of drivers from countries with more than 1 participant. A few come from other countries but are excluded in this presentation because they represent exceptions.
Table 8. Show how many drivers (bus and truck) came from different nations.
Vehicle driven Finland Hungary Italy Romania Sweden
Bus 15 71 12 20 16
Truck 24 19 14 28 23
Bus and Truck 3 0 1 0 1
Total 42 90 27 48 40
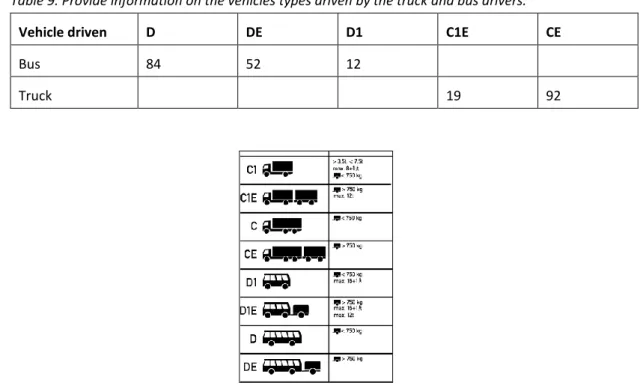
Another background information is the type of vehicle driven. The bus drivers drove different kinds of busses and the truck drivers also drove different kinds of trucks. Table 9 and Figure 8 provides information on which kinds of vehicles the participants drove.
Table 9. Provide information on the vehicles types driven by the truck and bus drivers.
Vehicle driven D DE D1 C1E CE
Bus 84 52 12
Truck 19 92
Figure 8. Information on the vehicle types that the drivers had to choose from.
These data, i.e., type of vehicle driven, could be interesting if we find differences between bus drivers and truck drivers (or More or Less experienced) in further analyses. The
analysis will however not include vehicle type driven in the 2 by 2 design discussed earlier (experienced versus Less experienced and bus versus truck driver).
The questionnaire also asked in which countries drivers mainly transport goods or passengers. Table 10 shows that:
truck drivers and bus drivers travel to the same number of countries; More experienced, to some extent, travel to a larger number of countries.
Table 10. Reveals the distribution for truck and bus drivers and More and Less experienced drivers in terms of countries they transport goods or passengers to.
bus truck
Total 1,00 2,00
Less Exp. Nations DEU 7 7 14
ESP 0 1 1 EST 2 0 2 FIN 2 3 5 HUN 33 8 41 ITA 5 14 19 NLD 0 1 1 NOR 0 1 1 ROU 16 17 33 SWE 0 1 1 Total 65 53 118
More Exp. Nations CZE 1 0 1
DEU 9 17 26 DNK 2 0 2 ESP 0 4 4 EST 1 0 1 FIN 5 8 13 HUN 37 11 48 IRL 1 0 1 ITA 2 6 8 NLD 0 8 8
NOR 0 3 3 ROU 4 5 9 RUS 1 0 1 SWE 1 0 1 SWE, NOR 1 0 1 Total 65 62 127
The next question asked if the participants had a routine destination. Table 11 reveals that experienced bus drivers more often have a routine destination than the Less experienced and that the vice versa is true for truck drivers.
Table 11. Shows how many of the participants that have a routine destination.
Bus Truck
Total 1,00 2,00
Less Exp. Regular route
N 32 27 59
Y 32 24 56
Total 64 51 115
More Exp. Regular route
N 25 35 60
Y 38 27 65
Total 63 62 125
Thereafter, it was analysed if the time to complete transportation to a routine destination varied. The 2 by 2 ANOVA revealed that no significant effects were obtained. Neither for: time it took to complete the trip;
Figure 9. Shows how many hours transportation to a routine destination takes for the 4 groups of interest.
Table 12. Reveals how many times per month the participants go to their routine destination.
Experience Bus / truck Mean Std. Deviation N
Less Bus 7,21 8,828 39 Truck 9,82 8,387 22 Total 8,15 8,693 61 More Bus 5,51 5,548 45 Truck 7,24 6,969 17 Total 5,99 5,962 62 Total Bus 6,30 7,261 84 Truck 8,69 7,811 39 Total 7,06 7,491 123
These questions were followed up by another question concerning other destinations different from the routine. The analysis revealed that half of our participants also had other destinations apart from their routine destination.
Table 13. Shows how many of the participants had other destinations than their routine destination.
Experience
Bus Truck
Total 1,00 2,00
Less Exp. Other routes 2 5 7
N 13 17 30
Y 50 31 81
Total 65 53 118
More Exp. Other routes 3 2 5
N 5 11 16
Y 57 49 106
Total 65 62 127
These data show that all four groups go to a number of destinations even though half of them have a routine destination. That suggests that the participants go to a number of countries.
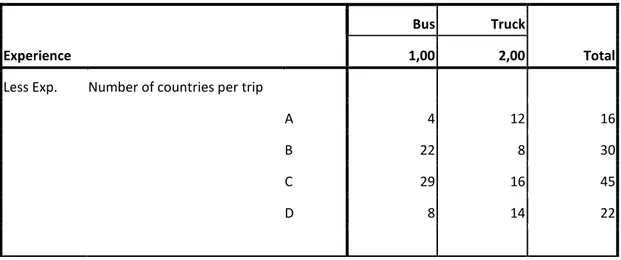
The next question in the questionnaire focused on that aspect. Table 14 shows how frequent different alternatives were concerning passing through other countries (A = 1, B = 2-4, C = more than 5, and finally D = None).
Table 14. Shows how many countries our participants usually pass through during their trips (including starting destination).
Experience
Bus Truck
Total 1,00 2,00
Less Exp. Number of countries per trip
A 4 12 16
B 22 8 30
C 29 16 45
More Exp. Number of countries per trip
A 7 11 18
B 19 7 26
C 25 26 51
D 10 18 28
Table 14 reveals that most of our participants pass trough more than 5 countries (alternative C in the questionnaire). The second most frequent alternative is B which means that they pass 2-4 countries during a trip. The conclusion is that participants go through a number of countries regularly even if they have a routine destination.
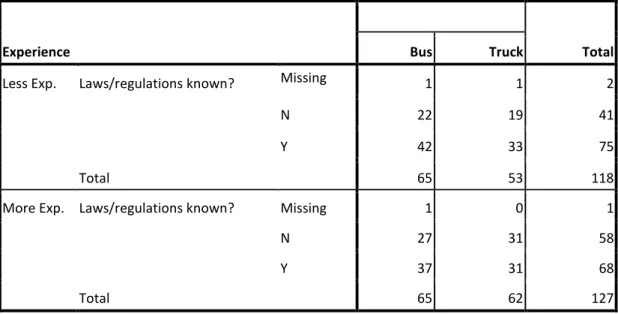
The question is then if they feel that they understand traffic regulations in each respective country. Table 15 shows how the four groups answer that question with a Yes or No.
Table 15. Show how More or Less experienced drivers believe they know traffic regulations in different countries.
Experience Bus Truck Total
Less Exp. Laws/regulations known? Missing 1 1 2
N 22 19 41
Y 42 33 75
Total 65 53 118
More Exp. Laws/regulations known? Missing 1 0 1
N 27 31 58
Y 37 31 68
Total 65 62 127
The answers suggest that approximately 40% of our participants believe that they do not
know the traffic regulations in countries they regularly pass through during transportation of goods and passengers.
In which countries do they find it harder than in others? The only country that the participants had written down more than 3 times was France. However, a great number of countries were mentioned and France was not that frequent either.
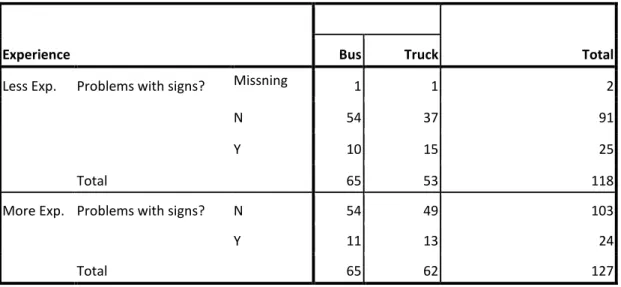
Approximately 20% of the participants state that they encounter problems with
understanding foreign road signs (Table 16).
Table 16. Reveals how many participants find it hard to understand foreign road signs.
Experience Bus Truck Total
Less Exp. Problems with signs? Missning 1 1 2
N 54 37 91
Y 10 15 25
Total 65 53 118
More Exp. Problems with signs? N 54 49 103
Y 11 13 24
Total 65 62 127
No country is pointed out in this respect since the participants spread their comments on a great number of countries (over 15 countries were mentioned).
Conclusions on BACKGROUND information
The results on the background section reveal that the chosen aspects of interest, i.e. a)
type of driver and b) degree of experience are possible to define in the chosen way. It is
not the only way to characterise the participants in this study, but given the purpose presented above it is suggested that it will fill its purpose.
The results also suggest that traffic regulation knowledge is an aspect that seems to be necessary to support the drivers with. For instance, as many as 40 % believed that they
had problems with traffic regulations and in the same time passed through a number of countries during their trips to different destinations. And approximately 20% of the participants state that they encounter problems with understanding foreign road signs.
Most of the participants also quite often transported goods or passengers to other
destination than their routine destination. Only 50 % had a routine destination.
Taken together, these results point into the direction of a need of support with traffic regulation.
The question about understanding foreign road signs was ending the background part of the questionnaire. The next section will continue with an area called personal opinion.
1.4.2
Personal opinions
The first question was concerned with how drivers would prioritise (1 = very important and 5 = not important) between 4 important objectives for heavy vehicle transports, namely: A) delivery time;
B) driver comfort (for truck drivers) or passengers comfort (for bus drivers); C) driver safety (for truck drivers) or passenger safety (for bus drivers); D) to follow laws and regulations.
Alternatives were treated as a within-participant variable. This analysis was a 2 x 2 x 4 split plot ANOVA. Driver by Experience by Alternative was the design analysed.
The analyses reveal a tendency for a main effect and two significant interactions.
The main effect (F(3, 114)=2.40, p=0.07, MSe=1.06) show that, overall, alternative A
(delivery time) is less important compared to the other 3 alternatives given.
The first significant interaction (F(3, 114)=16.59, p<0.05, MSe= 1.06), is presented in Figure 10 and shows that:
truck drivers prioritise delivery time to a higher degree than bus drivers;
bus drivers prioritise passenger comfort and safety to a higher degree (the pair wise comparisons was Bonferonni [2] adjusted and significant).
The other two comparisons were not significant (p>0.05). The results are obviously affected by the difference between truck and bus drivers’ alternative B.
Figure 10 . Shows the interaction between Driver and Alternatives (1: very important; 5: not important).
The second interaction effect (F(3, 114)=4.83, p<0.05, MSe= 1.06
)
, Alternative by Experience presented an interaction and where two simple effects again were significant with Bonferonni correction for multiple t-tests. See Figure 11. The first simple main effect reveals that: More experienced drivers (overall, bus and truck drivers) think that delivery time is less important compared to Less experienced drivers;
Less experienced drivers (bus and truck) think that to follow laws and regulation is less important than More experienced drivers.
The other two comparisons are not significant.
Figure 11. Shows the interaction between Alternatives and Experience.
This interaction effect makes it clear that More experienced drivers compared to Less experienced drivers, prioritise the different alternatives given, in a different way. We do not have the same problem with this interaction effect concerning different perspectives on alternative B, indicating that degree of experience is important.
The questionnaire continued with a question on collecting information about their routes, and specifically when and where the drivers collect information.
The question had to be answered via a matrix which provided 65 answer alternatives. Participants answered the question 65 times (in a matrix, see ANNEX B). However they only marked in the questionnaire the cells with a 1 if it was applicable. The when information was collected and divided into 3 alternatives:
a) before the trip; b) during the trip; c) after the trip.
Each one of the 3 alternatives was divided into five circumstances. The five circumstances were varied as follows:
1. vehicle restrictions; 2. time periods restrictions; 3. weather forecast;
4. traffic conditions and congestions; 5. obligations of snow chains or winter tires.
The 3 alternative times 5 circumstances leave the participant with 15 cells to answer. Each one of the cells produces one table.
Table 17 is an example of the 15 tables analysed which are included in ANNEX B.
Table 17. Shows how many of the participants collect information Before the trip concerning Vehicle restrictions.
Experienced Bus Truck Total
Less Exp. No 14 18 32 Yes 51 35 86 Total 65 53 118 More Exp. No 14 20 34 Yes 51 42 93 Total 65 62 127
Table 17 reveals that 73 % of the drivers collect information about vehicle restrictions (1.)
before the trip. Both bus and truck drivers do that to the same extent. Both Less, as well
The four other tables (see ANNEX B) on when information before the trip is here summarised in words.
2. Concerning time periods restrictions the data pattern shows that Less experienced (80%) collect data beforehand. The More experienced on the other hand do not to the same extent collect data beforehand (50%). No differences were found between types of drivers.
3. Concerning weather forecast restrictions the data pattern shows that Less experienced (50%) collect data beforehand. The More experienced on the other hand do not to the same extent collect data beforehand (61% do not collect) and especially truck driver do not collect data beforehand (76%).
4. Concerning traffic conditions and congestions the data pattern shows that both experienced categorises and drivers of both kinds behave in the same way. Approximately 26 % collect data beforehand.
5. Concerning obligations of snow chains or winter tires the data pattern shows that both experienced categorises and drivers of both kinds behave in the same way. Approximately 71 % collect data beforehand.
The same five tables were analysed for during the trip compared to before the trip as above.
1. Concerning vehicle restrictions the data pattern shows that both experienced categorises and drivers of both kinds behave in the same way. Approximately 24 collect data during their trip.
2. Concerning time periods restrictions the data pattern shows that both experienced categorises and drivers of both kinds behave in the same way. Approximately 32 % collect data during their trip.
3. Concerning weather forecast the data pattern shows that both experienced categorises and drivers of both kinds behave in the same way. Approximately 48 % collect data during their trip.
4. Concerning traffic condition and congestions the data pattern shows that both experienced categorises and drivers of both kinds behave in the same way. However, as many as 68 % of the participants collect data during their trip.
5. Concerning obligations of snow chain and winter tyre the data pattern shows that both experienced categorises and drivers of both kinds behave in the same way. Approximately 21 % collect data during their trip.
The same five tables were analysed for after the trip compared to before and during the trip as above.
The five tables (see ANNEX B) that provide information about when information and ask if the driver collect information after the trip.
The results point clearly in the same direction for all 5 tables. Extremely few collect any
kind of data after a trip.
Summary of when information: The 15 tables reveal that information is mostly collected
before the trip, if necessary. However, a surprisingly large extent of information is collected during the trip as well. Bus drivers and truck drivers seem to collect the same kind of information even if exceptions exist. Less experienced and More experienced seem also to collect the same kind of data most often. However, some differences exist between the two groups of experience.
The where information was collected and divided into eight alternatives: traffic signs; colleagues; radio; television; websites; navigator; newspaper; others.
Each one of the alternatives was cross tabulated with the same five circumstances as for
when questions, i.e., vehicle restrictions, time periods restrictions, weather forecast, traffic
conditions and congestions, and obligations of snow chains or winter tires. The 8 alternative times 5 circumstances leave the participant with 40 cells to answer, i.e. 40 tables to interpret. The interpretation of the 5 tables concerning traffic signs is presented first.
1. Concerning vehicle restrictions the data pattern shows that Less experienced drivers (68%) collect information more often than More experienced drivers do (47%) from traffic signs.
2. Concerning time period restrictions the data pattern shows that both experienced categorises and drivers of both kinds behave in the same way. Approximately 32 % collect from traffic signs.
3. Concerning weather forecast the data pattern shows that both experienced categorises and drivers of both kinds behave in the same way. But only 4 % collect from traffic signs.
4. Concerning traffic conditions and congestions the data pattern shows that both experienced categorises and drivers of both kinds behave in the same way except for the Less experienced bus drivers. Thus, 50 % of the Less experienced bus drivers collect information on traffic signs whereas 20 % of the other three categorise collect information concerning weather forecast.
5. Concerning obligations of snow chains and winter tires the data pattern shows that Less experienced drivers (63%) collect data through traffic signs more often than More experienced drivers (33%).
The interpretation of the 5 tables concerning colleagues is presented next. Table 1-5 is presented in detail in the ANNEX B. Approximately the same pattern is obtained for these 5 tables. The data pattern shows that both experienced categorises and drivers of both kinds behave in the same way.
Vehicle restrictions - approximately 33 % collect from colleagues. Time period restrictions - approximately 31 % collect from colleagues. Weather forecast - approximately 18 % collect from colleagues.
Traffic conditions and congestions - approximately 34 % collect from colleagues. Obligation of snow chains and winter tires - approximately 26 % collect from
colleagues.
The interpretation of the 5 tables concerning radio is presented next. The five tables reveal that 4 of them are similar and that weather forecast is not similar. Meaning that the data pattern shows that both experienced categorise and drivers of both kinds behave in the same way.
Vehicle restrictions - approximately 18 % collect from radio. Time period restrictions - approximately 16 % collect from radio.
Traffic conditions and congestions- approximately 57 % collect from radio.
Weather forecast - approximately 47 % collect from the radio of the Less experienced. The More experienced bus drivers collect from the radio in 45% of the cases. However the More experienced truck drivers collect from the radio in 65% of the cases.
The interpretation of the 5 tables concerning TV is presented next.
The only information collected by TV is the weather forecast information (25%). Otherwise TV is not used as an information source at all.
The interpretation of the 5 tables concerning websites is presented next.
The websites are not used very much. But they are used more than the TV, i.e., approximately between 12-22 % for 4 out of 5 circumstances. The only time websites are used more is when drivers need weather information (30%).
The interpretation of the 5 tables concerning navigators is presented next.
The navigators are not used much. The percentage that us navigators is between 4 – 17 % and More experienced driver use navigator as often or more than Less experienced.
The interpretation of the 5 tables concerning newspaper is presented next. The newspaper is not used much (between 2-7%).
Finally, the interpretation of the 5 tables concerning other sources is presented next. “Other sources” (see questionnaire) are not used much (15-23%). As above, there are no differences between types of drivers or different experience groups.
Summary of where information: The most used sources for information collection were
radio, colleagues, and traffic signs. No big differences between type of driver or different experience groups were found. The TV and websites can be used to collect weather information. The navigator and the newspaper are rarely used.
The When and Where composite question was followed by the question regarding GPS
navigation systems, and specifically if drivers use navigation systems or not. Table 18
shows that most of the drivers have a GPS navigation system (73%).
Table 18. Reveals how many of the participant claim that they have a GPS navigation system in their vehicle.
Experienced Bus Truck Total
Less Navigation system in vehicle N 11 17 28
Y 54 36 90
Total 65 53 118
Navigation system in vehicle N 19 17 36
Y 45 44 89
Total 65 62 127
The data pattern in Table 18 also shows that both experienced categories and both driver types behave in the same way.
The GPS question was followed by the warning system question. Drivers were asked what kind of warning system they have installed in their truck or bus. This question was divided into 3 different questions in a matrix. The 3 questions were:
a) What do you have?
b) What do you prefer? (among installed) c) Which you would like to have?
The same analysis as above was performed for 6 different warning systems. Systems chosen were:
speed alert;
information about driving time; obstacle and collision warning; blind spot monitoring;
lane departure warning;
1. Concerning speed alert: participants do have speed alert warning systems installed (70%). Only 20 % like the system and only 9 % would like to have them installed. No significant differences between type of driver or different experience groups were found.
2. Concerning information about driving time: participants do have information about driving time systems installed (60%). Only 19 % like the system and 19 % would like to have them installed. No real differences between type of driver or different experience groups were found.
3. Concerning obstacle and collision warning: participants do not have obstacle and collision warning systems installed (8% have it). Only 12 % like the system but as many as 41 % would like to have this system installed. No real differences between type of driver or different experience groups were found.
4. Concerning blind spot monitoring: participants do not have blind spot monitoring systems installed (15% have it). Only 14 % like the system but as many as 44 % would like to have this system installed. No real differences between type of driver or different experience groups were found.
5. Concerning lane departure warning: participants do not have lane departure warning systems installed (7% have it). Only 13 % like the system but as many as 37 % would like to have this system installed. No real differences between type of driver or different experience groups were found.
6. Concerning real-time traffic information (RTTI): participants do not have real-time traffic information systems installed (20% have it). Only 19 % like the system but as many as 45 % would like to have this system installed. No real differences between type of driver or different experience groups were found.
Summary of warning systems information: There was no difference in opinions concerning
warning systems between type of driver or different experience groups. The different systems were, however, rated differently. Two of the systems were installed in a major part of the vehicles (Speed alert and Information about driving time) and four were not. However, a rather large number of drivers would like to have the presented systems installed in their vehicles.
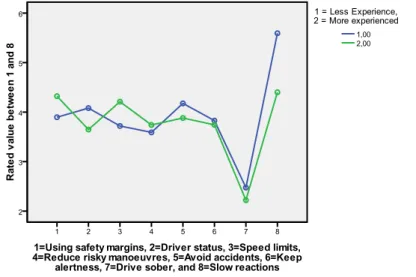
The next question in the questionnaire concerned the most important factors regarding
safety. 8 alternatives were given and the participants had to rank from 1 to 8 how
important each factor was for traffic safety. The ANOVA computed was a 2 by 2 by 8 factorial analysis of variance (a split plot analysis). As before, degree of experience and
type of driver were the two between-participants variables used, and the 8 alternatives given were a within-participant variable.
The factor safety variables were: using safety margins;
driver status (psychological status, comfort, stress, etc); speed limits;
reduce risky manoeuvres; avoid accidents;
keep alertness; drive sober; slow reactions.
First, a significant main effect of type of driver (F(1, 222 )= 17.02, p<0.05, MSe = 2.59) was found. This effect is only due to the fact that more truck drivers completed the rating. It was an interesting main effect of safety factor (F(7, 1554) = 24.21, p<0.05, MSe = 4.89). This effect show that two of the safety factors were rated differently compared to the other 6. Drive sober was significantly rated as more important than all of the others and
slow reaction was significantly rated as less important from a traffic safety perspective. As
presented in Figure 12 and Figure 13 two two-way interactions were significant. The experience by safety factor (F(7, 1554) = 3.01, p<0.05, MSe = 4.89) and driver by safety factor (F(7, 1554) = 3.08, p<0.05, MSe = 4.89).
The interaction shows that More experienced drivers think that slow reactions are more important than Less experienced drivers do. No one of the other safety factors was affected by experience, i.e., Less and More experienced drivers agree on all Safety Factors except for Factor 8 (Slow reactions).
Figure 13. Reveals the interaction effect between Type of Driver and Safety Factor.
Figure 13 reveals that truck drivers and bus drivers agree on two safety factors and disagree on six. Drive sober and keep alertness was rated equally by the two driver types. The other six were significantly different, i.e., statistical simple main effects exist. Truck drivers found these six factors less important for safety compared to bus drivers.
Next question in the questionnaire focused also on safety, but more on adverse
conditions:
1. bad weather condition like rain, snow, ice, wind, etc.; 2. tired or drunk driver;
3. vehicle condition like old, used tires, broken lights, etc.; 4. poor road maintenance condition;
5. heavy traffic;
6. poor light and visibility.
Participants had to, in the same way, as above, rate how dangerous each one of the six alternatives was. The higher the value, the more dangerous it was. The ANOVA computed was a 2 by 2 by 6 analysis of variance (a split plot). As before, degree of experience and
type of driver was the two between-participants variables used, and the six alternatives (dangerous) given was the within-participant variable.
Figure 14. Reveals how different Dangerous factors were rated by all participants.
The significant main effect (F(5, 1180)=17.01, p<0.05, MSe=2.74) reveals that different dangerous factors are experienced to vary to a high degree. The dangerous factor 1 and 5 are less dangerous compared to factor 3, 4 and 6, and finally, the most dangerous is 2 (tired or drunk driver). The 2 by 2 by 6 ANOVA did not reveal any effect on type of driver. However the interaction experienced by dangerous factor was significant and presented below (F(5, 1180)=4.24, p<0.05, MSe=2.74).
Figure 15. Shows how Less compared to More experienced drivers rated significantly different on two dangerous factors.
To be tired or drunk, and poor road maintenance were rated as less dangerous by the More experienced drivers compared to the Less experienced.
The last question concerned drivers’ personal opinions about road signing in general. The analysis revealed that bus drivers and More experienced truck drivers thought it was room for improvement in approximately 47 % of the cases. Of the Less experienced truck drivers, on the other hand, approximately only 24 % believed that there was room for improvement.
Table 19. Reveals how the participants thought about road signs in general.
Driver
Experience
Total Less More
Bus Opinion about road signs Clear and complete 32 29 61 Room for improvement 26 29 55
Total 58 58 116
Truck Opinion about road signs Clear and complete 37 34 71 Room for improvement 12 27 39
The section on personal opinions ended with that question and the last section will be analysed below.
1.4.3
Regulation knowledge
The first question concerns drivers’ knowledge about speed limits in main country (the country that they had indicated as their main country initially in the questionnaire). The question asked about urban roads, main roads and motorways.
Almost all participants (93%), independent of the indicated main country, believed that the speed limit was 50 km/h on urban roads, with no differences between truck drivers and bus drivers.
However, opinions varied to a lager degree when main roads were concerned. Table 20 present the distribution of answers for main roads.
Table 20. Presents how the participants vary on the speed limit question, on main roads in their main countries.
Driver
Experience
Total Less More
Bus Speed limit on main roads 70 23 28 51
80 36 26 62
90 2 6 8
100 2 1 3
Total 63 61 124
Truck Speed limit on main roads 60 2 7 9
70 35 20 55
80 11 32 43
90 3 1 4
Total 51 60 111
The second question was the same but focused on their second country, i.e., the country that they drove mostly in besides their main country. The data pattern obtained for the main country was exactly the same as for their second most frequent country, i.e., no data is presented fort this specific follow up question.
The third question concerned daylight running lights. The questioned focused on the drivers’ main country. Table 21 reveals how the participants responded.
Table 21. Shows how participants respond to the question on light usage.
Driver
Experience
Total Less More
Bus Daylight running lights N 3 6 9
Y 62 57 119
Total 65 63 128
Truck Daylight running lights N 3 7 10
Y 48 54 102
Total 51 61 112
Almost all of our participant use their beam light during daylight.
The fourth question focused on driving hours per day permitted in their targeted main countries. Table 22 presents how the participants answered the question on permitted working hours per day. The alternatives were A=7 hours, B=8 hours, C=9 hours, and D=10 hours.
Table 22. Presents the distribution of participants concerning working hours per day.
Driver
Experience
Total Less More
Bus Max number of working hours
per day A 2 2 4 B 1 0 1 C 54 46 100 D 7 10 17 Other 0 3 3 Total 64 61 125
Truck Max number of working hours per day
A 1 0 1