Faculty of Natural Resources and Agricultural Sciences
Fish community responses to water colour
– Results along a large gradient from clear to
brown lakes in Sweden
Fisksamhällens respons på vattenfärg
– Resultat längs en stor
gradient från klara till bruna sjöar i Sverige
Stephanie Christine Koch
Master's thesis (självständigt arbete)
• 30 credits
EnvEuro Environmental Science - Soil, Water and Biodiversity Uppsala 2019
Fish community responses to water colour
– Results along a
large gradient from clear to brown lakes in Sweden
Fisksamhällens respons på vattenfärg – Resultat längs en stor gradient från klara till bruna sjöar i Sverige
Stephanie Christine Koch
Supervisor: Magnus Huss, Swedish University of Agricultural Sciences, Department of Aquatic Resources
Assistant supervisor: Renee van Dorst, Swedish University of Agricultural Sciences, Department of Aquatic Resources
Assistant supervisor: Stefan Schmutz, University of Natural Resources and Life Sciences, Vienna, Department of Water, Atmosphere and Environment
Examiner: Kerstin Holmgren, Swedish University of Agricultural Sciences, Department of Aquatic Resources
Credits: 30 credits
Level: Second cycle, A2E
Course title: Master thesis in Environmental science
Course code: EX0897
Programme/education: EnvEuro Environmental Science - Soil, Water and Biodiversity
Course coordinating department: Department of Aquatic Resources
Place of publication: Uppsala
Year of publication: 2019
Cover picture: Stephanie Koch
Online publication: https://stud.epsilon.slu.se
Keywords: water browning, climate change, dissolved organic carbon, fish community, community composition, fish biomass
Swedish University of Agricultural Sciences
Faculty of Natural Resources and Agricultural Sciences Department of Aquatic Resources
1 An increa se of dissolved orga nic ca rbon a nd iron in freshwa ter bodies a cross the Northern Hemisphere ca used by environmenta l a nd la nd use cha nges lea d to wa ter browning with nega tive impa cts on la ke ecosystems. Effects of browning on a qua tic ecosystems a re c o m -plex a nd include reduced light penetra tion, therma l stra tifica tion, lower ma crophyte cover, lower prima ry productivity, a nd potentia l shifts in species composition. However, little is known a bout impa cts of browning on la ke fish communities. In this study I a na lysed da ta from 146 la kes in Sweden a long a la rge wa ter colour gra dient (mea sured a s a bsorba nce a t 420 nm) to find out how fish community bioma ss is influenced by wa ter colour. Further-more, I studied if va ria tions in species composition or mea n body size contribute to differ-ences in community fish bioma ss between clea r a nd brown la kes. Therefore, I tested the rela tionship between a bsorba nce a nd community bioma ss, species bioma ss, tota l a bun-da nce of fish individua ls, mea n fish body length, size diversity a nd species richness a nd the rela tionship between community composition a nd a bsorba nce. The ma in result of my study wa s a nega tive rela tionship between fish community bioma ss a nd wa ter colour, mea ning a lower fish bioma ss in brown la kes tha n in clea r la kes. The lower community bioma ss is likely expla ined by a lower bioma ss of severa l of the most common fish spe-cies, a lower tota l a bunda nce of fish in da rk la kes, a nd a lower number of species a nd dif-ferences in fish community composition. In contra st, I found no rela tionship between a b-sorba nce a nd fish body length, demonstra ting tha t a lower bioma ss in brown la kes wa s n o t due to sma ller fish. I a lso found tha t the va ria tion in tota l fish a bun da nce a nd bioma ss wa s high for clea r la kes, but low for da rk la kes. Also, va lues for highest bioma ss, highest num-ber of individua ls a nd numnum-ber of species were much lower in da rker la kes tha n in clea r ones, expla ining the lower community bioma ss with increa sed a bsorba nce. Ba sed on my results a nd considering tha t resource use a nd production a re lower in da rk la kes, I suggest a limita tion of fish community bioma ss in brown la kes due to low resource a va ila bility. My study provides novel insights into fish community responses to a bsorba nce, but a lso identifies further resea rch needed in fa ce of ongoing clima te cha nge a nd a nticipa ted further wa ter browning.
Keywords: wa ter browning, clima te cha nge, dissolved orga nic ca rbon, fish community, community composition, fish bioma ss
3
1 Introduction 4
2 Material and Methods 9
2.1 Lake selection 9
2.2 Lake fish and abiotic data 10
2.3 Data Analysis 11
3 Results 14
3.1 Community biomass 18
3.2 Species specific biomass 18
3.3 Community abundance 19
3.4 Community mean length and length diversity 20 3.5 Species richness and community composition 21
4 Discussion 24 5 Conclusion 29 References 30 Acknowledgements 37 Popular summary 38 Appendix 39
Table of contents
4
Global climate change has huge impacts on the earth’s ecosystems, and water bod-ies are especially affected (Woodward et al. 2010; Okorafor 2014). Climate change imposes multiple stressors on aquatic systems, like changes in temperature and precipitation, but also an increase in the magnitude and frequency of ex treme weather events (IPCC 2014; Wrona et al. 2006). Aquatic systems are also stressed by other anthropogenic impacts, such as pollution, drainage, (habitat) alterations of water bodies, fisheries, recreational activities, or agriculture (Woodward et al. 2010; Wrona et al. 2006). Moreover, many species living in th ese sy stem s h ave limited abilities to migrate in reaction to these changes (Wrona et al. 2006; Woodward et al. 2010; Poff et al. 2002), which is why they are specially affected by such stressors. One major implication of ongoing climate change and anthropo-genic activities like changes in land use is browning of waters, which is especially pronounced in northern latitude water bodies (Karlsson et al. 2009; Monteith et al. 2007; Kritzberg and Ekström 2012).
Browning (also referred to as brownification, e.g. Monteith et al. 2007; Kritzberg and Ekström 2012; Finstad et al. 2014; Creed et al. 2018), is the shift in the optical properties of water towards a brown colour (Creed et al. 2 0 18). Th is p ro cess is caused by increased concentrations of terrestrially derived dissolved organ ic car-bon (DOC) and iron (Fe) (Kritzberg and Ekström 2012; Björnerås et al. 2017; Weyhenmeyer et al. 2014) in the water. Both rising DOC and Fe co ncen tratio ns can be attributed to land-use changes (e.g. expansion of forestry, Björnerås et al. 2017; Kritzberg 2017), increasing terrestrial productivity in northern region s, an d prolonged vegetation growing seasons (Finstad et al. 2016; Xu et al. 20 13) . Co u-pled with more heavy rainfall events (IPCC 2014), these changes alter hyd rologi-cal processes and consequently the transport of organic carbon s f rom so ils in to water bodies (Jansson et al. 2000; Larsen et al. 2011; Creed et al. 2018), leading to browner rivers and lakes (Williamson et al. 2015). Another cause of b ro wnin g is the recovery from anthropogenic acidification, as the solubility of organic matter increases with decreasing acid deposition (Monteith et al. 2007; Wit et al. 2 0 0 7) . Thus, the causes for browning are manifold.
Browning has complex and interacting effects on aquatic ecosystems (Solomon et al. 2015). Higher levels of DOC (and therefore browner waters) lead to changes in optical properties and reduced (UV) light penetration, thereby shifting the relativ e
5
availability of different habitats due to alteration of thermal niche size, increasing anoxic hypolimnetic zones and less light reaching water bottoms (Magn uson an d Destasio 2008; Karlsson et al. 2009; Stasko et al. 2012; Craig et al. 2017). Brown-ing of lakes may also increase thermal stratification and surface water temperature (Pilla et al. 2018). As light absorption restricts the photosynthesis of benthic algae and benthic energy mobilization, benthic primary production is negatively related to browning (Ask et al. 2009; Seekell et al. 2018). Pelagic production , h o wever, may profit from the nutrient subsidies from terrestrially derived o rganic m atter, and depending on nutrient and organic carbon availability, pelagic ecosystem productivity may sometimes even increase in brown waters (Jansson 2003; Ask et al. 2009). According to Finstad et al. (2014) an initial DOC increase from low levels can affect fish population biomass positively due to the nutrient in creases, but further increases in DOC lead to declining biomass production as the n u trien t increase cannot compensate for the lack of light. Hence, a hump-shaped respo nse curve, representing the trade-off of higher DOC levels, is suggested (Finstad et al. 2014). Consequently, the decrease in benthic primary production canno t b e co mpensated by increased nutrient levels (Ask et al. 2009). All in all, the ab ove m en -tioned physical, chemical and biological effects caused by browning lead to lower primary and secondary production in lakes and therefo re to lo wer o v erall lak e productivity (Jansson 2003; Karlsson et al. 2009).
It is understood that benthic habitats are key energy pathways for productio n an d biomass of higher trophic levels (Seekell et al. 2018; Karlsson et al. 2009; Bartels et al. 2016). Consequently, decrease of algal primary production and coup led re-duction of zoobenthic prey are considered a key mechan ism b ehind lo wer fish biomass in brown lakes (Benoît et al. 2016; Karlsson et al. 2009). Limited benthic production may not only have a negative impact on fish feeding th rou gh a lo wer availability of benthic invertebrates, but also because of loss of macrophyte cov er (Stasko et al. 2012; Solomon et al. 2015). On the other hand, the respo nse in p e-lagic production to DOC is context-dependent, varying with DOC-to-nutrient load ratio (Kelly et al. 2018), and can be positive or negative (see Jansson 2003; Vasconcelos et al. 2016). Despite the accompanying increases in nutrients in lake water with increases in terrestrial organic carbon, studies showed that lake produc-tivity can be more affected by poor light conditions than by nutrient av ailability (Ask et al. 2009; Karlsson et al. 2015). As benthic primary pro duction is co nse-quently more sensitive to variation in water colour than pelagic production (Ask et al. 2009; Seekell et al. 2018), fish possibly switch to feeding in th e p elagic zon e (Bartels et al. 2016).
Generally, there is accumulating evidence that fish resource use and production is lower in dark humic waters than in clear (Karlsson et al. 2009; Karlsson et al. 2015; Benoît et al. 2016; van Dorst et al. 2019). Despite that, research mainly deals with specific fish species, whereas to my knowledge no studies have focused on fish communities over a large range of lakes so far. However, f ish sp ecies o r individuals react differently to changing physical factors in darker waters, which might either result in adaptation or physiological stress. In addition to a decline in prey availability, deteriorating visual conditions in humic waters impact fish forag-ing (Bartels et al. 2016). It is known that some fish species, like pikeperch (Sander
6
lucioperca) or roach (Rutilus rutilus), are better adapted to impaired ligh t co n
di-tions than others (e.g. perch, Perca fluviatilis) (Ljunggren an d San dström 2 0 07; Estlander et al. 2010). Theoretically, differences between species in the ability to forage in clear and dark water can lead to competitive advantages for some species and thus, to a change in relative abundance of different fish species in response to browning. Similarly, predator-prey interactions may shift in response to brown ing as foraging success of visual predators and prey behaviour can be affected by dete-riorated visibility (Ranåker et al. 2012; Ranåker et al. 2014). Fo r example , p ike foraging behaviour showed a decreasing reaction distance due to reduced o ptical conditions (Ranåker et al. 2012). Due to the fact that piscivore predation is consid-ered a structuring force on fish communities changing piscivore-prey interactio ns in response to visibility conditions play an important role for understanding co m-munity shifts (Ranåker et al. 2012; Ranåker et al. 2014). Besides, d ifferences in diet and feeding strategy may also influence varying species responses t o b ro wn -ing. On one hand, resource availability might be more lim ited f or b enthiv orou s than for planktivorous fish (Bartels et al. 2016), on the other hand decreased v isi-bility appears to affect piscivorous feeding more negatively than benthic f eeding (Estlander et al. 2010; Estlander et al. 2012; Jönsson et al. 2 0 13). However, rsponses differ not only between the different species, but also within species, d e-pending on their size. Specifically, decreasing early growth rates and length-specific growth of fishes were observed in brown lakes, affecting biomass produc-tivity (Benoît et al. 2016; van Dorst et al. 2019). Consequently, browning o f wa-ters can affect fish communities by prey limitation and changes in habitat availa-bility, competition, predator-prey interactions, species distributions, feeding strat-egies, and physiological stress of fishes (Stasko et al. 2012).
7 Figure 1: Potential effects of water browning on lake ecosystems and fish commu nities (adapted from Stasko et al. 2012).
Although shifts in fish communities in response to water browning are anticipated (Stasko et al. 2012; Ranåker et al. 2014), studies on actual community resp onses are to my knowledge not existent yet. Most research has focused on th e respo nse of single fish species (e.g. bluegill (Lepomis macrochirus): Craig et al. 2017; perch: Estlander et al. 2012; van Dorst et al. 2019; Bartels et al. 2 01 6 ). Fu rth er-more, many conclusions about responses to browning are b ased o n small -scale experiments or data obtained at small spatial scales. Yet, Woodward et al. (2 0 10) addressed the need of understanding biological responses to climate change at higher organizational levels (i.e. communities, food webs, eco sy stems). In th is regard, my study using a large data set on fish and environmental variables in th e whole country of Sweden can be beneficial for understanding ecological responses at broad scales.
Here I ask to what degree water colour influences fish community b iomass . Fu r-thermore, I ask to what extent compositional variations or size stru ctu re s within species contribute to differences in fish community biomass b etween clear an d brown lakes. To study these community responses, I analysed data from 146 Swe-dish lakes across a large water colour gradient, ranging from clear to brown lakes. On one hand, my study can be seen as gradient study, showing and analysing o b
-8
served fish community metrics and how existing variation in water colour can explain existing variation in fish community. On the other hand, it can b e in ter-preted as space-for-time approach to get insights in h o w f utu re clim ate change might affect lakes and fish communities. Whereas it can be a great benefit to u se state-of-the-art observations for making predictions on further developm en ts, th e simplified approach of considering only one temporally changing en viron mental factor, namely browning, risks to leave out other potentially imp ortan t env iron-mental predictors.
9
2.1 Lake selection
I conducted my analyses on a subset of lakes distributed across most o f Sweden. These lakes were selected based on available surveillance data on sampling of fish and environmental variables for the years 2000 – 2015, renderin g a to tal o f 1 46 lakes. I extracted fish data from the Swedish national database NORS (Natio nal Register of Survey test-fishing - NORS 2019), which contains d ata fro m su rvey fishing conducted in many lakes in Sweden. Only lakes with f ishing d ata fro m July or August were used for comparability and as these month s are co nsidered part of the main growing season for fish in this region and because environmental data is most often also available for these months. For comparability and avoidin g any influence by different fishing methods, I filtered for fish survey data th at was collected using specific benthic or pelagic gillnets (CEN, 201 5). Fu rtherm ore, I decided to exclude lakes bigger than 500 ha from this study, as lakes with a small surface area (<500 ha) are considered more sensitive to en viro nmental impacts (Stasko et al. 2012), and to ensure comparability between lakes. Other than th at, I removed catch data of rainbow trout due to the fact that it is typically sto cked fo r recreational fishing and cannot reproduce in Sweden. Additionally, th ere were a few cases of bream catches, where they could not identify the sp ecies (i.e. com -mon bream (Abramis brama) or white bream (Abramis bjoerkna)) and therefore I removed these fish from my analysis. Similarly, I removed “carp fishes” from my analysis, as these represented undetermined cyprinids that could not be id entified to species levels.
With the set of lakes extracted and filtered from the NORS database, I then checked for availability of environmental data in the En vironmental database Miljödata MVM (Miljödata MVM 2019). Lake chemistry in form atio n was in -cluded given a minimum of 5 years of data samples for the time period 2000-2015. As a measure of brownness of the water I used filtered abso rbance at 4 2 0 n m. I also extracted information on surface area, mean lake depth, total phosphorus and water temperature. Only samples taken at a depth of 0.5 m were co nsidered, to ensure comparability between lakes. For some lakes, the abiotic samples had been taken at the outflow of the lake, and in these cases, I removed them from th e d ata
10
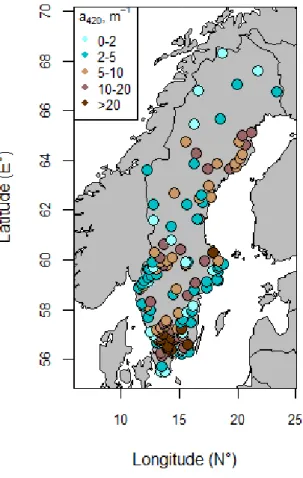
set. After applying all these selection criteria, I ended up with a study d ata set o f 146 Swedish lakes (Fig.2, Table A3).
Figure 2: Location and absorbance of lakes. Data are shown for the 146 lakes analysed in this study. Low absorbance values are in blue and high absorbance values are in brown. Dark brown dots represent lakes with absorbance values ranging from 20 to 66 a420m-1.
2.2 Lake fish and abiotic data
The lakes in my dataset were located across the whole co untry o f Sw eden , an d their surface areas ranged from 4 to 490 ha. Some lakes had test-fishing data f ro m just one year, whereas others have been fished every year from 2000 – 2 015 . Fo r lakes with multiple years of test fishing, mean data over th e y ears was tak en as basis for calculations and analyses. Measures used for my analyses are absorbance at 420 nm, lake area, type of fish net and number of nets used per lake, fish sp e-cies, number of fish, length of individual fish, and weight per species per net. Ac-cording to a standardized test-fishing method (Appelberg et al. 1995), the num ber of benthic gillnets used per lake depend on lake size and maximum depth, and th e number of pelagic gillnets used on maximum lake depth (CEN). Benthic nets, with a net size of 45 m2, were used in all 146 study lakes, whereas pelagic nets, with a
11
net size of 82.5 m2, were only used in 49 lakes as the other lakes were not co nsid -ered deep enough for using them.
Absorbance measures the quantity of light that is absorbed by a sample (IUPAC, 1997). Absorbance at 420 nm (/5cm) is used as a measure of water colo ur (Kirk 1994) with high values indicating a brown colour. Low absorbance valu es o f fil-tered lake water (0.45 m filter) were only given as <0.010, but in order to u se th e values for statistical analysis I set all these values to 0.009. In some cases, multiple data was available per year and in these cases I calculated the mean per year. Con-sequently, I calculated the mean values of all available absorbance measurements per lake for the time period 2000-2015. Thereafter, values were con verted to th e Napierian absorption coefficient a420according to the recommendations o f (Hu et al. 2002):
a420 = (AbsF420nm/5cm * ln(10))/OL (1)
where a420 is the Napierian coefficient, Abs420/5cm the measured absorbance o f filtered water at 420 nm, and OL is the optical path-length (in m).
For simplicity, the Napierian coefficient is referred to as absorbance hereafter. For the 146 study lakes the absorbance varied between 0.5 and 66.6 m- 1, whereo f 1 3 lakes had values above 20. As the focus of the study is o n th e d irect effects o f water colour in means of absorbance, I left out potential interaction s with o th er environmental changes.
Altogether, 29 different fish species were caught and measured in th e 1 46 stu dy lakes (Table A1). In order to study the influence of the dominating fish species o n community responses, the 5 most common species were selected for analysis, in -cluding perch, pike (Esox lucius), roach, ruffe (Gymnocephalus cernuus) and common bream. The most common species were d eterm ined v ia frequency o f occurrence by calculating and ranking in how many of the 146 lakes each sp ecies appeared.
2.3 Data Analysis
To determine the impact of water colour on fish communities I stu died th e rela-tionships between absorbance and catch per unit effort (CPUE, in gram or number of individuals per net area) for whole communities and the most common species, mean fish body length, species richness, and community composition. CPUE was used as a response variable as it is a common proxy for population b io mass an d abundance. Mean body length can be associated with resource use and limitatio n. Moreover, body size greatly affects the structure and functioning of aquatic com -munities and large ecological networks (Woodward et al. 2 005 ). As lak es were sampled between 1 -16 years, I calculated the mean CPUE over the years. To cal-culate community CPUEbiomass per lake I first combined the weight of all individ u-als of all species and then divided their total biomass by net area. Species-specific CPUE was calculated in the same way by summing up the weight of all fish
12
caught of a species per lake and dividing it by net area. For CPUEnumbers the summed number of individuals per lake in total was divided by net area.
For fish body length data, I calculated the mean total body length o ver all sam-pling years per species and for the whole fish community. In addition, I calculated skewness of length to see if the relative proportion of small to large in d ividu als differs with absorbance.
Moreover, I calculated size diversity for each lake fish community using individu-al length measurements. Size diversity presents part of the functionindividu-al diversity of a community as body size combines several traits that influence co mm unity fu nc-tioning, and is therefore ecologically important (Woodward et al. 2005; Bru cet et al. 2018). For the calculation I used the open source software ‘diversity08’ by Quintana et al. (2008) available at >www.limnolam.org>. Following this n o npar-ametric method, the size diversity index (my) is computed using the Sh anno n d i-versity expression as basis and adapting it for continuous variables like size (Quin-tana et al. 2008). Size diversity is calculated as an integral including the probab il-ity densil-ity function (pdf; e.g. a function that describes the relative likelihood for a random variable to take on a given value) of the size of the individ ual fishes d e-scribed as follows:
𝜇 = − ∫ 𝑝𝑥 +∞
0
(𝑥)𝑙𝑜𝑔2𝑝𝑥(𝑥)𝑑𝑥
where px(x) is the pdf of size x (Brucet et al. 2018; Quintana et al. 2 0 08 ). Size diversity per lake community shows the size variation of all individuals o f a lake and with the regression analysis I could see if size diversity is affected b y b ro wn water colour.
Another measure I included is species richness, which is also a proxy of biological diversity of lake fish communities. Species richness is defined as “the number of species of a given taxon in the chosen assemblage” (Magurran 2004). More specif-ically, I used total species density per lake community observed over years as measure for species richness. Therefore, I counted the number of observed species per lake over all fish sampling occasions.
Given that there are multiple factors that can influence size and diversity of fish, I decided to test if the potential influence of absorbance on response variables hold s also when including lake area as a covariate. I chose to include lake area as a co -variate for absorbance in all regression analysis, because area m ight esp ecially limit fish biomass and diversity (Matuszek and Beggs 1988) and because data was available for all lakes. The relationship between lake area and absorbance resulted in a factor of -0.2550058.
I analysed the relationship between absorbance and CPUE, f ish len gth, sp ecies richness and size diversity using regression models with lake area as a cov ariate. As I wanted to know the effects of absorbance on fish metrics, absorbance depicted the independent value and all fish specific measures were analysdepicted as d ep end -ent variables. Linear regression models were used for all measures except
commu-13
nity composition and for CPUEbiomass and CPUEnumbers I additionally applied quan-tile regression models for the quanquan-tile levels 0.10, 0.50 and 0.90 to get further insight. Fish metric data was ln-transformed for normalization prior to regression analyses. Also, I conducted a visual inspection of residuals of CPUE, length d ata , number of species and size diversity from linear regressions. Nonsign ificant in -teraction terms for absorbance and lake area were removed before an aly sing th e separate effects of absorbance and lake area on the respective resp onse v alues. Apart from that, I focused on the direct effects of browning only and left potential interactions with other environmental changes out of my study.
To depict the variation of species composition in comm unities associated with differences in water colour, I carried out non-metric multidimensional scaling (NMDS). This was done using the metaMDS fuction in th e p ackage vega n in R (Oksanen et al. 2019). Stress levels were under 0.2 in all runs, which showed th at the data was suitable for two-dimensional interpretation. For visualisatio n o f d if-ferences between lakes with NMDS, I divided my lake data set in to two equ ally big groups by determining the median absorbance value and labelling all lak es with values lower than the median (5.41) as clear and all lakes with higher absorb-ance values as brown lakes. With the input of lake identification number, fish spe-cies and spespe-cies-specific biomass, a similarity matrix was generated. Based on this matrix of the multidimensional data a two-dimensional graph was computed. Sub-sequently, I tested f or significant differences in fish community composition across clear and brown lakes with permutational multivariate analysis of variance (PERMANOVA). PERMANOVA was carried out with 999 permutatio ns, u sin g the adonis function in the vegan package. All statistical tests and plots were d one in R 3.5.1 (R Core Team 2018).
14
Linear regression analyses revealed the relation of community bio mass, th e b io-mass of several of the most common species, total fish ab un dan ce, co mmunity length, length for several of the most common fish species, size diversity an d sp e-cies richness to absorbance, and additionally the effect of lake area a s co variate (Table 1). From additional quantile regression analyses for com mun ity b io mass and total fish abundance I obtained more detailed information on co mmu nity rsponses (Table A2). Lastly, NMDS and Permanova showed th e d ifferen ces b e-tween fish communities in clear and brown lakes (Fig.8).
Table 1: Statistical Results from the linear regression analysis
Response variable F R2 Explanatory variable Parame-ter (SE) T p Community biomass (CPUE) (LN) F(2, 143) = 5.303** 0.069 Intercept 3.200 (0.103) 31.069 < 2e-16 *** Absorbance -0.019 (0.006) -3.252 0.00143 ** Area -0.00037 (0.0005) -0.639 0.524 Perch biomass (LN) F(2,177) = 0.152 0.002 Intercept 2.007 (0.202) 9.906 < 2e-16 *** Absorbance -0.004 (0.013) -0.333 0.739 Area -0.001 (0.001) -0.507 0.613 Pike biomass F(3,115) = 3.636* 0.087 Intercept 1.023 (0.192) 5.319 5.2e-07 ***
3
Results
15 Response variable F R2 Explanatory variable Parame-ter (SE) T p (LN) Absorbance -0.023 (0.012) -1.969 0.514 . Area -0.005 (0.002) -3.118 0.0023 ** Absorb-ance*Area 0.0004 (0.0002) 1.724 0.0873 . Roach bio-mass (LN) F(2,101) = 4.149* 0.076 Intercept 1.986 (0.218) 9.11 8.19e-15 *** Absorbance -0.036 (0.132) -2.752 0.00703 ** Area -0.002 (0.001) -1.492 0.139 Ruffe biomass (LN) F(2,46) = 1.871 0.075 Intercept -2.064 (0.396) -5.209 4.34e-06 *** Absorbance -0.011 (0.023) -0.502 0.618 Area 0.003 (0.002) 1.695 0.0968 . Bream biomass (LN) F(2,31) = 1.19 0.071 Intercept 0.742 (0.402) 1.846 0.0744 . Absorbance -0.008 (0.018) -0.474 0.639 Area 0.002 (0.002) 1.194 0.242 Total fish abundance (CPUE) (LN) F(2,143) = 8.447 *** 0.106 Intercept -0.524 (0.128) -4.103 6.83e-05 *** Absorbance -0.029 (0.007) -4.042 8.61e-05 *** Area -0.0002 (0.0007) -0.282 0.779 Community length (LN) F(2,143) = 1.357 0.019 Intercept 4.914 (0.026) 189.20 8 <2e-16 ***
16 Response variable F R2 Explanatory variable Parame-ter (SE) T p Absorbance 0.002 (0.001) 1.344 0.181 Area -0.000 (0.000) -0.589 0.557 Perch length (LN) F(2,177) = 0.398 0.004 Intercept 4.866e+0 0 (3.056e-02) 159.23 8 <2e-16 *** Absorbance 1.602e-03 (1.932e-03) 0.829 0.408 Area -2.138e-05 (1.738e-04) -0.123 0.902 Pike length (LN) F(3,138) = 2.956 * 0.060 Intercept 6.251e+0 0 (4.036e-02) 154.89 4 <2e-16 *** Absorbance -7.562e-03 (2.614e-03) -2.893 0.00443 ** Area -7.288e-04 (3.391e-04) -2.149 0.03336 * Absorbance *Area 1.084e-04 (5.161e-05) 2.100 0.03757 * Roach length (LN) F(2,134) = 0.488 0.007 Intercept 4.913e+0 0 (3.343e-02) 146.97 1 <2e-16 *** Absorbance 1.422e-03 (2.180e-03) 0.652 0.515 Area -9.952e-05 -0.571 0.569
17 Response variable F R2 Explanatory variable Parame-ter (SE) T p (1.742e-04) Ruffe length (LN) F(2,52) = 4.903 * 0.159 Intercept 4.399 (0.042) 104.46 3 <2e-16 *** Absorbance 0.007 (0.003) 2.579 0.0128 * Area -0.0002 (0.0002) -1.140 0.2597 Bream length (LN) F(2,40) = 0.482 0.024 Intercept 5.321 (0.092) 58.147 <2e-16 *** Absorbance 0.003 (0.004) 0.591 0.558 Area -0.0002 (0.0004) -0.504 0.617 Size diversity (LN) F(2,143) = 2.442 . 0.033 Intercept 0.664 (0.022) 29.626 <2e-16 *** Absorbance 0.003 (0.001) 2.099 0.0376 * Area 0.0001 (0.0001) 1.190 0.2359 Species richness (number of species) (LN) F(2,143) = 19.89 *** 0.218 Intercept 3.847 (0.294) 13.077 <2e-16 *** Absorbance -0.018 (0.017) -1.063 0.29 Area 0.01 (0.002) 5.76 4.95e-08 *** . <0.1, *<0.05, **<0.01, ***<0.001
18
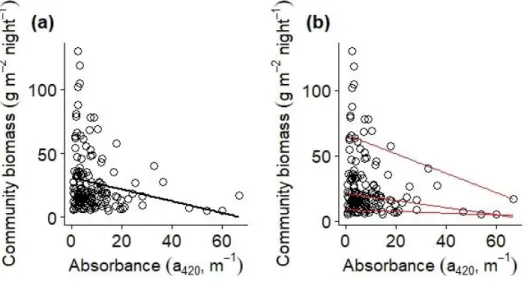
3.1 Community biomass
Lake community CPUEbiomass was negatively related to absorbance (Figure 2 , Ta-ble 1). This negative relationship was mainly caused by lower maximum b iomass levels in brown lakes (Fig. 2b, Table A2). The variation in biomass is clearly high-er between lakes with improved clarity (Fig. 2).
Figure 3: The relationship between community biomass and absorbance showing (a) a significant linear relationship (p<0.05) in black and (b) quantile regression lines in red, with the 0.5 and the 0.9, but not 0.1, quantile lines representing significant relationships. Each black circle represents observed data from an individual lake. It has to be noted that the regression lines in plots are only based on absorbance, whereas statistical analyses includ-ed lake area as co-variate.
3.2 Species specific biomass
There was a significant negative relationship between absor bance an d p ike and roach biomass (Fig. 4, Table 1). There was a negative trend, but n o t sign ificant, between the biomass of the other three species analysed (perch, ruffe an d b ream , Fig. 4, Table 1). Also, for pike CPUEbiomass there was a significant interaction b e-tween absorbance and lake area, suggesting that the relationship bee-tween absorb-ance and pike biomass differs depending on lake size (Table 1).
19 Figure 4: The relationship between biomass of a) perch, (b) pike, (c) roach, (d) ruffe, (d) bream and absorbance. Each black circle represents observed data from an individual lake. Solid regression lines represent significant (p<0.05) linear relationships, dashed lines non -significant linear relationships. It has to be noted that the regression lines in plots are only based on absorbance, whereas statistical analyses included lake area as covariate.
3.3 Community abundance
The total abundance of fish individuals (CPUEnumbers) was n egativ ely related to absorbance (Figure 5, Table 1). Similar to CPUEbiomass, between-lake variatio n in CPUEnumbers seems to be lower with darker water colour and the lower CPUEnumbers was caused by maximum, rather than mean abundance of fish individuals (Table A2).
20
Figure 5: The relationship between total fish abundance and absorbance with th e regres-sion line representing a significant (p<0.05) linear relationship. Each black circle represents observed data from an individual lake. It has to be noted that the regression line in the plot is only based on absorbance, whereas statistical analyses include lake area as covariate.
3.4 Community mean length and length diversity
In contrast to community biomass, there was no relationship b etween m ean f ish body length in lake fish communities and absorbance (Figure 6, Table 1). Howev -er, I did find species-specific body size responses to absorbance, with ruffe having a positive, biologically significant relationship and pike having a slightly negative, biologically weak (but significant) relationship to absorbance. Ju st lik e f or p ike biomass, there was an interaction between absorbance and lake area on pike length, Absorbance did not affect skewness of fish body lengths (p =0.84 8, F (1 , 144) = 0.03684)).
However, there was a positive relationship between length diversity an d abso rb -ance (Figure 6 (b), Table 1).
21 Figure 6: The relationship between absorbance and (a) mean individual fish length per lake fish community with a dashed line representing a non -significant linear relationship; (b) length diversity with the solid regression line representing a significant (p<0.05) relationship. Each black circle represents observed data from an individ ual lake. It has to be noted that the regression lines in plots are only based on absorbance, whereas statistica l analyses included lake area as covariate.
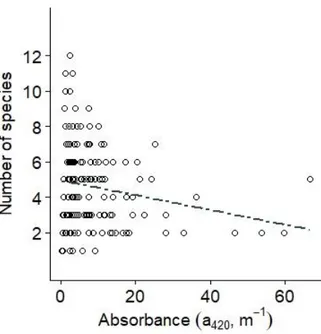
3.5 Species richness and community composition
There was a non-significant negative relationship between sp ecies rich ness an d absorbance (Figure 7, Table 1). Altogether, 29 species were caugh t in th e stu dy lakes, but some species just occurred in a few lakes or were only abundant in clear lakes. Community composition differed between clear and b ro wn lakes (PER-MANOVA, F=4.3514, p=0.001). However, most fish communities co nsisted o f the same common species, but their occurrence was reduced in browner lakes, as results above imply. The NMDS analysis shows that the fish communities d o n o t differ essentially in the occurring species depending on water colour, but that brown lake communities are composed of fewer species (Fig. 8).
22
Figure 7: The relationship between absorbance and species richness with the dashed regression line representing a non-significant (p>0.05) relationship. Each black circle represents observed data from an individual lake. It has to be noted that the regression lines in plots are only based on absorbance, whereas statistical analyses included lake area as covariate.
23 Figure 8: Two-dimensional non-metric multidimensional scaling plot showing the difference in com-munity composition between clear and brown lakes. Clear lakes are indicated with blue dots and brown lakes are indicated with brown dots. Species far away from each other in the plot are less likely to occur in the same lake than species plotted close to each other. Mean community composi-tion in clear lakes is depicted by the blue circle, and community composicomposi-tion in brown lakes is de-picted by the brown circle.
24
I found that a higher absorbance, thus a darker water colour, has a negative in flu -ence on fish community biomass. This was associated with lower biomass o f th e most common species, a lower number of fish individuals and differences in community composition in brown lakes. In contrast, I found no relation sh ip b e-tween absorbance and mean fish body length. The low community biomass in dark lakes was not because of one specific species having a lower population b iomass but was rather due to a lower biomass across many species, albeit only significant-ly for some. The difference between fish communities in clear an d b rown water lakes was mainly because communities in brown lakes appeared to b e m ore h o-mogeneous compared to clear water communities that were co mpo sed o f mo re different species.
Several different processes and factors can cause the observed lower fish com mu-nity biomass in brown compared to clear lakes. I found more variance in b iomass in clear lakes than in brown lakes and determined that esp ecially th e maximum possible fish biomass is negatively impacted by dark water. This suggests that fish biomass is probably limited by low resource availability in dark lakes and that th e maximum (rather than mean) fish community biomass is limited b y d ark water . Previous studies came to similar conclusions, as lower benthic primary production (Karlsson et al. 2009) and a subsequent decrease in zoobenthos biomass (Stasko et al. 2012) are likely to lead to lower (maximum) fish biomass (Solomon et al. 2015; Craig et al. 2017). Previous studies found that biomass production, but no t stand -ing stock biomass, was lower in dark lakes (e.g. Karlsson et al. 2015; van Dorst et al. 2019). Albeit I did not look at production, I found that standing stock b iomass was indeed lower in dark lakes when looking at whole fish communities. Th e d e-cline in community biomass was the result of a general biomass loss of many spe-cies (even though this was only statistically significant for a few spespe-cies). Desp ite potential species-speciec adaptations to dark light conditions (turbid or dark water colour) might benefit some species, I mainly found no or negative responses. Pre-vious studies suggest that environmental conditions in dark -coloured lakes are considered unfavourable for perch (Estlander et al. 2010), as they depend on go od light conditions for visual predation (Helfman 1979) and prefer structural complex habitats with macrophytes (Diehl 1988). Despite that, perch CPUEb io m a s s h as al-ready been reported in a previous study, and also here in my stud y, to sh ow n o relation to brown water colour (van Dorst et al. 2019). Roach, on the other hand, is
25
better adapted to feeding at low light intensities (Bohl 1980) and foraging in sim -ple structured habitats (Persson 1987), but despite these adaptation s, ro ach was significantly negatively related to absorbance in my study. Therefore, th ere mu st have been other factors than visibility, like resource limitation fo r ex ample, th at lead to a lower roach biomass in brown waters. When pike foraging behaviour was tested in brown water, capture success was high (Jönsson et al. 2 0 13) an d th ere was no difference in strike distance compared to in clear water (Ranåker et al. 2012). Nonetheless, pike biomass was negatively (but weakly) related to dark wa-ter colour in my analysis. Benthic fish could be hypothesized to be mo re sign if i-cantly affected by the impacts of reduced light penetration and lower benthic p ri-mary production. This does not seem to be the case in my study set, even though I did not test for it specifically. Still, the bottom dwelling, benthivorous species ruffe and bream (Ogle 1998; Löffler 1984) only showed a non-significant negative relationship to absorbance. Thus, different adaptations of f ish species to d arker water did probably not influence their responses. Instead, the likely lo w reso urce production in dark lakes might impact most fish species negatively. Nonetheless, more research is needed to resolve knowledge gaps.
Results demonstrated that the observed negative relationship between commun ity biomass and absorbance is due to few fish rather than smaller fish. It h as alread y been reported earlier that common fish species in Canada decrease in abu ndance with higher DOC concentrations (Benoît et al. 2016). Hedström et al. (2 0 16) re-ported that brownification increases the winter mortality and decreases body con-dition and prey biomass ingestion in three-spined stickleback (Gasterosteus
acule-atus) due to a decreased search efficiency when feeding in dark waters. Therefore,
in addition to lower prey availability, a higher winter mortality o f f ish in b rown lakes might be one reason for lower fish biomass in brown lakes. Dif feren ces in mean fish body size, in contrast, were not observed in relation to absorbance an d did therefore not influence fish biomass levels. In the case of specific fish popula-tions, like bluegill or perch, literature reported substantial differences in maximum size and size at age between dark and clear lakes (Craig et al. 2017; v an Dorst et al. 2019), indicating a relation between absorbance and fish length . Fro m th ese results, a trend towards lower mean fish length in relatio n to ab sorbance cou ld have been assumed. Even though this was not the case, a lack o f d ifference in mean length between lakes with different water colour does not mean that there is no growth response (see van Dorst et al. 2019). Also, fish length response at co m-munity level seems to differ from population level responses. This could be due to different species compositions in dark and clear lakes, as the mean fish b o dy size of a community is a function of abundant species. In contrast to mean body size, I found that size diversity in communities was positively influenced by darker water colour. Given that community niche space is mainly determined by body size (Woodward et al. 2005), changes in size diversity may lead to shifts in community structure (García-Comas et al. 2016; Brucet et al. 2018). Regardin g th is, a h igh size diversity in dark lakes would suggest a diversified trophic n iche u se with in communities. Nonetheless, it is unknown whether size diversity response is in ter-related with the absorbance-biomass relationship.
26
Dark waters do not only constrain the number of fish in div idu als, b u t also f ish community composition. Even though a relationship between absorbance an d a loss in species richness could not be proven statistically, communities in clear lakes appeared to comprise more species than brown water lakes. Community composition differed noticeably between clear and brown lakes, with some species like arctic charr, minnow or burbot not being present at all in darker lakes. Perch, pike and roach were the most commonly occurring species in my lak e d ata set, which is typical for small boreal forest lakes (Olin et al. 2 0 10) an d th is d id n o t differ with lake colour. A constrained species composition in darker lakes definite-ly impacted community biomass, considering that the species that occurred in brown lakes additionally showed lower biomass than in clear lakes. Fu rth er re-search is needed to understand differences in community composition with water colour, where potential factors could be shifts in domin an ce o f certain f eeding guilds or fish orders. Investigating all these before mentioned factors on th e lev el of whole communities is a novelty and contributes to the current k n owledge o n effects of browning in temperate and boreal lakes, adding to earlier stu dies th at have mainly focused on specific species and populations (Finstad et al. 201 4; Be-noît et al. 2016; Craig et al. 2017; van Dorst et al. 2019).
There are also other mechanisms that could influence co mmunity b iom ass and other community metrics, which were not addressed in my study. For example, the influence of variables such as water colour on community structure can be density dependent, e.g. through competition or predation (Olin et al. 2010; Horppila et al. 2010). Horppila et al. (2011) showed that darker water colou r stro ngly affected fish feeding rate because of decreased visibility. A decreased search efficiency and a changing food selectivity in fishes due to darker water colour has also been found in other studies (Estlander et al. 2010; Estlander et al. 2012; Olin et al. 2010; Ranåker et al. 2014). Although these previous studies d id n ot in v estigate population responses, it can be assumed that a reduced fish feeding rate p robably impacts fish biomass. Thus, a reduced feeding rate in darker lak es m igh t b e o ne reason for a lower community biomass in my study. Furthermore, fish com mun i-ties in darker lakes could be impacted by a lower food web efficiency. This m igh t be the case because browning can favour microbial loops, which, in tu rn, lead to reduced energy levels at higher trophic levels, and thereby a lo wer fish b iomass (Lefébure et al. 2013).
Moreover, abiotic factors also need to be considered when assessin g impacts o f water colour on lake fish communities. Thermocline dep th, a p roxy fo r h abitat availability, for example, is reported to be negatively related to DOC co ncentra-tions (Craig et al. 2017). However, they found that fish CPUE was po sitiv ely re-lated to thermocline depth. This suggests that the well-oxygenated epilimnion decreases with higher absorbance and consequently fish biomass decreases. Fu r-thermore, phosphorus, which is an indicator of lake productivity, could act as p re-dictor for fish growth rate and abundance (Benoît et al. 2016). Ad ditio nally, p H values also influence fish biomass (Horppila et al. 2010) and can be a valid covari-ate in fish biomass analyses. A study by Seekell et al. (2018) suggested a moderat-ing effect of lake morphometry on the relationship between water colour an d f ish biomass. Whereas I addressed this issue to some extent by including lake area as a
27
covariate, they focused on the influence of mean lake depth , as th e d ep th in flu-ences the degree of light extinction. All above mentioned f actors are ju st a f ew examples of influencing factors on fishes that need to b e f urther stu died in th e combination of fish communities and water colour.
It goes without saying that the effects of browning vary depending on the co ntext and the initial state of the lake (Williamson et al. 2015). While I looked at d iffer-ences between already clear and brown lakes (space-for-time ap proach ) an d n o t changes over time, investigating temporal shifts in lake fish communities would be another element worthwhile to look at, given the availability of data covering long enough time series. For example, it is hypothesized, that initially clear oligotrophic lakes are more sensitive to browning than lakes with higher initial d issolved o r-ganic matter loadings (Williamson et al. 2015). However, Fin stad et al. (2 0 14), found an initial increase in fish CPUE due to increasing DOC, followed by a su b-sequent decline with ongoing DOC increases. Therefore , th ey su ggested a u ni-modal fish yield response due to water DOC, depending on starting values of DOC.
Although my study would suggest a decreased fish biomass in northern lakes th at become increasingly brown, climate change impacts like warming an d a sub se-quent productivity increase in the north might also lead to different reactions. Hayden et al. (2017) studied lakes in the subarctic and demonstrated th at clim at e change leads to increased lake productivity and consequ ently to in creased f ish density and biomass, but also to a decreasing size among individuals o f th e com-munity. Thus, I want to highlight the crucial factor of ecoregion and in itial tem-perature of lakes when making predictions about biomass respon ses to climate change.
In view of my findings, I would argue that no single factor is responsible fo r th e difference in community biomass along the water colour gradient, b ut th at th ere are several contributing factors. It is suggested that the lower community bio mass is linked to negative responses of several species rather than one or two domin an t species. Moreover, the biomass loss is reinforced by a reduction in species ab un-dance and individual fish abunun-dance. With ongoing climate change, further browning in the future is anticipated (Larsen et al. 2011; Seekell et al. 2018; Weyhenmeyer et al. 2016; Seekell et al. 2015) and therefore m o re research and knowledge, but also adaptive management strategies are needed. A stu d y mod el-ling future scenarios for Swedish lakes considering climate change effects calcu-lated worst-case absorbance increase factors between 1.1 and 7.6 (with a media n of 1.3; Weyhenmeyer et al. 2016). Seekell et al. (2015) even estimated a lo ss o f 8.7 % in whole-lake primary production per decade for south ern Swed en d u e to DOC. Therefore, it is likely that fish biomass will decrease in many Swedish lakes, which could also impact biodiversity, food -web stability, ecosystem-function, food provision and economics. Nonetheless, th e adaptiv e capacity o f fishes may to some extent mitigate the intensity of such adverse e ffects. On th e contrary, it has been indicated that fish populations in darker lakes m igh t b e less resilient to sustained fishing pressure (Craig et al. 2017). However, I would a rgue
28
that it is important to incorporate lake browning effects on fish co mm unities fo r sustainable fisheries management (see also Benoît et al. 2016).
29
In conclusion, a darker water colour showed to have a negative effect on fish community biomass. I studied different community metrics of a large data set with lakes ranging from clear to brown water colour and inferred, th at n ot o n e f actor leads to a lower biomass in brown lakes but rather that several influencing factors together lead to a biomass loss. As communities in browner lakes appear to co m-pose fewer species and even the occurring species show a lower biomass and low-er numblow-er of individuals, this might be the primary undlow-erlying reason for commu-nity biomass loss.
In face of ongoing climate change and further water browning being predicted, my study provides novel insights into effects of environm en tal an d an throp ogenic stressors on fish ecology. As this is probably the first stu d y fo cu sin g o n th e re-sponse of fish communities to absorbance, further research is needed and suggest-ed. In order to enhance understanding and make forecasts, possible shifts in com-munity composition, changes over time and more comcom-munity metrics n eed to b e studied in relation to water colour. For example, reproduction success, gro wth o r mortality could be possible measures to look at. Moreover, it could be investigated if certain feeding guilds or fish orders dominate in darker lakes and lead to compo-sitional changes. Finally, as fish community biomass is adversely affected b y wa-ter colour, this needs to be considered when managing lakes affected by browning.
30
Appelberg, M.; Berger, H.-M.; Hesthagen, T.; Kleiven, E.; Kurkilahti, M.; Rai-taniemi, J.; Rask, M. (1995): Development and intercalibration of methods in nor-dic freshwater fish monitoring. Water Air Soil Pollut 85 (2), pp. 401–406. DOI: 10.1007/bf00476862.
Ask, J.; Karlsson, J.; Persson, L.; Ask, P.; Byström, P.; Jansson, M. (2009): Ter-restrial organic matter and light penetration: Effects on bacterial and primary pro-duction in lakes. Limnol. Oceanogr. 54 (6), pp. 2034–2040. DOI:
10.4319/lo.2009.54.6.2034.
Bartels, P.; Hirsch, P. E.; Svanbäck, R.; Eklöv, P. (2016): Dissolved Organic Car-bon Reduces Habitat Coupling by Top Predators in Lake Ecosystems. Ecosystems 19 (6), pp. 955–967. DOI: 10.1007/s10021-016-9978-x.
Benoît, P.-O; Beisner, B. E.; Solomon, C. T. (2016): Growth rate and abundance of common fishes is negatively related to dissolved organic carbon concentration in lakes. Can. J. Fish. Aquat. Sci. 73 (8), pp. 1230–1236. DOI: 10.1139/cjfas-2015-0340.
Björnerås, C.; Weyhenmeyer, G. A.; Evans, C. D.; Gessner, M. O.; Grossart, H.-P.; Kangur, K. et al. (2017): Widespread Increases in Iron Concentration in Euro-pean and North American Freshwaters. Global Biogeochem. Cycles 31 (10), pp. 1488–1500. DOI: 10.1002/2017GB005749.
Bohl, E. (1980): Diel pattern of pelagic distribution and feeding in planktivorous fish. Oecologia 44 (3), pp. 368–375. DOI: 10.1007/BF00545241.
Brucet, S.; Arranz, I.; Mehner, T.; Argillier, C.; Beklioğlu, M.; Benejam, L. et al. (2018): Size diversity and species diversity relationships in fish assemblages of Western Palearctic lakes. Ecography 41 (7), pp. 1064–1076. DOI:
10.1111/ecog.03255.
31
CEN (2015). Water quality ‐ Sampling of fish with multimesh gillnets (EN 14757). CEN, the European Committee for Standardization. Retrieved from https://standards.cen.eu/dyn/www/f?p=204:110:0::::FSP_PROJECT,FSP_ORG_I D:39032,6211&cs=1C192947B933FDA136DF07F2CD514559B
Craig, N.; Jones, S. E.; Weidel, B. C.; Solomon, C. T. (2017): Life history con-straints explain negative relationship between fish productivity and dissolved or-ganic carbon in lakes. Ecology and evolution 7 (16), pp. 6201–6209. DOI: 10.1002/ece3.3108.
Creed, I. F.; Bergström, A.-K.; Trick, C. G.; Grimm, N. B.; Hessen, D. O.; Karls-son, J. et al. (2018): Global change-driven effects on dissolved organic matter composition: Implications for food webs of northern lakes. Global change biology 24 (8), pp. 3692–3714. DOI: 10.1111/gcb.14129.
Diehl, S. (1988): Foraging Efficiency of Three Freshwater Fishes: Effects of Structural Complexity and Light. Oikos 53 (2), p. 207. DOI: 10.2307/3566064. Estlander, S.; Nurminen, L.; Olin, M.; Vinni, M.; Immonen, S.; Rask, M. et al. (2010): Diet shifts and food selection of perch Perca fluviatilis and roach Rutilus rutilus in humic lakes of varying water colour. Journal of Fish Biology 77 (1), pp. 241–256. DOI: 10.1111/j.1095-8649.2010.02682.x.
Estlander, S.; Horppila, J.; Olin, M.; Vinni, M.; Lehtonen, H.; Rask, M.; Nur-minen, L. (2012): Troubled by the humics - effects of water colour and interspecif-ic competition on the feeding effinterspecif-iciency of planktivorous perch. Boreal
Environ-ment Research 17, pp. 305–312.
Finstad, A. G.; Andersen, T.; Larsen, S.; Tominaga, K.; Blumentrath, S.; Wit, H. A. et al. (2016): From greening to browning: Catchment vegetation development and reduced S-deposition promote organic carbon load on decadal time scales in Nordic lakes. Scientific reports 6, p. 31944. DOI: 10.1038/srep31944.
Finstad, A. G.; Helland, I. P.; Ugedal, O.; Hesthagen, T.; Hessen, D. O. (2014): Unimodal response of fish yield to dissolved organic carbon. Ecology letters 17 (1), pp. 36–43. DOI: 10.1111/ele.12201.
García-Comas, C.; Sastri, A. R.; Ye, L.; Chang, C.-Y; Lin, F.-S.; Su, M.-S. et al. (2016): Prey size diversity hinders biomass trophic transfer and predator size di-versity promotes it in planktonic communities. Proceedings. Biological sciences 283 (1824). DOI: 10.1098/rspb.2015.2129.
Hayden, B.; Myllykangas, J.-P.; Rolls, R. J.; Kahilainen, K. K. (2017): Climate and productivity shape fish and invertebrate community structure in subarctic lakes. Freshw Biol 62 (6), pp. 990–1003. DOI: 10.1111/fwb.12919.
32
Hedström, P.; Bystedt, D.; Karlsson, J.; Bokma, F.; Byström, P. (2016): Brownifi-cation increases winter mortality in fish. Oecologia 183 (2), pp. 587–595. DOI: 10.1007/s00442-016-3779-y.
Helfman, G. S. (1979): Twilight Activities of Yellow Perch, Perca flavescens. J.
Fish. Res. Bd. Can. 36 (2), pp. 173–179. DOI: 10.1139/f79-027.
Horppila, J.; Olin, M.; Vinni, M.; Estlander, S.; Nurminen, L.; Rask, M. et al. (2010): Perch production in forest lakes: the contribution of abiotic and biotic factors. Ecology of Freshwater Fish 19 (2), pp. 257–266. DOI: 10.1111/j.1600-0633.2010.00410.x.
Horppila, J.; Estlander, S.; Olin, M.; Pihlajamäki, J.; Vinni, M.; Nurminen, L. (2011): Gender-dependent effects of water quality and conspecific density on the feeding rate of fish - factors behind sexual growth dimorphism. Oikos 120 (6), pp. 855–861. DOI: 10.1111/j.1600-0706.2010.19056.x.
Hu, C.; Muller-Karger, F. E.; Zepp, R. G. (2002): Absorbance, absorption coeffi-cient, and apparent quantum yield: A comment on common ambiguity in the use of these optical concepts. Limnol. Oceanogr. 47 (4), pp. 1261–1267. DOI: 10.4319/lo.2002.47.4.1261.
IPCC (Ed.) (2014): Climate change 2014: Synthesis report. Contribution of work-ing groups I, II and III to the fifth assessment report of the intergovernmental pan-el on climate change. With assistance of Core Writing Team, R.K. Pachauri and L.A. Meyer (eds). Geneva, Switzerland.
IUPAC (1997). Compendium of Chemical Terminology, 2nd ed. (the "Gold Book"). Compiled by A. D. McNaught and A. Wilkinson. Blackwell Scientific Publications, Oxford. Online version (2019-) created by S. J. Chalk.
DOI:10.1351/goldbook
Jansson, M. (2003): Allochthonous organic carbon decreases pelagic energy mobi-lization in lakes. Limnol. Oceanogr. 48 (4), pp. 1711–1716. DOI:
10.4319/lo.2003.48.4.1711.
Jansson, M.; Bergström, A.-K.; Blomqvist, P.; Drakare, S. (2000): Allochthonous organic carbon and phytoplankton/bacterioplankton production relationships in lakes. Ecology 81 (11), pp. 3250–3255. DOI:
10.1890/0012-9658(2000)081[3250:AOCAPB]2.0.CO;2.
Jönsson, M.; Ranåker, L.; Nilsson, P. A.; Brönmark, C. (2013): Foraging efficien-cy and prey selectivity in a visual predator: differential effects of turbid and humic water. Can. J. Fish. Aquat. Sci. 70 (12), pp. 1685–1690. DOI: 10.1139/cjfas-2013-0150.
33
Karlsson, J.; Bergström, A.-K.; Byström, P.; Gudasz, C.; Rodríguez, P.; Hein, C. (2015): Terrestrial organic matter input suppresses biomass production in lake ecosystems. Ecology 96 (11), pp. 2870–2876. DOI: 10.1890/15-0515.1.
Karlsson, J.; Byström, P.; Ask, J.; Ask, P.; Persson, L.; Jansson, M. (2009): Light limitation of nutrient-poor lake ecosystems. Nature 460 (7254), pp. 506–509. DOI: 10.1038/nature08179.
Kelly, P. T.; Solomon, C. T.; Zwart, J. A.; Jones, S. E. (2018): A Framework for Understanding Variation in Pelagic Gross Primary Production of Lake Ecosys-tems. Ecosystems 21 (7), pp. 1364–1376. DOI: 10.1007/s10021-018-0226-4. Kirk, J. T. O. (1994): Light abd Photosynthesis in Aquatic Ecosystems. Cam-bridge, UK: Cambridge Univ. Press.
Kritzberg, E. S.; Ekström, S. M. (2012): Increasing iron concentrations in surface waters – a factor behind brownification? Biogeosciences 9 (4), pp. 1465– 1478. DOI: 10.5194/bg-9-1465-2012.
Kritzberg, E. S. (2017): Centennial-long trends of lake browning show major ef-fect of afforestation. Limnol. Oceanogr. 2 (4), pp. 105–112. DOI:
10.1002/lol2.10041.
Larsen, S.; Andersen, T.; Hessen, D. O. (2011): Predicting organic carbon in lakes from climate drivers and catchment properties. Global Biogeochem. Cycles 25 (3), n/a-n/a. DOI: 10.1029/2010GB003908.
Lefébure, R.; Degerman, R.; Andersson, A.; Larsson, S.; Eriksson, L-O; Båmstedt, U.; Byström, P. (2013): Impacts of elevated terrestrial nutrient loads and tempera-ture on pelagic food-web efficiency and fish production. Global change biology 19 (5), pp. 1358–1372. DOI: 10.1111/gcb.12134.
Ljunggren, L.; Sandström, A. (2007): Influence of visual conditions on foraging and growth of juvenile fishes with dissimilar sensory physiology. Journal of Fish
Biology 70 (5), pp. 1319–1334. DOI: 10.1111/j.1095-8649.2007.01412.x.
Löffler, H. (1984): Zur Ökologie des Brachsen (Abramis brama (L.)) im Boden-see. Schweiz. Z. Hydrologie 46 (1), pp. 147–162. DOI: 10.1007/BF02538105. Magnuson, J. J.; Destasio, B. T. (2008): Thermal niche of fishes and global warm-ing. In Chris Michael Wood, D. G. MacDonald (Eds.): Global warmwarm-ing. Implica-tions for freshwater and marine fish. Digitally printed version. Cambridge: Cam-bridge Univ. Press (Society for Experimental Biology seminar series, 61), pp. 377–408.
Magurran, A. E. (2004): Measuring biological diversity. Malden, Ma.: Blackwell Publ. Available online at
34
Matuszek, J. E.; Beggs, G. L. (1988): Fish Species Richness in Relation to Lake Area, pH, and Other Abiotic Factors in Ontario Lakes. Can. J. Fish. Aquat. Sci. 45 (11), pp. 1931–1941. DOI: 10.1139/f88-225.
Miljödata - MVM (2019): National data host lakes and watercourses, and national data host agricultural land. Swedish University of Agricultural Sciences (SLU). Available online at http://miljodata.slu.se/mvm, checked on 3/11/2019.
Monteith, D. T.; Stoddard, J. L.; Evans, C.r D.; Wit, H. A. de; Forsius, M;
Høgåsen, T. et al. (2007): Dissolved organic carbon trends resulting from changes in atmospheric deposition chemistry. Nature 450 (7169), pp. 537–540. DOI: 10.1038/nature06316.
National Register of Survey test-fishing - NORS (2019). Swedish University of Agricultural Sciences, Department of Aquatic Resources. Available online at http://www.slu.se/sjoprovfiskedatabasen, updated on 10/31/2017.
Ogle, D. H. (1998): A Synopsis of the Biology and Life History of Ruffe. Journal
of Great Lakes Research 24 (2), pp. 170–185. DOI:
10.1016/S0380-1330(98)70811-1.
Okorafor, K. A. (2014): Ecological Responses of Freshwater Components to Cli-mate Change Impacts: A Review. ARPN Journal of Science and Technology 4 (11), pp. 654–665. Available online at
http://www.ejournalofscience.org/archive/vol4no11/vol4no11_5.pdf.
Oksanen, J.; Blanchet, F. G.; Friendly, M.; Kindt, R.; Legendre, P.; McGlinn, D. et al. (2019): vegan: Community Ecology Package. Version R package version 2.5-4. Available online at https://CRAN.R-project.org/package=vegan.
Olin, M.; Vinni, M.; Lehtonen, H.; Rask, M.; Ruuhijärvi, J.; Saulamo, K.; Ala-Opas, P. (2010): Environmental factors regulate the effects of roach Rutilus rutilus and pike Esox lucius on perch Perca fluviatilis populations in small boreal forest lakes. Journal of Fish Biology 76 (6), pp. 1277–1293. DOI: 10.1111/j.1095-8649.2010.02559.x.
Persson, L. (1987): Effects of habitat and season on competitive interactions be-tween roach (Rutilus rutilus) and perch (Perca fluviatilis). Oecologia 73 (2), pp. 170–177. DOI: 10.1007/BF00377504.
Pilla, R. M.; Williamson, C. E.; Zhang, J.; Smyth, R. L.; Lenters, J. D.; Brentrup, J. A. et al. (2018): Browning‐Related Decreases in Water Transparency Lead to Long‐Term Increases in Surface Water Temperature and Thermal Stratification in Two Small Lakes. J. Geophys. Res. Biogeosci. 123 (5), pp. 1651–1665. DOI: 10.1029/2017JG004321.
Poff, N. L.; Brinson, M. M.; Day, J. W. (2002): Aquatic Ecosystems & Global Climate Change - Potential Impacts on Inland Freshwater and Coastal Wetland
35
Ecosystems in the United States. Available online at
https://www.c2es.org/site/assets/uploads/2002/01/aquatic.pdf.
Quintana, X. D.; Brucet, S.; Boix, D.; López-Flores, R.; Gascón, S.; Badosa, A. et al. (2008): A nonparametric method for the measurement of size diversity with emphasis on data standardization. Limnol. Oceanogr. Methods 6 (1), pp. 75–86. DOI: 10.4319/lom.2008.6.75.
R Core Team (2018): R: A language and environment for statistical computing. Vienna, Austria: R Foundation for Statistical Computing. Available online at https://www.R-project.org/.
Ranåker, L.; Jönsson, M.; Nilsson, P. A.; Brönmark, C. (2012): Effects of brown and turbid water on piscivore-prey fish interactions along a visibility gradient.
Freshwater Biology 57 (9), pp. 1761–1768. DOI:
10.1111/j.1365-2427.2012.02836.x.
Ranåker, L.; Persson, J.; Jönsson, M.; Nilsson, P. A.; Brönmark, C. (2014): Pis-civore-prey fish interactions: mechanisms behind diurnal patterns in prey selectivi-ty in brown and clear water. PloS one 9 (11), e102002. DOI:
10.1371/journal.pone.0102002.
Seekell, D. A.; Byström, P.; Karlsson, J. (2018): Lake morphometry moderates the relationship between water color and fish biomass in small boreal lakes. Limnol.
Oceanogr. 63 (5), pp. 2171–2178. DOI: 10.1002/lno.10931.
Seekell, D. A.; Lapierre, J.-F.; Ask, J.; Bergström, A.-K.; Deininger, A.;
Rodríguez, P.; Karlsson, J. (2015): The influence of dissolved organic carbon on primary production in northern lakes. Limnol. Oceanogr. 60 (4), pp. 1276–1285. DOI: 10.1002/lno.10096.
Solomon, C. T.; Jones, S. E.; Weidel, B. C.; Buffam, I.; Fork, M. L.; Karlsson, J. et al. (2015): Ecosystem Consequences of Changing Inputs of Terrestrial Dis-solved Organic Matter to Lakes: Current Knowledge and Future Challenges.
Eco-systems 18 (3), pp. 376–389. DOI: 10.1007/s10021-015-9848-y.
Stasko, A. D.; Gunn, J. M.; Johnston, T. A. (2012): Role of ambient light in struc-turing north-temperate fish communities: potential effects of increasing dissolved organic carbon concentration with a changing climate. Environ. Rev. 20 (3), pp. 173–190. DOI: 10.1139/a2012-010.
van Dorst, R. M.; Gårdmark, A.; Svanbäck, R.; Beier, U.; Weyhenmeyer, G. A.; Huss, M. (2019): Warmer and browner waters decrease fish biomass production.
Global change biology. DOI: 10.1111/gcb.14551.
Vasconcelos, F. R.; Diehl, S.; Rodríguez, P.; Hedström, P.; Karlsson, J.; Byström, P. (2016): Asymmetrical competition between aquatic primary producers in a
36
warmer and browner world. Ecology 97 (10), pp. 2580–2592. DOI: 10.1002/ecy.1487.
Weyhenmeyer, G. A.; Müller, R. A.; Norman, M.; Tranvik, L. J. (2016): Sensitivi-ty of freshwaters to browning in response to future climate change. Climatic
Change 134 (1-2), pp. 225–239. DOI: 10.1007/s10584-015-1514-z.
Weyhenmeyer, G. A.; Prairie, Y. T.; Tranvik, L. J. (2014): Browning of boreal freshwaters coupled to carbon-iron interactions along the aquatic continuum. PloS
one 9 (2), e88104. DOI: 10.1371/journal.pone.0088104.
Williamson, C. E.; Overholt, E. P.; Pilla, R. M.; Leach, T. H.; Brentrup, J. A.; Knoll, L. B. et al. (2015): Ecological consequences of long-term browning in lakes. Scientific reports 5, p. 18666. DOI: 10.1038/srep18666.
Wit, H. A. de; Mulder, J.; Hindar, A.; Hole, L. (2007): Long-term increase in dis-solved organic carbon in streamwaters in Norway is response to reduced acid dep-osition. Environmental science & technology 41 (22), pp. 7706–7713. DOI: 10.1021/es070557f.
Woodward, G.; Ebenman, B.; Emmerson, M.; Montoya, J. M.; Olesen, J. M.; Valido, A.; Warren, P. H. (2005): Body size in ecological networks. Trends in
ecology & evolution 20 (7), pp. 402–409. DOI: 10.1016/j.tree.2005.04.005.
Woodward, G.; Perkins, D. M.; Brown, L. E. (2010): Climate change and freshwa-ter ecosystems: impacts across multiple levels of organization. Philosophical
transactions of the Royal Society of London. Series B, Biological sciences 365
(1549), pp. 2093–2106. DOI: 10.1098/rstb.2010.0055.
Wrona, F. J.; Prowse, T. D.; Reist, J. D.; Hobbie, J. E.; Lévesque, L. M. J.; Vin-cent, W. F. (2006): Climate Change Effects on Aquatic Biota, Ecosystem Structure and Function. AMBIO: A Journal of the Human Environment 35 (7), pp. 359–369. DOI: 10.1579/0044-7447(2006)35[359:CCEOAB]2.0.CO;2.
Xu, L.; Myneni, R. B.; Chapin III, F. S.; Callaghan, T. V.; Pinzon, J. E.; Tucker, C. J. et al. (2013): Temperature and vegetation seasonality diminishment over northern lands. Nature Clim Change 3 (6), pp. 581–586. DOI:
10.1038/NCLIMATE1836.
37
I would first like to thank my thesis supervisors Magnus Huss and Renee van Dorst for their great support, useful comments and full engagement throughout the thesis process. I am happy to have chosen to write my thesis at the Aqua institute. I would also like to thank for the opportunity to conduct fieldwo rk f or th e Aq ua institute which was a great balance to the thesis work. A big thank you also to all my friends and study colleagues who gave advice, answered questions and listened to my thoughts or problems. Thanks also to my co-supervisor Stefan Sch mu t z. Finally, I must express my gratitude to my family for providing me with co ntin u-ous support and encouragement throughout all the years.
Thank you. Stephanie Koch